|
Health Indicators, vol. 2003, no. 2 >
Health regions |

|
Health region peer groups
Recent changes in health region boundaries and names
‘Health region’ refers to a geographic unit defined by the
provincial ministries of health. They are legislated administrative areas
in all provinces except Nova Scotia. For complete Canadian coverage,
each of the northern territories also represents a health region.
List of health regions, in effect as of June 2003 (PDF)
The following table presents an overview of health regions in Canada,
by province and territory and links to maps (jpeg or pdf) for viewing
current boundaries.
Health regions (2003) in Canada
| Province |
Health
regions |
Units |
Maps |
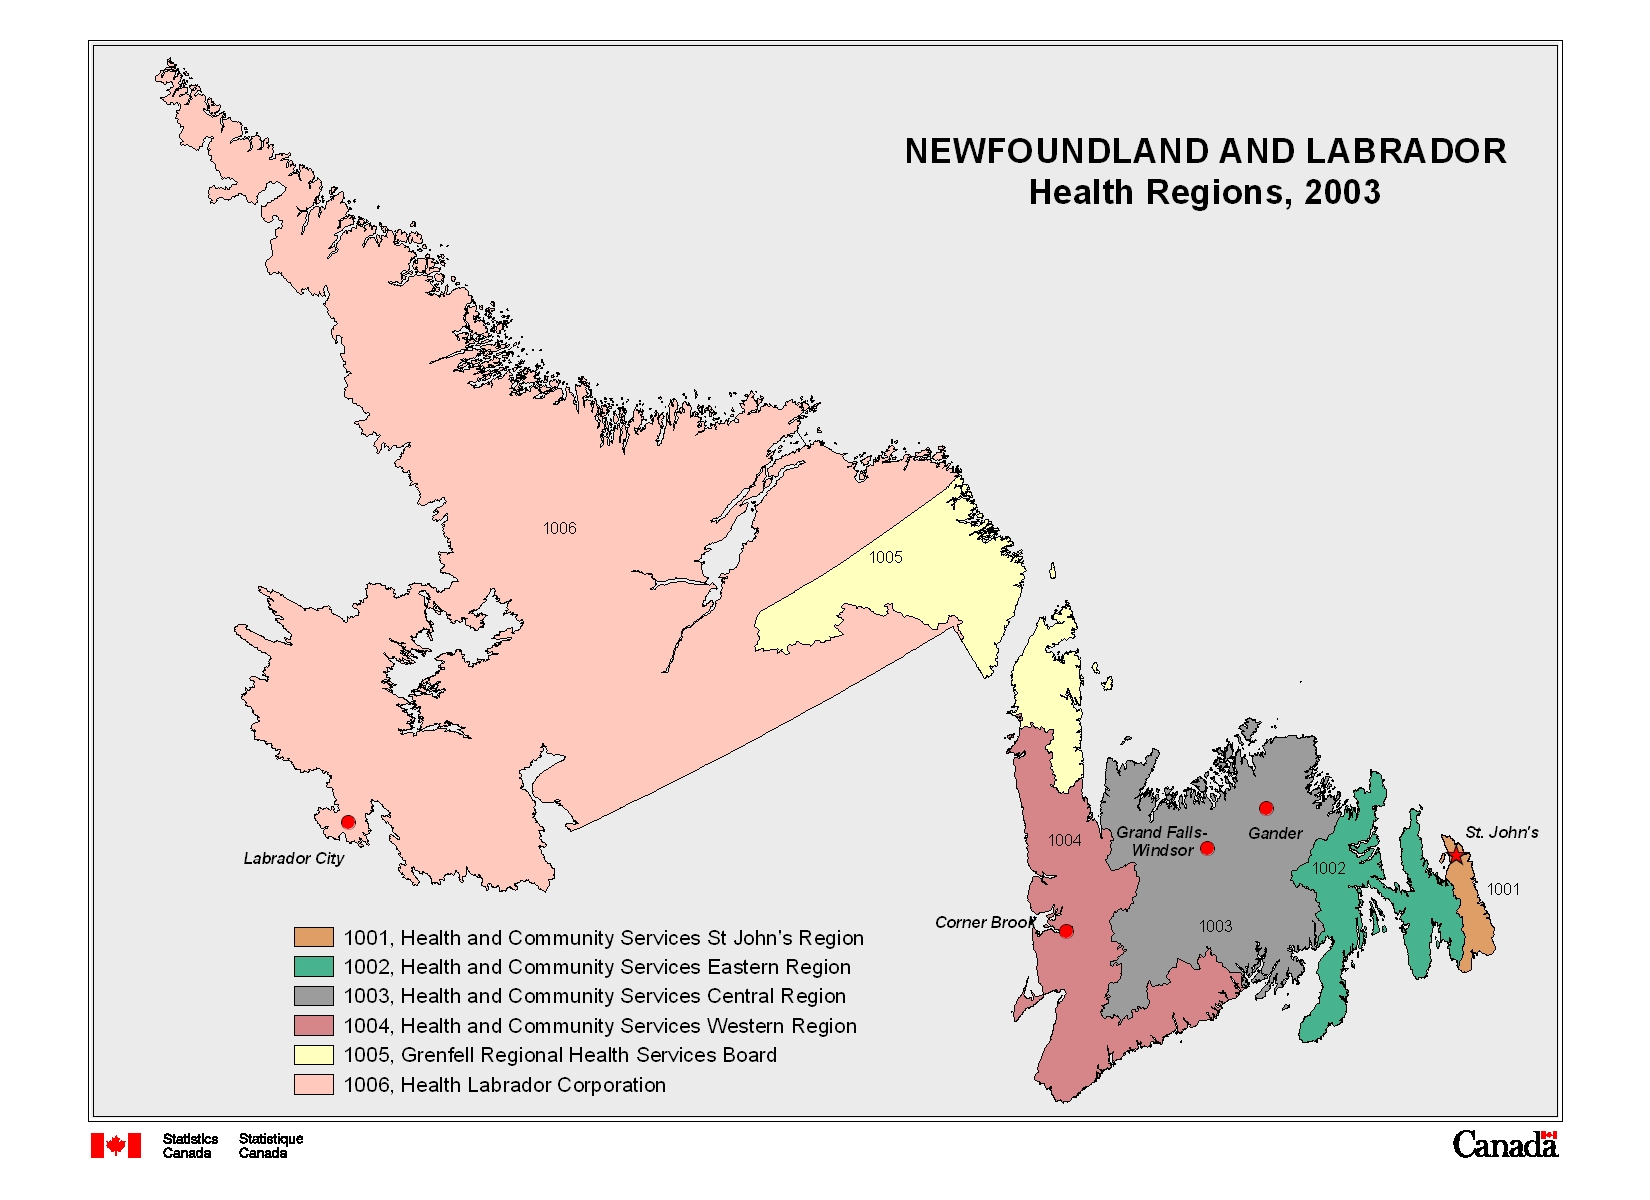
| Newfoundland and Labrador |
Community Health Regions |
6 |
jpeg
|
pdf |
| Prince Edward Island |
Health Regions |
4 |
jpeg
|
pdf
|
| Nova Scotia1 |
Health Regions (Zones) |
6 |
jpeg
|
pdf
|
| New Brunswick |
Health (Hospital) Regions |
7 |
jpeg
|
pdf
|
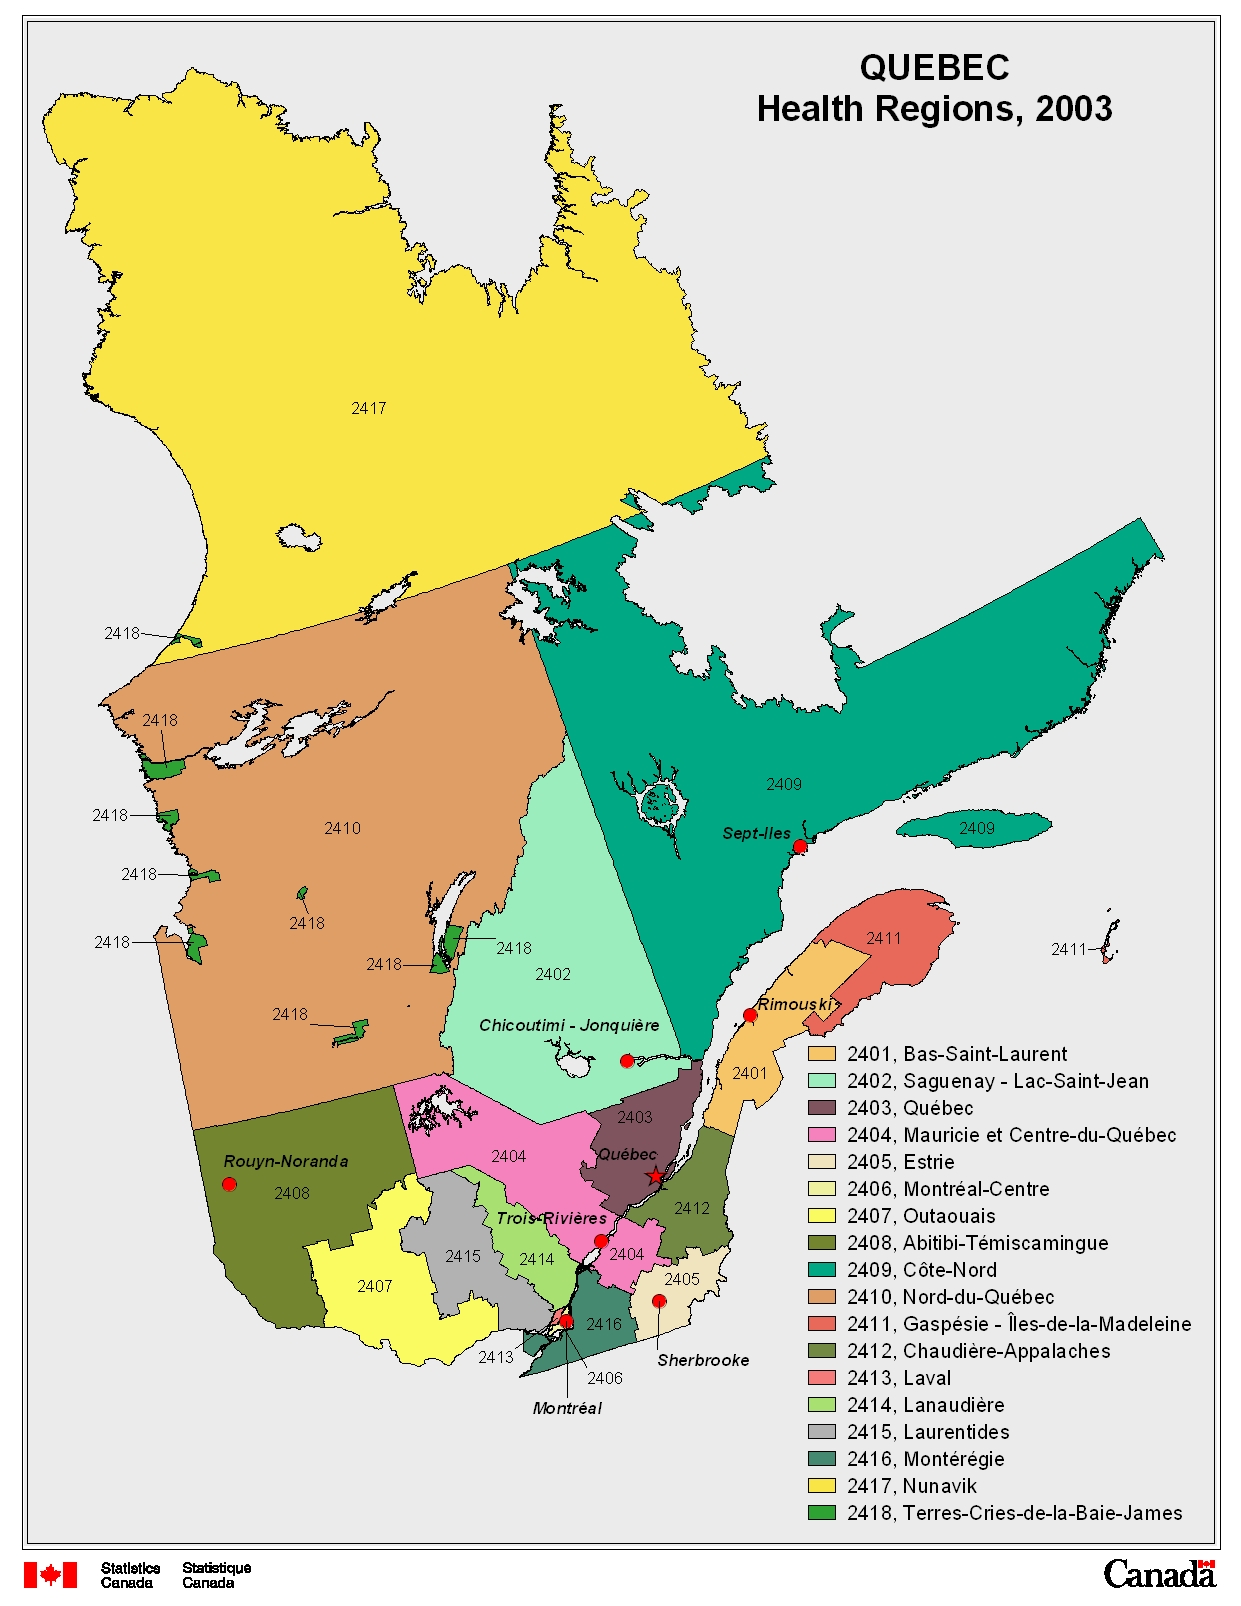
| Quebec |
Régions sociosanitaires (RSS)
|
18 |
jpeg
|
pdf
|
| Ontario2
|
Public Health Units (PHU)
District
Health Councils (DHC) |
37
16 |
jpeg jpeg
jpeg |
pdf pdf
pdf |
| Manitoba |
Regional Health
Authorities |
11 |
jpeg
|
pdf
|
| Saskatchewan |
Regional Health
Authorities |
13 |
jpeg
|
pdf
|
| Alberta |
Regional Health
Authorities |
9 |
|
pdf
|
| British Columbia |
Health Service Delivery Areas
|
16
|
|
pdf
|
| Yukon Territory |
Entire territory |
1 |
|
pdf
|
| Northwest Territories |
Entire territory |
1 |
|
pdf
|
| Nunavut |
Entire territory |
1 |
|
pdf
|
(1) In Nova Scotia, health zones are aggregations
of the nine district health authorities.
(2) Public health units (PHU) administer health
promotion and disease prevention programs. District health councils
(DHC) are advisory, health planning organizations that make recommendations
on resource distribution and provide advice on integration of health
services in their community.
Health region peer groups
In order to effectively compare health regions with similar socio-economic
characteristics, health regions have been grouped into ‘peer groups’.
Statistics Canada used a statistical method to achieve maximum statistical
differentiation between health regions. Twenty-four variables were chosen
to cover as many of the social and economic determinants of health as
possible,
using data collected at the health region level mostly from the Census
of Canada. Concepts covered include:
- basic demographics (i.e., population change and demographic structure),
- living conditions (i.e., socio-economic characteristics, housing,
and income inequality), and
- working conditions (i.e., labour market conditions)
A more detailed discussion on the rationale and methods involved in
the development of peer groups is available in the Health
Region (2000) Peer Groups Working Paper (PDF).
Peer groups based on the latest health region boundaries and 2001 Census
data are now available. There are currently nine peer groups identified
by letters A through I.
List of health regions by peer group (PDF)
Map of latest peer groups (PDF)
The following summary table provides an overview of the principle variables
used to establish the groups.
| Peer Group |
Number of Health Regions |
% Canadian Population |
Principal characteristics |
| A |
24 |
25.3% |
Urban-rural mix from coast to coast
Average percentage of Aboriginal population
Low male population
Slow population growth from
1996-2001 |
| B |
14 |
26.5% |
Mainly urban centres with moderately high population density
Low percentage of government transfer income
Rapid population growth from 1996 to 2001 |
| C |
23 |
11.4% |
Sparsely populated urban-rural mix
from coast to coast
Average percentage of Aboriginal population
Negative population growth |
| D |
10 |
1.7% |
Rural regions mainly in the central Prairies
Moderate Aboriginal population
Moderately high percentage of government transfer income
Almost equal numbers of men and women
Negative population growth |
| E |
25 |
13.4% |
Mainly rural regions in Quebec, Ontario and the Prairies
High proportion of people recently moved to or within these
regions since 1996
Average percentage of Aboriginal population
Moderate population growth |
| F |
5 |
0.4% |
Northern and remote regions
Very high Aboriginal population
Moderately high percentage of government transfer income
Slightly higher male population
Moderate population growth |
| G |
3 |
16.2% |
Largest metro centres with an average population density
of 3,934 people per square kilometre
Low Aboriginal population
Moderate percentage of government transfer income
High female population |
| H |
13 |
2.7% |
Rural northern regions
High Aboriginal population
High male population
Negative population growth |
| I |
10 |
2.4% |
Mainly rural Eastern regions
Very high percentage of government transfer income
Negative population growth
Low percentage of people having moved to or within these regions
since 1996 |
 |
Recent changes in health region boundaries and names
There have been a number of changes affecting the health region geography
in recent years. To ensure comparability across data tables in Health
Indicators, the boundaries established in 2000 were set as a fixed reference
for the first three years of the project. The health region geography
and data coding tools have recently been revised to reflect the most
current boundaries. The following table provides a summary of the changes
since 2000. For more detailed information about health regions and health
region changes, see Health regions: boundaries and correspondence
with census geography,
Cat. no 82-402-XIE.
Summary of changes to health regions, 2000 and 2003
| Prov |
Health regions 2000 |
Units |
Health Regions 2003 |
Units |
Comments |
| 10 NL |
Community Health Regions |
6 |
Community Health Regions |
6 |
- no change |
| 11 PE |
Urban and rural regions |
2 |
Health Regions |
4 |
- now recognizing the four administrative areas |
| 12 NS |
Zones |
6 |
Zones |
6 |
- no change |
| 13 NB |
Health Regions |
7 |
Health Regions |
7 |
- no change |
| 24 QC |
Régions sociosanitaires |
18 |
Régions sociosanitaires |
18 |
- changes caused by municipal adjustments affecting regional limits
only |
| 35 ON |
Public health units (PHUs) |
37 |
PHUs |
37 |
- some name changes only |
| |
District health councils |
16 |
DHCs |
16 |
- some name changes only |
| 46 MB |
Health Regions |
12 |
Regional Health Authorities |
11 |
- RHAs Marquette and South Westman to be combined into one (Assiniboine),
plus other minor boundary changes |
| 47 SK |
Service Areas |
11 |
Regional Health Authorities |
13 |
- new RHAs are similar to many service area boundaries – exceptions
in 4711 which is now split into three regions. |
| 48 AB |
Health Authorities |
17 |
Regional Health Authorities |
9 |
- total boundary revision – effective on April 1, 2003
- new Alberta health region names final as of July 2003 |
| 59 BC |
Health Regions |
20 |
Health Service Delivery Areas (HSDA) |
16 |
- total boundary revision - new BC regions became final in June
2002
- in June 2003, the BC Ministry of Health approved
subsequent boundary changes within Vancouver Island Health Authority
affecting three
HSDAs |
| 60 YT |
Territory |
1 |
Territory |
1 |
- no change |
| 61 NT |
Territory |
1 |
Territory |
1 |
- no change |
| 62 NU |
Territory |
1 |
Territory |
1 |
- no change |
You need to use the free Adobe Reader to view PDF documents. To view (open) these files, simply click on the link. To download (save) them, right-click on the link. Note that if you are using Internet Explorer or AOL, PDF documents sometimes do not open properly. See Troubleshooting PDFs. PDF documents may not be accessible by some devices. For more information, visit the Adobe website or contact us for assistance.
|


