
Health Reports
Prevalence of prescription and non-prescription polypharmacy by frailty and sex among middle-aged and older Canadians

by Daniel A. Harris, Yanling Guo, Nardine Nakhla, Mina Tadrous, David B. Hogan, Deirdre Hennessy, Kellie Langlois, Rochelle Garner, Sarah Leslie, Susan E. Bronskill, George Heckman and Colleen J. Maxwell
DOI: https://www.doi.org/10.25318/82-003-x202200600001-eng
Abstract
Background
Estimates of polypharmacy have primarily been derived from prescription claims, and less is known about the use of non-prescription medications (alone or in combination with prescription medications) across the frailty spectrum or by sex. Our objectives were to estimate the prevalence of polypharmacy (total, prescription, non-prescription, and concurrent prescription and non-prescription) overall, and by frailty, sex and broad age group.
Data
Canadian Health Measures Survey, Cycle 5, 2016 to 2017.
Methods
Among Canadians aged 40 to 79 years, all prescription and non-prescription medications used in the month prior to the survey were documented. Polypharmacy was defined as using five or more medications total (prescription and non-prescription), prescription only and non-prescription only. Concurrent prescription and non-prescription use was defined as two or more and three or more of each. Frailty was defined using a 31-item frailty index (FI) and categorized as non-frail (FI ≤ 0.1) and pre-frail or frail (FI > 0.1). Survey-weighted descriptive statistics were calculated overall and age standardized
Results
We analyzed 2,039 respondents, representing 16,638,026 Canadians (mean age of 56.9 years; 51% women). Overall, 52.4% (95% confidence interval [CI] = 47.3 to 57.4) were defined as pre-frail or frail. Age-standardized estimates of total polypharmacy, prescription polypharmacy and concurrent prescription and non-prescription medication use were significantly higher among pre-frail or frail versus non-frail adults (e.g., total polypharmacy: 64.1% versus 31.8%, respectively). Polypharmacy with non-prescription medications was common overall (20.5% [95% CI = 16.1 to 25.8]) and greater among women, but did not differ significantly by frailty.
Interpretation
Polypharmacy and concurrent prescription and non-prescription medication use were common among Canadian adults, especially those who were pre-frail or frail. Our findings highlight the importance of considering non-prescribed medications when measuring the exposure to medications and the potential risk for adverse outcomes.
Keywords
frailty; prescription medications; over-the-counter medications; natural health products; middle-aged adults; older adults; Canadian Health Measures Survey; Canada.
Authors
Daniel A. Harris is with the Dalla Lana School of Public Health, University of Toronto and ICES. Yanling Guo and Sarah Leslie are with the School of Public Health Sciences, University of Waterloo. Nardine Nakhla is with the School of Pharmacy, University of Waterloo. Mina Tadrous is with ICES; the Women’s College Hospital Institute for Health System Solutions and Virtual Care; and the Leslie Dan Faculty of Pharmacy, University of Toronto. David B. Hogan is with the Department of Community Health Sciences and the Department of Medicine, Cumming School of Medicine, University of Calgary. Deirdre Hennessy is with the Department of Community Health Sciences, Cumming School of Medicine, University of Calgary, and the Health Analysis Division at Statistics Canada. Kellie Langlois and Rochelle Garner are with the Health Analysis Division at Statistics Canada. Susan E. Bronskill is with ICES; the Sunnybrook Research Institute; the Sunnybrook Health Sciences Centre; and the Institute of Health Policy, Management and Evaluation, Dalla Lana School of Public Health, University of Toronto. George Heckman is with the School of Public Health Sciences, University of Waterloo, and the Research Institute for Aging. Colleen J. Maxwell (colleen.maxwell@uwaterloo.ca) is with ICES; the School of Pharmacy, University of Waterloo; and the Department of Community Health Sciences, Cumming School of Medicine, University of Calgary.
What is already known on this subject?
- Frailty is a health state defined as an increased vulnerability to stressors and poor health outcomes, often resulting from physiological changes associated with the accumulation of chronic disease and aging.
- Polypharmacy (i.e., the concurrent use of five or more medications) is common among people who are frail, but prior studies have largely measured exposure to prescription medications, thus failing to consider non-prescription medication use (e.g., over-the-counter medications and health supplements).
What does this study add?
- Polypharmacy was common among Canadian adults, with 21% using five or more prescription medications, 21% using five or more non-prescription medications, and 16% using at least three prescription and three non-prescription medications concurrently.
- The prevalence of prescription polypharmacy and concurrent prescription and non-prescription medication use was significantly higher for pre-frail or frail versus non-frail adults, yet little is known about the safety profile of these combinations in the context of frailty.
- Irrespective of their frailty status, women had greater non-prescription and concurrent prescription and non-prescription medication use compared with men.
Introduction
Polypharmacy, commonly defined as the concurrent use of five or more medications, has increased substantially in several countries over the past two decadesNote 1Note 2Note 3Note 4Note 5Note 6Note 7Note 8 with prevalence estimates ranging between 32% and 66% among those aged 65 years and older.Note 8Note 9Note 10Note 11Note 12 Although more common among older adults and typically among women,Note 1Note 2Note 3Note 4Note 5Note 6Note 8 notable increases in polypharmacy have also been observed in men and younger adults aged 20 to 65.Note 2Note 3Note 6Note 8 While receiving multiple medications can be appropriate, exposure to higher numbers of medications is associated with an increased risk of drug interactions, poor medication adherence, adverse medication effects, and high health service use and cost.Note 13Note 14Note 15Note 16Note 17 Several studies have estimated the prevalence of polypharmacy using prescription claims or data sources;Note 1Note 2Note 3Note 4Note 6Note 8 however, these fail to capture exposure to non-prescribed medications, such as over-the-counter (OTC) medications and natural health products.
Among adults living in the United States in 2011, Qato and colleagues found that 72% of prescription medication users reported using a non-prescribed medication.Note 18 Qato et al. also noted an increase in dietary supplement use (e.g., multivitamins and omega-3 fish oil) from 52% to 64% among adults aged 57 to 85 years between 2005 and 2011.Note 18 Given the accessibility of OTC medications and dietary supplements, consumers may underestimate their potential risks and feel no need to disclose their use to health care providers, despite the possibility of adverse effects, including clinically relevant drug-drug interactions.Note 19Note 20Note 21Note 22 OTC medication use and supplement use have been shown to differ across sociodemographic characteristics and with chronic disease burden.Note 19Note 23Note 24 Less is known about the prevalence or types of non-prescription medications used (alone or in combination with prescription medications) across other measures of health status, such as frailty.
Frailty, multimorbidity and polypharmacy frequently coincide.Note 16 A recent systematic review and meta-analysis reported polypharmacy estimates of 47% among pre-frail individuals and 59% among frail individuals.Note 25 Exhibiting a complex and bidirectional relationship with polypharmacy,Note 16Note 25 frailty is associated with increased risks of adverse medication effects and prescribing cascades,Note 16Note 26 while polypharmacy has also been associated with an increased risk of frailty.Note 27Note 28Note 29 Studies investigating the use of and variation in both prescribed and non-prescribed medications among people with varying frailty levels are needed to provide a more comprehensive estimate of total medication use in this population and to set a foundation to further our understanding of the potential benefits and risks of polypharmacy.
To date, few studies have considered both prescription and non-prescription medications when examining polypharmacy and frailty.Note 27Note 29Note 30 Existing research has been limited to specific subgroups (e.g., only men,Note 27 home care clientsNote 30) and has generally not explored differences between middle-aged and older adults.Note 27Note 29Note 30 This research is important because frailty and pre-frailty in middle-aged individuals are not unusual,Note 31Note 32 and recent age-related shifts in multimorbidity will likely result in higher frailty levels at younger ages;Note 12Note 33Note 34Note 35 therefore, there is a need for research to explore potential differences in polypharmacy and frailty across younger and older age groups. Furthermore, there is a lack of population-based prevalence estimates of non-prescription and concurrent prescription and non-prescription medication use by frailty status and sex in Canada. To address these research gaps, we used a nationally representative sample of middle-aged and older Canadians to estimate the prevalence of polypharmacy (total, prescription, non-prescription and concurrent prescription and non-prescription) overall, and by frailty status, sex and broad age group.
Methods
Study design, data and sample
We conducted a cross-sectional study of prescription and non-prescription (i.e., OTC and health products) medication use by frailty status and sex among adults aged 40 to 79 years participating in Cycle 5 (2016 to 2017) of the Canadian Health Measures Survey (CHMS).
The CHMS is an ongoing cross-sectional national health survey that has been conducted by Statistics Canada every two years since 2007. Data relevant to the health of Canadians are collected through a voluntary in-person computer-assisted household interview and direct physical measures at a mobile examination centre or clinic.Note 36Note 37 CHMS data are representative of Canadians aged 3 to 79 years living in the 10 provinces, excluding full-time members of the Canadian Armed Forces, as well as people living in the three territories, on First Nations reserves, in institutions (e.g., long-term care homes) and in selected remote regions. These exclusions represented approximately 3% of the target population for Cycle 5. In this study, analyses were limited to those aged 40 to 79 years.
Conducted between January 2016 and December 2017, Cycle 5 employed a complex, stratified three-stage sampling design with data collected in 16 geographical sites from five regions across Canada (the Atlantic provinces, Quebec, Ontario, the Prairies and British Columbia).Note 38Note 39 Response rates were 74.5% and 89.8% at the household and respondent levels, respectively. The clinic response rate was 72.8% (though all respondents in our analytical sample responded to both the household and clinic interviews), and the combined response rate at a national level was 48.5%. For further details regarding CHMS sampling design and methods, please see the Cycle 5 CHMS data user guide.Note 40
The Social Sciences and Humanities Research Council granted ethics approval for this research, and Statistics Canada provided access to the restricted master data file for Cycle 5 of the CHMS (2016 to 2017) within the South Western Ontario Research Data Centre (SWORDC), located at the University of Waterloo.
Measures
Medication use
Information was collected for up to 45 medications per respondent, including prescription and non-prescription medications (i.e., OTC and health products), taken or used in the past month. Medications prescribed but not taken or used in the past month (e.g., epinephrine injection) were not captured. Respondents were asked about their use of any prescription medication (i.e., “medications that have been prescribed or administered by a health professional such as a doctor or dentist”). Examples given included insulin, antibiotics, nicotine patches and birth control pills. They were also asked about OTC medications or other health products, including natural health products, and were given the following description: “Over-the-counter medications could include such things as pain killers, antacids, allergy pills and hydrocortisone creams. Examples of health products include vitamins, minerals, amino acids, probiotics, fish oils and other oils, herbal remedies and homeopathic preparations.” Interviewers asked respondents to show all medication bottles and containers. Relevant product information was collected and confirmed using look-up databases to facilitate product identification (e.g., using the Drug Identification Number). The medication files combined OTC medications and health products together under “non-prescription medications,” so they are not differentiated in the current study.
We defined polypharmacy as the use of five or more medications for total medications (i.e., prescription and non-prescription medications), prescription medications only and non-prescription medications only. Two measures of concurrent medication use were also examined: the use of two or more prescribed and two or more non-prescribed medications concurrently (i.e., four or more medications) and the use of three or more prescribed andthree or more non-prescribed medications concurrently (i.e., six or more medications).
Medications were classified using the second level (pharmacological or therapeutic subgroup) of the Anatomical Therapeutic Chemical (ATC) Classification System.Note 41 Approximately 6.8% of all prescription products and 17.2% of all non-prescription products could not be classified because of missing ATC codes and drug names. These products were excluded from our analyses of medication type.
Frailty
A 31-item frailty index (FI) was derived from measures included in the household and clinic CHMS files (see Appendix Table 1).Note 42 This was a modified version of a FI previously developed and validated using comparable Statistics Canada survey data.Note 43 The FI is calculated as the proportion of potential health deficits considered (denominator) that the respondent has (numerator). Deficits included measures of health, physical activity, muscle strength, sensory and functional status, and cognitive and psychosocial characteristics. The FI was examined as both a continuous and a categorical variable, with the latter collapsed into two groups: non-frail (FI values ≤ 0.1) and pre-frail or frail (FI values > 0.1). Frailty was categorized into a binary measure because of some small sample sizes evident across sex, age group and frailty strata.
| Column % (unless otherwise specified) | |||||||||||||||
|---|---|---|---|---|---|---|---|---|---|---|---|---|---|---|---|
| Overall (n = 2,039)Table 1 Note † | Frailty status | Sex | |||||||||||||
| Estimate | 95% confidence interval |
Non-frail [FI ≤ 0.1] | Pre-frail and frail [FI > 0.1] | Women | Men | ||||||||||
| Estimate | 95% confidence interval |
Estimate | 95% confidence interval |
Estimate | 95% confidence interval |
Estimate | 95% confidence interval |
||||||||
| Lower | Upper | Lower | Upper | Lower | Upper | Lower | Upper | Lower | Upper | ||||||
| Overall prevalence | Note ...: not applicable | Note ...: not applicable | Note ...: not applicable | 47.6 | 42.6 | 52.7 | 52.4 | 47.3 | 57.4 | 50.8 | 50.8 | 50.8 | 49.2 | 49.2 | 49.2 |
| Mean age, years | 56.90 | 56.50 | 57.30 | 53.40 | 52.70 | 54.20 | 60.10 | 59.20 | 61.00 | 56.80 | 56.30 | 57.30 | 57.00 | 56.30 | 57.70 |
| Age group, yearsTable 1 Note ‡ | |||||||||||||||
| 40 to 49 | 28.6 | 25.7 | 31.6 | 40.9 | 35.0 | 47.0 | 17.4 | 13.2 | 22.6 | 29.8 | 25.1 | 35.0 | 27.2 | 22.9 | 32.1 |
| 50 to 59 | 30.9 | 28.1 | 33.9 | 33.6 | 27.3 | 40.6 | 28.5 | 22.8 | 35.1 | 29.0 | 24.3 | 34.2 | 33.0 | 28.5 | 37.8 |
| 60 to 69 | 27.8 | 26.4 | 29.3 | 19.6 | 16.0 | 23.9 | 35.2 | 32.4 | 38.1 | 28.5 | 26.2 | 30.9 | 27.1 | 25.1 | 29.2 |
| 70 to 79 | 12.7 | 11.3 | 14.2 | 5.9Note E: Use with caution | 3.7 | 9.2 | 18.9 | 15.8 | 22.4 | 12.7 | 10.5 | 15.2 | 12.7 | 10.8 | 14.9 |
| SexTable 1 Note ‡ | |||||||||||||||
| Women | 50.8 | 50.8 | 50.8 | 45.2 | 40.9 | 49.5 | 55.9 | 52.3 | 59.4 | Note ...: not applicable | Note ...: not applicable | Note ...: not applicable | Note ...: not applicable | Note ...: not applicable | Note ...: not applicable |
| Men | 49.2 | 49.2 | 49.2 | 54.8 | 50.5 | 59.1 | 44.1 | 40.6 | 47.7 | Note ...: not applicable | Note ...: not applicable | Note ...: not applicable | Note ...: not applicable | Note ...: not applicable | Note ...: not applicable |
| Marital statusTable 1 Note ‡ Table 1 Note § | |||||||||||||||
| Married or living with common-law partner | 72.8 | 69.1 | 76.3 | 76.4 | 71.4 | 80.8 | 69.6 | 62.5 | 75.9 | 69.0 | 63.8 | 73.7 | 76.8 | 69.9 | 82.5 |
| Widowed | 3.6 | 2.7 | 4.8 | 1.7Note E: Use with caution | 1.1 | 2.7 | 5.3 | 3.7 | 7.6 | 4.9Note E: Use with caution | 3.2 | 7.4 | 2.3Note E: Use with caution | 1.5 | 3.3 |
| Separated, divorced or never married | 23.6 | 20.5 | 27.0 | 21.9 | 17.4 | 27.1 | 25.1 | 19.7 | 31.5 | 26.1 | 22.1 | 30.6 | 20.9 | 15.8 | 27.2 |
| Ethnicity | |||||||||||||||
| White | 76.8 | 63.6 | 86.2 | 75.1 | 58.0 | 86.9 | 78.2 | 67.7 | 86.1 | 78.8 | 65.4 | 88.0 | 74.6 | 60.1 | 85.2 |
| Non-white | 23.2Note E: Use with caution | 13.8 | 36.4 | 24.9Note E: Use with caution | 13.1 | 42.0 | 21.8Note E: Use with caution | 13.9 | 32.3 | 21.2Note E: Use with caution | 12.0 | 34.6 | 25.4Note E: Use with caution | 14.8 | 39.9 |
| Education levelTable 1 Note ‡ | |||||||||||||||
| Less than secondary school | 10.4 | 7.6 | 14.1 | 6.4Note E: Use with caution | 4.2 | 9.5 | 14.1Note E: Use with caution | 9.5 | 20.6 | 8.2Note E: Use with caution | 5.0 | 13.3 | 12.7 | 9.6 | 16.7 |
| Secondary school graduate | 22.2 | 18.1 | 27.0 | 19.5Note E: Use with caution | 12.6 | 28.9 | 24.7 | 20.7 | 29.3 | 22.4 | 17.7 | 27.9 | 22.1 | 16.3 | 29.2 |
| Postsecondary degree | 67.3 | 61.6 | 72.6 | 74.2 | 65.3 | 81.4 | 61.1 | 55.1 | 66.8 | 69.4 | 63.5 | 74.7 | 65.2 | 57.1 | 72.5 |
| Household income | |||||||||||||||
| Mean | 108,525 | 99,802 | 117,248 | 119,124 | 107,296 | 130,951 | 98,898 | 87,873 | 109,923 | 107,054 | 98,882 | 115,226 | 110,042 | 97,878 | 122,206 |
| Median (25th and 75th percentile) | 98,169 | 54,173 | 140,690 | 109,033 | 68,072 | 146,135 | 85,461 | 42,006 | 131,079 | 89,803 | 46,334 | 145,651 | 102,480 | 65,474 | 134,927 |
| Lowest tertileTable 1 Note ‡ Table 1 Note § | 25.6 | 20.9 | 31.1 | 19.1 | 14.7 | 24.4 | 31.6 | 25.5 | 38.4 | 30.4 | 24.3 | 37.1 | 20.7 | 15.8 | 26.8 |
| Middle tertile | 33.0 | 28.9 | 37.5 | 32.9 | 26.7 | 39.8 | 33.2 | 29.2 | 37.4 | 30.3 | 24.9 | 36.3 | 35.9 | 30.5 | 41.7 |
| Highest tertile | 41.3 | 36.2 | 46.6 | 48.0 | 41.3 | 54.8 | 35.3 | 29.2 | 41.9 | 39.4 | 33.7 | 45.3 | 43.4 | 34.9 | 52.3 |
| Number of chronic conditionsTable 1 Note †† | |||||||||||||||
| Mean | 1.38 | 1.23 | 1.53 | 0.50 | 0.40 | 0.59 | 2.18 | 2.04 | 2.33 | 1.52 | 1.28 | 1.76 | 1.24 | 1.10 | 1.37 |
| Median (25th and 75th percentile) | 0.62 | 0.00 | 1.75 | 0.00 | 0.00 | 0.47 | 1.58 | 0.69 | 2.52 | 0.82 | 0.00 | 1.90 | 0.41 | 0.00 | 1.56 |
| 0Table 1 Note ‡ Table 1 Note § | 34.0 | 30.0 | 38.2 | 61.2 | 54.7 | 67.3 | 9.3 | 6.5 | 13.0 | 28.4 | 22.6 | 34.9 | 39.8 | 35.4 | 44.3 |
| 1 | 25.8 | 22.5 | 29.4 | 29.2 | 24.5 | 34.3 | 22.8 | 17.6 | 28.9 | 26.4 | 21.7 | 31.7 | 25.2 | 20.9 | 30.0 |
| 2 to 3 | 32.8 | 28.8 | 37.0 | Note x: suppressed to meet the confidentiality requirements of the Statistics Act | Note ...: not applicable | Note ...: not applicable | 53.8 | 48.0 | 59.6 | 36.9 | 30.3 | 44.1 | 28.5 | 24.4 | 33.0 |
| 4 or more | 7.4 | 5.5 | 10.0 | Note F: too unreliable to be published | Note ...: not applicable | Note ...: not applicable | 14.1 | 11.1 | 17.8 | 8.4 | 5.9 | 11.8 | 6.5Note E: Use with caution | 4.5 | 9.3 |
| Most prevalent chronic conditionsTable 1 Note †† | |||||||||||||||
| HypertensionTable 1 Note ‡ | 28.2 | 24.4 | 32.4 | 9.8 | 7.3 | 13.0 | 44.9 | 39.1 | 50.9 | 26.8 | 21.5 | 32.8 | 29.7 | 24.3 | 35.7 |
| ArthritisTable 1 Note ‡ Table 1 Note § | 28.2 | 24.5 | 32.2 | 7.6Note E: Use with caution | 4.9 | 11.7 | 46.9 | 42.0 | 51.8 | 32.9 | 26.2 | 40.2 | 23.4 | 18.7 | 28.7 |
| DiabetesTable 1 Note ‡ Table 1 Note § | 11.6 | 9.9 | 13.5 | 3.5Note E: Use with caution | 2.1 | 5.9 | 18.9 | 14.9 | 23.7 | 7.8 | 5.9 | 10.3 | 15.4 | 12.3 | 19.1 |
| CancerTable 1 Note ‡ | 10.6 | 8.7 | 12.7 | 4.1Note E: Use with caution | 2.7 | 6.3 | 16.4 | 13.3 | 20.2 | 10.9 | 8.3 | 14.2 | 10.2 | 7.2 | 14.3 |
|
... not applicable x suppressed to meet the confidentiality requirements of the Statistics Act E use with caution F too unreliable to be published
Source: Statistics Canada, Canadian Health Measures Survey, Cycle 5, 2016 to 2017. |
|||||||||||||||
Covariates
Other characteristics included the respondents’ self-reported sex, age (40 to 49 years, 50 to 59 years, 60 to 69 years, 70 to 79 years; for analyses by broad age group: 40 to 59 years, 60 to 79 years), marital status, racial and cultural group, education level, household income, and the presence and number of common chronic conditions. Marital status was categorized as married or living with a common-law partner; widowed; and separated, divorced or never married. Highest education level was categorized as less than secondary school, secondary school graduate, and postsecondary certificate or degree. Racial and cultural group was categorized as white and non-white. Questions on personal and household income were not asked in Cycle 5; however, respondents were asked permission to use administrative files to obtain their household income. In cases where personal income was not obtained for some household members (e.g., because a person did not consent or could not be found or linked), it was imputed (resulting in no missing values for household income).Note 40 Respondents were asked about whether they had any of 20 separate chronic conditions, defined as long-term conditions expected to last or that had already lasted six months or more and that had been diagnosed by a health professional. Partial non-response was infrequent in Cycle 5. Covariate response values of “don’t know,” “refusal” or “not stated” were defined as missing.
Analyses
Descriptive analyses examined the distribution of respondents’ sociodemographic, health and medication measures overall and by frailty, sex and broad age group. Categorical variables were summarized using weighted proportions with 95% confidence intervals (CIs). Continuous variables were summarized using weighted means and medians, with 95% CIs and interquartile ranges (IQRs), respectively. Age-standardized prevalence estimates (using the 2016 Census as the standard population) for medication use, overall and by sex, were derived to permit a comparison by frailty status while accounting for differences in age distribution between frailty groups.
All analyses used survey procedures to account for the complex survey design. Survey weights were used to account for the probability of selection at each stage and adjust for non-response. Bootstrap weights were used to produce estimates representative of the Canadian population and to approximate the sample variance. All procedure statements included degrees of freedom = 11 to account for the limited degrees of freedom in the CHMS. Statistical significance was defined as α = 0.05 or less (two-tailed). Comparisons of 95% CIs (and degree of overlap) also informed the interpretation of statistical and meaningful differences in estimates across strata. Estimates with a coefficient of variation (CV) of 16.6% to 33.3% are noted with an E (use with caution) and those with a CV of over 33.3% are noted with an F (too unreliable to be published, if the cell size is smaller than five records) or reported as being less than the upper limit of the 95% CI (if the cell size is greater than or equal to five records). Analyses were conducted using the CHMS (Cycle 5) master files within the secure environment of the SWORDC, University of Waterloo, and using SAS version 9.4 (SAS Institute Inc., Cary, North Carolina).
Results
Our final sample included 2,039 respondents aged 40 to 79 years (mean age = 56.9 [95% CI = 56.5 to 57.3]; 51% women), representing 16,638,026 Canadians within this age range. Among them, 47.6% (95% CI = 42.6 to 52.7) were classified as non-frail and 52.4% (95% CI = 47.3 to 57.4) were classified as pre-frail or frail (Table 1). Although pre-frail and frail respondents were more likely to be older than those classified as non-frail, nearly half were aged 40 to 59 years. Pre-frail and frail respondents were also more likely to be women, to not be married or living with a partner, to have lower education and household income levels, and to have higher multimorbidity relative to non-frail respondents. Among the chronic conditions examined, the most prevalent conditions were hypertension (28.2%), arthritis (28.2%), diabetes (11.6%) and cancer (10.6%). Prevalence estimates for all of these conditions were significantly higher among pre-frail and frail respondents than non-frail respondents. Table 1 also provides the distribution of respondents’ characteristics stratified by sex.
Prevalence of polypharmacy by frailty and sex
In the overall sample, respondents used a median of 3.95 medications (IQR = 1.72 to 7.17), and 49.6% (95% CI = 43.4 to 55.7) had total polypharmacy (i.e., considering both prescription and non-prescription products) (Table 2). When restricted to prescription medications, the median number of medications used was 1.00 (IQR = 0.00 to 3.36), with 20.5% (95% CI = 17.3 to 24.2) of respondents meeting criteria for polypharmacy. For non-prescription medications, the median was 1.52 (IQR = 0.38 to 3.49), and 20.5% (95% CI = 16.1 to 25.8) of respondents had polypharmacy. An estimated 30.9% (95% CI = 27.1 to 34.9) of respondents concurrently used two or more each of prescription and non-prescription medications, and 15.8% (95% CI = 12.8 to 19.4) used three or more each.
| Column % (unless otherwise specified) | |||||||||||||||
|---|---|---|---|---|---|---|---|---|---|---|---|---|---|---|---|
| Overall (n = 2,039)Table 2 Note † | Frailty status | Sex | |||||||||||||
| Estimate | 95% confidence interval |
Non-frail [FI ≤ 0.1] | Pre-frail and frail [FI > 0.1] | Women | Men | ||||||||||
| Estimate | 95% confidence interval |
Estimate | 95% confidence interval |
Estimate | 95% confidence interval |
Estimate | 95% confidence interval |
||||||||
| Lower | Upper | Lower | Upper | Lower | Upper | Lower | Upper | Lower | Upper | ||||||
| Overall prevalence | Note ...: not applicable | Note ...: not applicable | Note ...: not applicable | 47.6 | 42.6 | 52.7 | 52.4 | 47.3 | 57.4 | 50.8 | 50.8 | 50.8 | 49.2 | 49.2 | 49.2 |
| Total medications | |||||||||||||||
| Mean | 5.24 | 4.68 | 5.79 | 3.42 | 2.94 | 3.90 | 6.89 | 6.28 | 7.49 | 5.82 | 5.16 | 6.47 | 4.64 | 4.10 | 5.18 |
| Median (25th and 75th percentile) | 3.95 | 1.72 | 7.17 | 2.26 | 0.91 | 4.42 | 5.82 | 3.07 | 8.94 | 4.74 | 2.24 | 7.99 | 2.92 | 1.32 | 6.13 |
| 0 | 6.5Note E: Use with caution | 4.4 | 9.5 | 10.1Note E: Use with caution | 6.6 | 15.3 | <7.3Table 2 Note †† | Note ...: not applicable | Note ...: not applicable | <8.9Table 2 Note †† | Note ...: not applicable | Note ...: not applicable | 8.8 | 6.6 | 11.6 |
| 1 to 4Table 2 Note ‡ Table 2 Note § | 43.9 | 39.0 | 49.0 | 60.9 | 56.3 | 65.4 | 28.5 | 22.9 | 34.9 | 38.1 | 32.2 | 44.3 | 50.0 | 44.0 | 56.0 |
| 5 or moreTable 2 Note ‡ Table 2 Note § | 49.6 | 43.4 | 55.7 | 29.0 | 23.1 | 35.6 | 68.3 | 61.0 | 74.8 | 57.7 | 49.9 | 65.1 | 41.2 | 35.4 | 47.3 |
| Prescription medications | |||||||||||||||
| Mean | 2.50 | 2.16 | 2.85 | 1.01 | 0.79 | 1.22 | 3.86 | 3.46 | 4.26 | 2.56 | 2.15 | 2.97 | 2.45 | 2.08 | 2.82 |
| Median (25th and 75th percentile) | 1.00 | 0.00 | 3.36 | 0.00 | 0.00 | 1.06 | 2.72 | 0.75 | 5.07 | 1.20 | 0.00 | 3.54 | 0.82 | 0.00 | 3.05 |
| 0Table 2 Note ‡ Table 2 Note § | 33.1 | 28.0 | 38.6 | 52.2 | 44.9 | 59.5 | 15.7 | 11.9 | 20.5 | 29.2 | 22.6 | 36.8 | 37.2 | 31.7 | 43.0 |
| 1 to 4 | 46.4 | 43.8 | 49.0 | 44.2 | 38.2 | 50.4 | 48.4 | 45.2 | 51.6 | 49.8 | 44.2 | 55.4 | 42.9 | 38.7 | 47.1 |
| 5 or moreTable 2 Note ‡ | 20.5 | 17.3 | 24.2 | 3.5Note E: Use with caution | 1.8 | 6.8 | 35.9 | 31.3 | 40.8 | 21.0 | 17.6 | 24.9 | 20.0 | 15.5 | 25.4 |
| Non-prescription medications | |||||||||||||||
| Mean | 2.74 | 2.42 | 3.05 | 2.42 | 1.98 | 2.86 | 3.02 | 2.67 | 3.37 | 3.26 | 2.87 | 3.64 | 2.20 | 1.87 | 2.53 |
| Median (25th and 75th percentile) | 1.52 | 0.38 | 3.49 | 1.31 | 0.30 | 3.08 | 1.72 | 0.48 | 3.83 | 2.06 | 0.69 | 4.26 | 1.04 | 0.16 | 2.53 |
| 0Table 2 Note § | 15.6 | 12.5 | 19.3 | 17.0 | 12.1 | 23.3 | 14.4 | 11.2 | 18.3 | 11.2Note E: Use with caution | 7.4 | 16.6 | 20.2 | 17.0 | 24.0 |
| 1 to 4 | 63.8 | 60.6 | 66.9 | 65.7 | 60.4 | 70.6 | 62.2 | 58.4 | 65.8 | 61.7 | 57.7 | 65.5 | 66.1 | 60.5 | 71.2 |
| 5 or moreTable 2 Note § | 20.5 | 16.1 | 25.8 | 17.3Note E: Use with caution | 11.5 | 25.4 | 23.4 | 18.6 | 28.9 | 27.1 | 20.9 | 34.4 | 13.7Note E: Use with caution | 9.2 | 19.9 |
| Concurrent prescription and non-prescription medications |
|||||||||||||||
| 2 or more of eachTable 2 Note ‡ Table 2 Note § | 30.9 | 27.1 | 34.9 | 16.1 | 12.3 | 20.9 | 44.2 | 39.7 | 48.9 | 37.8 | 30.9 | 45.1 | 23.7 | 20.0 | 27.9 |
| 3 or more of eachTable 2 Note ‡ Table 2 Note § | 15.8 | 12.8 | 19.4 | 6.0Note E: Use with caution | 3.8 | 9.4 | 24.8 | 20.4 | 29.7 | 20.6 | 15.9 | 26.2 | 10.9 | 7.9 | 15.1 |
|
... not applicable E use with caution
Source: Statistics Canada, Canadian Health Measures Survey, Cycle 5, 2016 to 2017. |
|||||||||||||||
The median total number of medications increased across frailty strata (non-frail: 2.26 [IQR = 0.91 to 4.42]; pre-frail and frail: 5.82 [IQR = 3.07 to 8.94]). The prevalence of total and prescription polypharmacy was significantly higher among pre-frail and frail respondents (total: 68.3% [95% CI = 61.0 to 74.8]; prescription: 35.9% [95% CI = 31.3 to 40.8]) compared with non-frail respondents (total: 29.0% [95% CI = 23.1 to 35.6]; prescription: 3.5% [95% CI = 1.8 to 6.8]E). Polypharmacy for non-prescription medications was higher among pre-frail and frail respondents (23.4% [95% CI = 18.6 to 28.9]) than non-frail respondents (17.3% [95% CI = 11.5 to 25.4]E), but not statistically different. Pre-frail and frail respondents were significantly more likely to be concurrent users of two or more (44.2% [95% CI = 39.7 to 48.9]) and three or more (24.8% [95% CI = 20.4 to 29.7]) prescription and non-prescription medications compared with non-frail respondents (two or more: 16.1% [95% CI = 12.3 to 20.9]; three or more: 6.0% [95% CI = 3.8 to 9.4]E). Table 2 also summarizes medication use by sex, illustrating that women had significantly higher estimates for total and non-prescription polypharmacy and for concurrent prescription and non-prescription use compared with men.
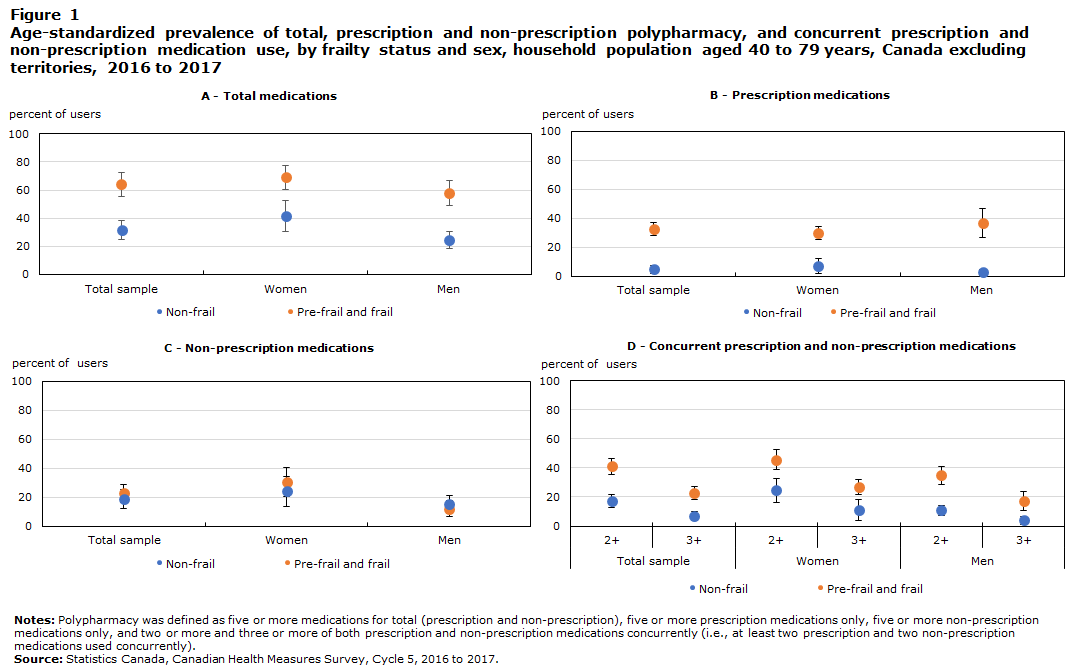
Figure 1 displays age-standardized prevalence estimates for total, prescription and non-prescription polypharmacy, and forconcurrent prescription and non-prescription use by frailty and sex (see also Appendix Table 2). Irrespective of frailty status, women were more likely to have polypharmacy with non-prescription medications than men (e.g., pre-frail or frail women: 30.4% [95% CI = 20.2 to 40.7]; pre-frail or frail men: 12.0% [95% CI = 6.7 to 17.3]). Although non-frail women tended to have greater polypharmacy with prescription medications compared with non-frail men (7.0% [95% CI = 2.0 to 12.0] versus 2.8% [95% CI = 0.7 to 4.9], respectively), pre-frail and frail men had slightly greater polypharmacy with prescription medications compared with pre-frail and frail women (36.7% [95% CI = 26.8 to 46.6] versus 29.8% [95% CI = 25.6 to 34.0], respectively). Women also showed a higher prevalence for concurrent prescription and non-prescription medication use compared with men, irrespective of frailty status.
Data table for Figure 1
| Non-frail | 95 percent Confidence interval | Pre-frail and frail |
95 percent Confidence interval | |||
|---|---|---|---|---|---|---|
| Lower | Upper | Lower | Upper | |||
| A - All medications (5 and over) | ||||||
| Total sample | 31.8 | 25 | 38.6 | 64.1 | 55.7 | 72.4 |
| Women | 41.4 | 30.5 | 52.3 | 69.0 | 60.6 | 77.5 |
| Men | 24.2 | 18.1 | 30.4 | 57.7 | 48.8 | 66.6 |
| B - Prescription medications only | ||||||
| Total sample | 4.6 | 1.9 | 7.3 | 32.7 | 28.1 | 37.2 |
| Women | 7.0 | 2.0 | 12.0 | 29.8 | 25.6 | 34.0 |
| Men | 2.8 | 0.7 | 4.9 | 36.7 | 26.8 | 46.6 |
| C - Non-prescription medications | ||||||
| Total sample | 18.8 | 12.2 | 25.4 | 22.6 | 16.1 | 29.0 |
| Women | 24.0 | 13.8 | 34.3 | 30.4 | 20.2 | 40.7 |
| Men | 15.0 | 8.9 | 21.1 | 12.0 | 6.7 | 17.3 |
| D - Concurrent prescription and non-prescription medications | ||||||
| Total sample | ||||||
| 2+ | 17.4 | 13 | 21.9 | 41 | 35.7 | 46.4 |
| 3+ | 7.0 | 3.9 | 10.0 | 22.7 | 18.2 | 27.2 |
| Women | ||||||
| 2+ | 24.7 | 16.4 | 33 | 45.7 | 38.7 | 52.8 |
| 3+ | 10.8 | 3.6 | 18.0 | 26.7 | 21.7 | 31.8 |
| Men | ||||||
| 2+ | 10.8 | 7.44 | 14.2 | 34.8 | 28.6 | 40.9 |
| 3+ | 4.0 | 1.3 | 6.7 | 17.4 | 10.9 | 23.8 |
|
Notes: Polypharmacy was defined as five or more medications for total (prescription and non-prescription), five or more prescription medications only, five or more non-prescription medications only, and two or more and three or more of both prescription and non-prescription medications concurrently (i.e., at least two prescription and two non-prescription medications used concurrently). Source: Statistics Canada, Canadian Health Measures Survey, Cycle 5, 2016 to 2017. |
||||||
Prevalence of polypharmacy by age group
Table 3 presents estimates of polypharmacy by frailty status for respondents aged 40 to 59 years versus those aged 60 to 79 years. Among younger respondents, 40.4% (95% CI = 33.0 to 48.3) were defined as pre-frail or frail, and among older respondents, 70.0% (95% CI = 65.9 to 73.8) were defined as pre-frail or frail. For both age groups, estimates of polypharmacy (with the exception of non-prescription medications) were significantly higher among those who were pre-frail or frail compared with those who were non-frail. Furthermore, for some measures (e.g., prescription polypharmacy), the prevalence among younger pre-frail and frail respondents was higher than among non-frail older adults. Generally, the prevalence of polypharmacy (again, with the exception of non-prescription medications) and concurrent prescription and non-prescription medication use was also significantly higher among older adults compared with younger adults, overall and across frailty strata.
| Column % (unless otherwise specified) | ||||||||||||||||||
|---|---|---|---|---|---|---|---|---|---|---|---|---|---|---|---|---|---|---|
| Age 40 to 59 years | Age 60 to 79 years | |||||||||||||||||
| Overall | Non-frail [FI ≤ 0.1] | Pre-frail and frail [FI > 0.1] | Overall | Non-frail [FI ≤ 0.1] | Pre-frail and frail [FI > 0.1] | |||||||||||||
| Estimate | 95% confidence interval |
Estimate | 95% confidence interval |
Estimate | 95% confidence interval |
Estimate | 95% confidence interval |
Estimate | 95% confidence interval |
Estimate | 95% confidence interval |
|||||||
| Lower | Upper | Lower | Upper | Lower | Upper | Lower | Upper | Lower | Upper | Lower | Upper | |||||||
| Overall prevalence | Note ...: not applicable | Note ...: not applicable | Note ...: not applicable | 59.6 | 51.7 | 67.0 | 40.4 | 33.0 | 48.3 | Note ...: not applicable | Note ...: not applicable | Note ...: not applicable | 30.0 | 26.2 | 34.1 | 70.0 | 65.9 | 73.8 |
| Total medications | ||||||||||||||||||
| Mean | 4.16 | 3.44 | 4.87 | 3.04 | 2.51 | 3.58 | 5.80 | 4.80 | 6.81 | 6.83 | 6.28 | 7.37 | 4.54 | 3.86 | 5.23 | 7.81 | 7.30 | 8.31 |
| Median (25th and 75th percentile) | 2.71 | 1.10 | 5.34 | 1.94 | 0.69 | 3.90 | 4.61 | 2.28 | 8.26 | 5.72 | 3.06 | 8.93 | 3.09 | 1.70 | 5.84 | 6.69 | 4.34 | 9.62 |
| 0 | 9.4Note E: Use with caution | 6.3 | 13.7 | 12.2Note E: Use with caution | 8.0 | 18.1 | <14.1Table 3 Note † | Note ...: not applicable | Note ...: not applicable | 2.3Note E: Use with caution | 1.1 | 4.6 | 4.0Note E: Use with caution | 2.0 | 7.8 | <4.4Table 3 Note † | Note ...: not applicable | Note ...: not applicable |
| 1 to 4Table 3 Note ‡ | 53.5 | 47.1 | 59.7 | 63.8 | 58.5 | 68.7 | 38.3 | 28.4 | 49.3 | 29.9 | 25.1 | 35.2 | 52.5 | 40.5 | 64.3 | 20.2 | 17.1 | 23.8 |
| 5 or moreTable 3 Note ‡ | 37.2 | 29.2 | 45.9 | 24.0 | 17.1 | 32.6 | 56.6 | 44.5 | 68.0 | 67.8 | 62.2 | 73.0 | 43.4 | 32.5 | 55.1 | 78.2 | 74.4 | 81.6 |
| Prescription medications | ||||||||||||||||||
| Mean | 1.71 | 1.28 | 2.13 | 0.81 | 0.54 | 1.09 | 3.02 | 2.31 | 3.73 | 3.68 | 3.39 | 3.97 | 1.57 | 1.30 | 1.84 | 4.58 | 4.32 | 4.84 |
| Median (25th and 75th percentile) | 0.28 | 0.00 | 1.91 | 0.00 | 0.00 | 0.75 | 1.71 | 0.02 | 4.34 | 2.45 | 0.66 | 4.68 | 0.74 | 0.00 | 1.95 | 3.46 | 1.55 | 5.69 |
| 0Table 3 Note ‡ | 44.7 | 36.2 | 53.5 | 58.2 | 48.0 | 67.7 | 24.7Note E: Use with caution | 15.4 | 37.1 | 16.1 | 12.7 | 20.3 | 34.7 | 26.5 | 44.0 | 8.2Note E: Use with caution | 5.4 | 12.1 |
| 1 to 4 | 42.7 | 36.6 | 49.2 | 39.2 | 30.8 | 48.3 | 48.0 | 39.6 | 56.5 | 51.8 | 46.8 | 56.7 | 59.0 | 49.4 | 67.9 | 48.7 | 43.4 | 54.0 |
| 5 or moreTable 3 Note § | 12.6 | 9.4 | 16.6 | <8.0Table 3 Note † | Note ...: not applicable | Note ...: not applicable | 27.3 | 19.8 | 36.4 | 32.1 | 27.9 | 36.6 | 6.3Note E: Use with caution | 3.4 | 11.3 | 43.2 | 38.9 | 47.6 |
| Non-prescription medications | ||||||||||||||||||
| Mean | 2.45 | 2.07 | 2.84 | 2.23 | 1.74 | 2.72 | 2.78 | 2.20 | 3.37 | 3.15 | 2.74 | 3.56 | 2.97 | 2.48 | 3.46 | 3.23 | 2.78 | 3.68 |
| Median (25th and 75th percentile) | 1.36 | 0.31 | 3.11 | 1.18 | 0.26 | 2.87 | 1.62 | 0.39 | 3.52 | 1.78 | 0.51 | 4.00 | 1.69 | 0.43 | 3.89 | 1.81 | 0.54 | 4.05 |
| 0 | 17.0 | 12.7 | 22.3 | 17.3Note E: Use with caution | 11.7 | 24.8 | 16.6Note E: Use with caution | 11.2 | 23.9 | 13.7 | 10.4 | 17.7 | 16.1 | 11.3 | 22.4 | 12.6 | 9.2 | 16.9 |
| 1 to 4 | 65.5 | 60.1 | 70.6 | 67.7 | 60.4 | 74.2 | 62.3 | 56.0 | 68.2 | 61.3 | 57.5 | 65.1 | 59.7 | 52.9 | 66.1 | 62.1 | 56.4 | 67.4 |
| 5 or more | 17.5Note E: Use with caution | 11.2 | 26.1 | 15.0Note E: Use with caution | 8.1 | 26.0 | 21.1Note E: Use with caution | 12.5 | 33.4 | 25.0 | 20.6 | 29.9 | 24.2 | 18.7 | 30.6 | 25.4 | 20.2 | 31.3 |
| Concurrent prescription and non-prescription medications |
||||||||||||||||||
| 2 or more of eachTable 3 Note ‡ | 22.1 | 16.5 | 28.9 | 12.6 | 8.7 | 17.8 | 36.1 | 27.4 | 45.9 | 43.7 | 38.2 | 49.4 | 26.6Note E: Use with caution | 17.5 | 38.2 | 51.1 | 43.6 | 58.5 |
| 3 or more of eachTable 3 Note § | 10.8Note E: Use with caution | 7.1 | 16.1 | <9.1Table 3 Note † | Note ...: not applicable | Note ...: not applicable | 20.5Note E: Use with caution | 13.8 | 29.4 | 23.2 | 19.7 | 27.2 | 11.2Note E: Use with caution | 6.2 | 19.5 | 28.4 | 22.6 | 35.0 |
|
... not applicable E use with caution
Source: Statistics Canada, Canadian Health Measures Survey, Cycle 5, 2016 to 2017. |
||||||||||||||||||
Table 4 further stratifies respondents aged 60 to 79 years by sex and frailty, showing that non-prescription polypharmacy was higher among older women compared with older men overall (women: 32.5% [95% CI = 27.0 to 38.6]; men: 17.0% [95% CI = 12.2 to 23.1]). We also found large differences in the prevalence of total polypharmacy within each sex by frailty status. For example, 84.8% (95% CI = 79.1 to 89.1) of pre-frail or frail older women had total polypharmacy, compared with 54.1% (95% CI = 39.6 to 68.0) of non-frail older women.
| Column % (unless otherwise specified) | ||||||||||||||||||
|---|---|---|---|---|---|---|---|---|---|---|---|---|---|---|---|---|---|---|
| Women | Men | |||||||||||||||||
| Overall | Non-frail [FI ≤ 0.1] | Pre-frail and frail [FI > 0.1] | Overall | Non-frail [FI ≤ 0.1] | Pre-frail and frail [FI > 0.1] | |||||||||||||
| Estimate | 95% confidence interval |
Estimate | 95% confidence interval |
Estimate | 95% confidence interval |
Estimate | 95% confidence interval |
Estimate | 95% confidence interval |
Estimate | 95% confidence interval |
|||||||
| Lower | Upper | Lower | Upper | Lower | Upper | Lower | Upper | Lower | Upper | Lower | Upper | |||||||
| Overall prevalence | Note ...: not applicable | Note ...: not applicable | Note ...: not applicable | 29.3 | 23.5 | 35.9 | 70.7 | 64.1 | 76.5 | Note ...: not applicable | Note ...: not applicable | Note ...: not applicable | 30.7 | 26.4 | 35.3 | 69.3 | 64.7 | 73.6 |
| Total medications | ||||||||||||||||||
| 0 | < 6.3Table 4 Note † | Note ...: not applicable | Note ...: not applicable | < 10.7Table 4 Note † | Note ...: not applicable | Note ...: not applicable | Note F: too unreliable to be published | Note ...: not applicable | Note ...: not applicable | 2.5Note E: Use with caution | 1.3 | 4.9 | < 8.1Table 4 Note † | Note ...: not applicable | Note ...: not applicable | < 6.7Table 4 Note † | Note ...: not applicable | Note ...: not applicable |
| 1 to 4 | 22.2 | 17.9 | 27.2 | 41.4 | 27.9 | 56.3 | 14.2Note E: Use with caution | 9.7 | 20.4 | 38.2 | 30.4 | 46.6 | 63.9 | 49.1 | 76.5 | 26.8 | 20.9 | 33.6 |
| 5 or more | 75.8 | 71.1 | 79.9 | 54.1 | 39.6 | 68.0 | 84.8 | 79.1 | 89.1 | 59.3 | 50.7 | 67.3 | 32.5Note E: Use with caution | 21.7 | 45.5 | 71.1 | 64.0 | 77.4 |
| Prescription medications | ||||||||||||||||||
| 0 | 16.1 | 11.9 | 21.5 | 33.8Note E: Use with caution | 20.9 | 49.6 | 8.8Note E: Use with caution | 5.2 | 14.4 | 16.1 | 12.5 | 20.6 | 35.7 | 28.8 | 43.4 | 7.5Note E: Use with caution | 4.9 | 11.3 |
| 1 to 4 | 52.8 | 45.7 | 59.7 | 58.3 | 42.9 | 72.2 | 50.5 | 44.5 | 56.4 | 50.7 | 44.7 | 56.6 | 59.7 | 50.9 | 67.8 | 46.7 | 39.7 | 53.8 |
| 5 or more | 31.1 | 25.9 | 36.9 | < 16.5Table 4 Note † | Note ...: not applicable | Note ...: not applicable | 40.8 | 35.1 | 46.6 | 33.2 | 27.9 | 38.9 | < 11.3Table 4 Note † | Note ...: not applicable | Note ...: not applicable | 45.8 | 39.4 | 52.3 |
| Non-prescription medications | ||||||||||||||||||
| 0 | 10.3Note E: Use with caution | 6.7 | 15.5 | 13.2Note E: Use with caution | 6.2 | 25.9 | 9.0Note E: Use with caution | 5.8 | 13.8 | 17.3 | 13.0 | 22.5 | 19.1Note E: Use with caution | 13.1 | 27.1 | 16.4Note E: Use with caution | 9.5 | 26.9 |
| 1 to 4 | 57.2 | 51.4 | 62.9 | 56.8 | 45.8 | 67.1 | 57.4 | 48.1 | 66.3 | 65.8 | 60.1 | 71.0 | 62.7 | 52.8 | 71.6 | 67.1 | 56.7 | 76.1 |
| 5 or more | 32.5 | 27.0 | 38.6 | 30.1Note E: Use with caution | 20.0 | 42.5 | 33.5 | 25.6 | 42.6 | 17.0 | 12.2 | 23.1 | 18.2 | 13.1 | 24.7 | 16.4Note E: Use with caution | 9.9 | 26.0 |
| Concurrent prescription and non-prescription medications |
||||||||||||||||||
| 2 or more of each | 49.8 | 43.1 | 56.5 | 36.6Note E: Use with caution | 22.7 | 53.2 | 55.3 | 46.0 | 64.3 | 37.3 | 29.9 | 45.2 | 16.3Note E: Use with caution | 10.6 | 24.4 | 46.5 | 36.8 | 56.5 |
| 3 or more of each | 27.3 | 22.4 | 32.8 | 14.6Note E: Use with caution | 7.6 | 26.3 | 32.5 | 23.5 | 43.1 | 18.9 | 14.2 | 24.7 | < 16.4Table 4 Note † | Note ...: not applicable | Note ...: not applicable | 23.9 | 18.4 | 30.3 |
|
... not applicable E use with caution F too unreliable to be published
Source: Statistics Canada, Canadian Health Measures Survey, Cycle 5, 2016 to 2017. |
||||||||||||||||||
Common prescription and non-prescription subclasses by frailty status
Table 5 presents the therapeutic subclasses of prescription and non-prescription medications commonly used among respondents overall and by frailty status. The three most commonly used medication subclasses were analgesics (36.3% [95% CI = 32.7 to 40.0]), vitamins (35.3% [95% CI = 30.7 to 40.2]), and anti-inflammatory and anti-rheumatic agents (31.0% [95% CI = 26.0 to 36.5]). Pre-frail and frail respondents had significantly greater use of most prescription and non-prescription medications, including analgesics (pre-frail and frail: 41.8% [95% CI = 36.9 to 46.9]; non-frail: 30.2% [95% CI = 25.4 to 35.5]), lipid modifying agents (pre-frail and frail: 37.6% [95% CI = 33.4 to 42.0]; non-frail: 16.8% [95% CI = 13.4 to 20.9]), and medications for acid-related disorders (e.g., antacids and proton pump inhibitors for heartburn; pre-frail and frail: 24.3% [95% CI = 17.9 to 32.0]; non-frail: 10.8% [95% CI = 7.8 to 14.7]).
| Column % (unless otherwise specified) | |||||||||
|---|---|---|---|---|---|---|---|---|---|
| Overall (n = 2,039)Table 5 Note †† | Frailty status | ||||||||
| Non-frail [FI ≤ 0.1] | Pre-frail and frail [FI > 0.1] | ||||||||
| Estimate | 95% confidence interval |
Estimate | 95% confidence interval |
Estimate | 95% confidence interval |
||||
| Lower | Upper | Lower | Upper | Lower | Upper | ||||
| Therapeutic subgroup (ATC level 2) | |||||||||
| All medications | |||||||||
| AnalgesicsTable 5 Note ‡ | 36.3 | 32.7 | 40.0 | 30.2 | 25.4 | 35.5 | 41.8 | 36.9 | 46.9 |
| Vitamins | 35.3 | 30.7 | 40.2 | 31.3 | 24.8 | 38.7 | 38.9 | 32.9 | 45.3 |
| Anti-inflammatory or anti-rheumatic | 31.0 | 26.0 | 36.5 | 31.3 | 25.4 | 37.8 | 30.8 | 24.6 | 37.6 |
| Lipid modifying agentsTable 5 Note ‡ | 27.7 | 25.5 | 30.0 | 16.8 | 13.4 | 20.9 | 37.6 | 33.4 | 42.0 |
| Agents acting on the renin-angiotensin system (e.g., ACE-I, ARBs)Table 5 Note ‡ | 19.6 | 16.9 | 22.8 | 7.3Note E: Use with caution | 4.7 | 11.0 | 30.9 | 26.7 | 35.4 |
| Drugs for acid-related disorders (e.g., antacids, for GERD)Table 5 Note ‡ | 17.8 | 13.5 | 23.2 | 10.8 | 7.8 | 14.7 | 24.3 | 17.9 | 32.0 |
| Antithrombotic agentsTable 5 Note ‡ | 14.4 | 12.5 | 16.6 | 6.3Note E: Use with caution | 4.3 | 9.0 | 21.8 | 19.3 | 24.5 |
| Psychoanaleptics (e.g., antidepressants, psychostimulants, anti-dementia)Table 5 Note ‡ | 11.1 | 8.2 | 14.5 | <7.2Table 5 Note † | Note ...: not applicable | Note ...: not applicable | 17.8 | 14.6 | 21.6 |
| Mineral supplementsTable 5 Note ‡ | 10.9 | 9.6 | 12.2 | 7.3 | 5.1 | 10.4 | 14.0 | 10.7 | 18.2 |
| Drugs used in diabetesTable 5 Note ‡ | 10.1 | 8.6 | 11.8 | 3.4Note E: Use with caution | 1.9 | 6.1 | 16.2 | 13.5 | 19.4 |
| Anti-anemic preparations (e.g., iron, vitamin B-12, folate) | 9.9 | 7.3 | 13.4 | 8.1Note E: Use with caution | 5.0 | 12.9 | 11.6 | 8.0 | 16.6 |
| Antihistamines for systemic use | 8.3 | 5.9 | 11.7 | 9.7Note E: Use with caution | 5.6 | 16.2 | 7.1Note E: Use with caution | 4.5 | 11.1 |
| Psycholeptics (e.g., antipsychotics, anxiolytics, hypnotic and sedatives)Table 5 Note ‡ | 8.3Note E: Use with caution | 5.7 | 11.9 | 3.8Note E: Use with caution | 2.4 | 5.9 | 12.3Note E: Use with caution | 8.4 | 17.8 |
| Thyroid therapyTable 5 Note ‡ | 8.1 | 6.5 | 10.1 | 3.4Note E: Use with caution | 1.8 | 6.4 | 12.4 | 9.9 | 15.5 |
| Calcium channel blockersTable 5 Note ‡ | 7.3 | 5.6 | 9.6 | <3.4Table 5 Note † | Note ...: not applicable | Note ...: not applicable | 12.6 | 10.0 | 15.8 |
| Drugs for obstructive airway diseasesTable 5 Note ‡ | 7.2Note E: Use with caution | 4.9 | 10.3 | 2.3Note E: Use with caution | 1.2 | 4.1 | 11.6 | 8.4 | 15.8 |
| DiureticsTable 5 Note ‡ | 6.2Note E: Use with caution | 4.1 | 9.2 | <3.7Table 5 Note † | Note ...: not applicable | Note ...: not applicable | 10.3Note E: Use with caution | 7.0 | 14.9 |
|
... not applicable E use with caution
Source: Statistics Canada, Canadian Health Measures Survey, Cycle 5, 2016 to 2017. |
|||||||||
Discussion
Using a nationally representative sample of middle-aged and older Canadians, we estimated the prevalence of pre-frailty and frailty and polypharmacy, explored their relationship overall and across sex and age, and reported commonly used subclasses of prescription and non-prescription medications.
We found that polypharmacy (including both prescription and non-prescription medications) was common overall (50%) and more pronounced among pre-frail and frail (68%) and older (68%) respondents. Compared with the study by Midão et al.Note 9 reporting on polypharmacy among older adults across 17 European countries and Israel, which included both prescription and non-prescription medications, our overall estimate exceeded their highest estimate (39.9% in the Czech Republic), but was lower than prior estimates among older Canadian adults.Note 10 We also found that one-fifth of the overall study population (and almost one-third of pre-frail and frail women) were using five or more non-prescription medications and 16% were using three or more prescription medications and three or more non-prescription medications concurrently. These findings demonstrate the importance of considering non-prescribed medication use when measuring the total pharmaceutical exposure of an individual. Indeed, Qato et al. found that among the 4% of adults at risk of a major drug-drug interaction, half of the combinations involved a non-prescribed medication.Note 19 Since we found a greater concurrent use of prescribed and non-prescribed medications among pre-frail and frail adults, the safety of these combinations in the context of altered pharmacokinetics and pharmacodynamics requires further investigation.
We also found that across levels of frailty and age, a higher prevalence of polypharmacy was largely evident for prescribed medications, since non-prescription medication use alone generally did not statistically differ across groups. These results are similar to those of a recent study of Australian adults, in which there were no statistical differences in the use of non-prescribed medications by chronic disease status, but prescription medication use was significantly greater among those with at least one chronic condition.Note 44 Greater prescription medication use among those who are pre-frail or frail is likely attributed to the management of chronic conditions. Not finding this association with non-prescription medications may reflect their use for different reasons (e.g., maintenance of health, management of transient and minor symptoms). We observed significantly higher concurrent use of multiple prescription and non-prescription medications among respondents who were pre-frail or frail, a finding that may have important safety and tolerability implications.
We did observe differences in the use of non-prescription medications by sex, a finding that aligns with prior research showing a greater use of non-prescribed medications (e.g., analgesics, dietary supplements) in women compared with men.Note 19Note 45 When considering the intersection of sex and frailty, we also observed that pre-frail and frail women had slightly greater concurrent use of two or more of both prescription and non-prescription medications and three or more of both prescription and non-prescription medications compared with pre-frail and frail men. These findings may be linked to sex and gender differences in health-seeking behaviours and the nature of interactions with health care providers and raise concerns about potential prescription and non-prescription drug interactions and related harms that may vary by sex and frailty status.Note 18
The relatively high proportion of middle-aged adults who were defined as pre-frail or frail (40%) and their comparatively high prevalence of polypharmacy and concurrent prescription and non-prescription medications (almost twice that of non-frail older adults) are noteworthy. Several studies have documented increases in multimorbidity in middle-aged adults over time,Note 12Note 33Note 34 with one Canadian study finding that multimorbidity arose 8 to 10 years earlier than in preceding generations.Note 34 Given that longer durations of polypharmacy have been associated with adverse health outcomes,Note 46 the clinical and public health implications of aging pre-frail and frail middle-aged adults who use multiple medications require further investigation (especially given the complex and bidirectional relationship between polypharmacy and frailty).Note 16Note 25Note 26Note 27Note 28Note 29
Regarding the types of medications used, pre-frail and frail respondents were significantly more likely to use several therapeutic subclasses, including analgesics, medications for acid-related disorders, lipid modifying agents and mineral supplements. Although previous studies have shown that high-risk drug interactions involving non-prescription medications are common,Note 19 the safety profile of concurrent prescription and non-prescription medication use among pre-frail and frail adults warrants further study.
Strengths of the current study include its use of a nationally representative sample of community-dwelling adults to derive population-based estimates of frailty and polypharmacy, overall and by frailty level, sex and age group. The systematic collection, cleaning and quality checks by Statistics Canada instill confidence in the data’s integrity, while the in-person review of medications ensured a more comprehensive and unbiased assessment of the use of medications by respondents. Results from this study can reveal the degree by which measures of medication burden relying solely on prescribed medications may underestimate the prevalence of overall medication use and potentially high-risk drug combinations among middle-aged and older adults, especially those who are pre-frail or frail.
However, there are some limitations to mention. First, the pre-frail and frail categories had to be combined, and common drug-drug pairs were largely not estimated because of sample or cell size limitations. Second, the upper age limit was 79 years; therefore, frailty proportions and medication use by those 80 years and older are not discussed. Third, because of small sample sizes, a binary measure for race and ethnic groups was used. Other researchers have shown potentially relevant racial and ethnic differences in the likelihood of multimorbidity, frailty, polypharmacy and related health inequities.Note 47Note 48Note 49Note 50 This area is an important priority for further study. Future population-based surveys should attempt to capture a more comprehensive representation of the racial and ethnic composition of their participants and include this information in their analyses. Last, individuals in this study are likely healthier than the general Canadian population, and this may lead to underestimating the true prevalence of frailty and multiple medication use.
Conclusion
In this cross-sectional study of middle-aged and older Canadians, prescription polypharmacy and the use of concurrent multiple prescription and non-prescription medications were relatively common and significantly higher among pre-frail and frail respondents. Polypharmacy with non-prescription medication use did not vary by frailty status, but was significantly higher among women. There is little evidence available on the relative benefits and risks of concurrent prescribed and non-prescribed medication use in middle-aged and older populations with varying health status. Although medications provide net benefits for many, it is important to consider their cumulative burden, especially among those more prone to or less tolerant of adverse effects, including deleterious drug-drug interactions.
Acknowledgments
Daniel A. Harris is supported by the Alzheimer Society Research Program Doctoral Award. This study was funded by the Canadian Frailty Network (CAT2017-21), which is supported by the Government of Canada through the Networks of Centres of Excellence Program and the University of Waterloo Research Chair held by Dr. Colleen J. Maxwell.
Appendix
| Description | Value |
|---|---|
| Self-perceived health | |
| Excellent or very good | 0.00 |
| Good | 0.50 |
| Fair or poor | 1.00 |
| Change in health status in past year | |
| Much better, somewhat better, about the same | 0.00 |
| Somewhat worse | 0.50 |
| Much worse | 1.00 |
| Self-perceived mental health | |
| Excellent or very good | 0.00 |
| Good | 0.50 |
| Fair or poor | 1.00 |
| Body mass indexAppendix Table 1 Note ‡ | |
| Normal or overweight | 0.00 |
| Obese | 0.50 |
| Underweight | 1.00 |
| HUI-Speech | |
| Understood by everyone or only those who know them | 0.00 |
| Partially understood by everyone | 0.50 |
| Not understood by anyone or partially understood by those who know them | 1.00 |
| HUI-Emotion | |
| Happy and interested in life | 0.00 |
| Somewhat happy | 0.25 |
| Somewhat unhappy | 0.50 |
| Very unhappy | 0.75 |
| So unhappy that life is not worthwhile | 1.00 |
| HUI-Pain | |
| None | 0.00 |
| Pain does not prevent activity | 0.25 |
| Pain prevents few activities | 0.50 |
| Pain prevents some activities | 0.75 |
| Pain prevents most activities | 1.00 |
| HUI-Vision | |
| Sees with and without glasses | 0.00 |
| Reads newsprint with and without glasses; cannot see person across street with glasses | 0.25 |
| Sees person across street with and without glasses; cannot read newsprint with glasses | 0.50 |
| Cannot read newsprint or see person across street with glasses | 0.75 |
| Cannot see | 1.00 |
| HUI-Hearing | |
| No hearing issues | 0.00 |
| Problem hearing in group, corrected | 0.20 |
| Problem hearing in group and individual, corrected | 0.40 |
| Problem hearing in group, not corrected | 0.60 |
| Problem hearing in group and individual, not corrected | 0.80 |
| Cannot hear | 1.00 |
| HUI-Mobility | |
| Walks without difficulty and without aid | 0.00 |
| Mobility problem; no help or aids needed | 0.20 |
| Mobility problem; requires mechanical support | 0.40 |
| Mobility problem; requires wheelchair | 0.60 |
| Mobility problem; requires help from people | 0.80 |
| Cannot walk | 1.00 |
| HUI-Cognition | |
| Can remember most things (thinks clearly and solves problems) | 0.00 |
| Remembers most things (has some difficulty thinking and solving problems) | 0.20 |
| Somewhat forgetful (thinks and solves problems) | 0.40 |
| Somewhat forgetful with some difficulty thinking and solving problems | 0.60 |
| Very forgetful (great difficulty thinking and solving problems) | 0.80 |
| Unable to remember anything, think and solve problems | 1.00 |
| HUI-Dexterity | |
| Full use of both hands and 10 fingers | 0.00 |
| Limited use of hands (no help needed) | 0.20 |
| Limited use of hands (uses special tools) | 0.40 |
| Limited use of hands (needs help for some tasks) | 0.60 |
| Limited use of hands (needs help for most tasks) | 0.80 |
| Limited use of hands (needs help for all tasks) | 1.00 |
| Total hand grip strengthAppendix Table 1 Note ‡ | |
| Normal (for age and sex) | 0.00 |
| Lowest quartile, separated by sex | 1.00 |
| BalanceAppendix Table 1 Note ‡ | |
| No issues | 0.00 |
| Lost balance because of dizziness or lost consciousness in past year | 1.00 |
| Falls | |
| None | 0.00 |
| Fall in past year, includes falls that did not result in injury | 1.00 |
| Chest painAppendix Table 1 Note ‡ | |
| No chest pain in past month | 0.00 |
| Experienced chest pain (at rest or during daily activities of living) in past month | 1.00 |
| Chronic conditions | |
| Absence of condition | 0.00 |
| Presence of 15 conditions (each scored as separate item): arthritis; back problems; osteoporosis; high blood pressure; asthma, chronic bronchitis, emphysema, and chronic obstructive pulmonary disease; heart disease; heart attack; diabetes; cancer (past and present); thyroid disease; effects of stroke; kidney dysfunction and disease; liver disease and gallbladder problems; mood disorder; and glaucoma, cataracts and age-related macular degeneration |
1.00 |
Source: Statistics Canada, Canadian Health Measures Survey, Cyle 5, 2016 to 2017. |
|
| Column % (unless otherwise specified) | ||||||
|---|---|---|---|---|---|---|
| Non-frail [FI ≤ 0.1] | Pre-frail and frail [FI > 0.1] | |||||
| Estimate | 95% confidence interval |
Estimate | 95% confidence interval |
|||
| Lower | Upper | Lower | Upper | |||
| Overall prevalence | 47.6 | 42.6 | 52.7 | 52.4 | 47.3 | 57.4 |
| Total sampleAppendix Table 2 Note † | ||||||
| Total medications | ||||||
| Five or more | 31.8 | 25.0 | 38.6 | 64.1 | 55.7 | 72.4 |
| Prescription medications | ||||||
| Five or more | 4.6 | 1.9 | 7.3 | 32.7 | 28.1 | 37.2 |
| Non-prescription medications | ||||||
| Five or more | 18.8 | 12.2 | 25.4 | 22.6 | 16.1 | 29.0 |
| Concurrent prescription and non-prescription medications | ||||||
| Two or more of each | 17.4 | 13.0 | 21.9 | 41.0 | 35.7 | 46.4 |
| Three or more of each | 7.0 | 3.9 | 10.0 | 22.7 | 18.2 | 27.2 |
| WomenAppendix Table 2 Note † | ||||||
| Total medications | ||||||
| Five or more | 41.4 | 30.5 | 52.3 | 69.0 | 60.6 | 77.5 |
| Prescription medications | ||||||
| Five or more | 7.0 | 2.0 | 12.0 | 29.8 | 25.6 | 34.0 |
| Non-prescription medications | ||||||
| Five or more | 24.0 | 13.8 | 34.3 | 30.4 | 20.2 | 40.7 |
| Concurrent prescription and non-prescription medications | ||||||
| Two or more of each | 24.7 | 16.4 | 33.0 | 45.7 | 38.7 | 52.8 |
| Three or more of each | 10.8 | 3.6 | 18.0 | 26.7 | 21.7 | 31.8 |
| MenAppendix Table 2 Note † | ||||||
| Total medications | ||||||
| Five or more | 24.2 | 18.1 | 30.4 | 57.7 | 48.8 | 66.6 |
| Prescription medications | ||||||
| Five or more | 2.8 | 0.7 | 4.9 | 36.7 | 26.8 | 46.6 |
| Non-prescription medications | ||||||
| Five or more | 15.0 | 8.9 | 21.1 | 12.0 | 6.7 | 17.3 |
| Concurrent prescription and non-prescription medications | ||||||
| Two or more of each | 10.8 | 7.4 | 14.2 | 34.8 | 28.6 | 40.9 |
| Three or more of each | 4.0 | 1.3 | 6.7 | 17.4 | 10.9 | 23.8 |
Source: Statistics Canada, Canadian Health Measures Survey, Cyle 5, 2016 to 2017. |
||||||
- Date modified: