
Health Reports
Hypertension associated with hearing health problems among Canadian adults aged 19 to 79 years

by Pamela L. Ramage-Morin, Rex Banks, Dany Pineault, Maha Atrach, and Heather Gilmour
DOI: https://www.doi.org/10.25318/82-003-x202101000002-eng
Abstract
Background
Hypertension is a common condition experienced by close to one-quarter of the adult population in Canada. There is evidence that this condition or the medications used to treat it may lead to hearing health problems (defined in this study as having hearing loss, tinnitus or both conditions).
Data and methods
Data from the Canadian Health Measures Survey from 2012 to 2015 were used to estimate the prevalence of hypertension and hearing health problems for individuals aged 19 to 79 years (n=6,198). Data from cycles 3 (n=3,072) and 4 (n=3,126) were combined. The relationship of hypertension to hearing health problems was assessed with multivariate logistic regression.
Results
An estimated 40% of the adult population were free of hearing health problems, while the remaining 60% had either hearing loss (23%), tinnitus (22%) or both conditions (14%); 22% of the adult population had hypertension. Hearing health problems were significantly more prevalent among adults with hypertension (79%) than among those without hypertension (54%). Hypertension was associated with greater odds of hearing health problems in both males (adjusted odds ratio [AOR]=1.7) and females (AOR=1.6), even after accounting for age, sociodemographic, health-related and noise exposure variables.
Interpretation
This study adds to the body of evidence that identifies hypertension as a potentially modifiable risk factor for hearing loss and tinnitus. Males and females with hypertension had a higher risk of experiencing hearing health problems, demonstrating the importance of screening those with hypertension for hearing health.
Keywords
hearing loss, tinnitus, audiometry, hearing health, high blood pressure, chronic condition, cross-sectional study, prevalence, Canadian Health Measures Survey.
Authors
Pamela Ramage-Morin (Pamela.Ramage-Morin@canada.ca) and Heather Gilmour (Heather.Gilmour@canada.ca) are with the Health Analysis Division at Statistics Canada, Ottawa, Ontario, K1A 0T6. Rex Banks (rbanks@chs.ca), Dany Pineault (DPineault@chs.ca) and Maha Atrach (matrach@chs.ca) are audiologists with Canadian Hearing Services, Toronto, Ontario, M5R 2V3.
What is already known on this subject?
- Hearing loss and tinnitus are common and potentially disabling conditions that impact many aspects of life such as stress, mental health and interpersonal relationships.
- Hypertension, which is also common, and the medications used to treat the condition have been implicated in the development of hearing loss and tinnitus, although results are not consistent.
- The co-occurrence of hearing loss and tinnitus presents a challenge when examining the association of hypertension with one or the other outcome.
What does this study add?
- This is the first study to examine associations between hypertension and combined hearing health problems (hearing loss and/or tinnitus).
- Hearing health problems were significantly more prevalent among adults with hypertension (79%) than among those without hypertension (54%).
- Males and females with hypertension had a significantly higher risk of experiencing hearing health problems, even after accounting for age, sociodemographic, health-related and noise exposure variables.
- The results demonstrate the importance of screening those with hypertension for hearing health and support the integration of audiology and chronic disease management.
End of text box
Introduction
Hearing loss is one of the leading causes of disability globally.Note 1 By 2050, an estimated 2.5 billion people will be living with some degree of hearing loss, which can impact many aspects of life, such as social isolation, cognition, employment, mental health and interpersonal relationships.Note 2 This increase is driven by factors such as increasing longevity; aging populations; occupational and recreational noise exposure; chronic conditions; environmental factors; and ototoxic substances, including some medications.Note 1Note 2 Tinnitus—the perception of noise that is not generated by an external sourceNote 3—is a potentially debilitating symptom that is closely associated with otological conditions, including hearing loss.Note 4Note 5 In Canada, an estimated 60% of adults have hearing health problems—defined as hearing loss (24%), tinnitus (22%) or both conditions (15%).Note 6
Hypertension (high blood pressure) or the medications used to treat the condition have been implicated in the development of hearing lossNote 7Note 8 and tinnitus,Note 4Note 9Note 10 although results are not consistent.Note 9 Hypertension is increasingly common in Canada,Note 11 with recent estimates reporting that almost one-quarter of the adult population aged 20 to 79 years are hypertensive.Note 12Hypertension is more prevalent at older ages. However, younger adults—those aged 20 to 39 years—are less likely than older individuals to be aware of and receiving treatment for their high blood pressure; consequently, it is less likely to be controlled in this younger population.Note 12
Chronic stress-related health conditions such as hypertension are often listed as important risk factors for high-frequency sensorineural hearing loss and primary tinnitus. However, the mechanism underlying the relationship between hypertension and hearing health problems remains unclear.Note 13Note 14Note 15 Researchers have proposed that hypertension may increase the risk of inner ear tissue damage and decrease the endocochlear potential (EP) because of reduced blood supply to the stria vascularis (Figure 1).Note 16 Cochlear microcirculation is derived from the common cochlear branch of the labyrinthine artery with no collateral or alternate bloodstream.Note 17 The basal end of the cochlea might be particularly sensitive to reduced vascular flow because of its distance from the common cochlear artery. Consequently, sensory cells responsible for high-frequency sound encoding are also commonly affected by hypothesized hypertension-related changes.Note 16Note 17 Normal blood supply to the cochlea is also critical for sustaining EP transmission, ion transport and recycling, and endolymphatic fluid balance, as sensory hair cells are incredibly vulnerable to ischemia and free radicals. Moreover, the combination of hypertension-related changes in inner ear homeostasis and oxidative stress may enhance the negative effects of aging and other risk factors, resulting in accelerated sensory and strial cell loss.Note 18 Finally, the ototoxic properties of blood pressure medications, such as diuretics, furosemide, calcium channel blockers and angiotensin-converting enzyme(ACE) inhibitors, have also been proposed as a potential explanation for the association between hypertension and hearing health problems.Note 19Note 20 However, current evidence regarding the link between hypertension medications and hearing loss and tinnitus is lacking.
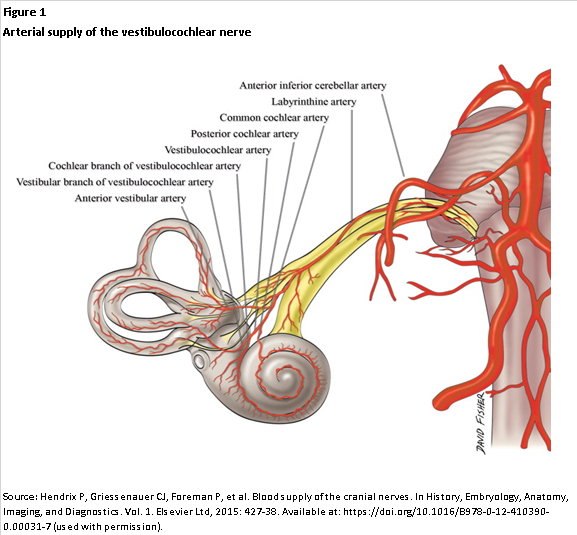
Description for Figure 1
The figure presents a scientific illustration of the arterial vestibulocochlear nerve of the inner ear. The cochlea and vestibulocochlear nerve are shown. Eight arteries are labelled from bottom left to top right—the anterior vestibular artery, vestibular branch of vestibulocochlear artery, cochlear branch of vestibulocochlear artery, vestibulocochlear artery, posterior cochlear artery, common cochlear artery, labyrinthine artery and anterior inferior cerebellar artery.
The purpose of this current study is to quantify associations between hypertension and hearing health problems—defined as having hearing loss, tinnitus or both conditions for adults aged 19 to 79 years. Data from cycles 3 (2012 to 2013) and 4 (2014 to 2015) of the Canadian Health Measures Survey (CHMS) are used. Because of differences between males and females in hypertension, hearing loss and tinnitus,Note 6Note 12Note 21Note 22 the analysis was stratified by sex.
Methods
Data source
The CHMS is an ongoing cross-sectional survey that samples households from five regions across Canada (Atlantic provinces, Quebec, Ontario, the Prairies and British Columbia). Participants provided demographic, socioeconomic, health and lifestyle information through an in-person, computer-assisted household interview, followed by direct physical measurements collected at a mobile examination centre (MEC). The CHMS excludes full-time members of the Canadian Armed Forces; residents of the three territories, First Nations reserves and other Indigenous settlements in the provinces; residents of institutions such as nursing homes; and residents of certain remote regions. All together, these exclusions represent approximately 4% of the target population. Proxy interviews were accepted in cases of physical or intellectual impairment.
Data from cycles 3 (2012 to 2013) and 4 (2014 to 2015) were combined for this analysis. At each cycle, data were collected from January (year 1) through December (year 2) at 16 randomly selected sites and two MECs distributed across the five regions. The combined cycle 3 and 4 response rate for the household and MEC components was 52.7%. The surveys were weighted to account for the sample design and non-response. The weights were divided by two so that the estimates were representative of the Canadian population from 2012 to 2015. Details regarding the sampling design, data collection, calculation of response rates and weighting process that permit the calculation of population estimates from the sample are available in the CHMS user guidesNote 23Note 24 and the Instructions for Combining Multiple Cycles of Canadian Health Measures Survey (CHMS) Data.Note 25 Further information on the sampling frame and data collection are available at www.statcan.gc.ca.
Study sample
This study was based on respondents aged 19 to 79 years (n=6,571) and was restricted to 6,198 respondents (3,096 males and 3,102 females) who had valid audiometric results in both ears. The weighted study sample combines data from cycles 3 (n=3,072) and 4 (n=3,126) and represents a population of 24.6 million Canadians.
Definitions
A hearing health problem was defined as having hearing loss, tinnitus or both conditions. Hearing loss was established using audiometric evaluation and was defined as a unilateral or bilateral threshold above 25 dB in the worst ear, based on four-frequency pure-tone average (PTA) across 0.5, 1, 2 and 4 kHz; high-frequency PTA across 3, 4, 6 and 8 kHz; and low-frequency PTA across 0.5, 1 and 2 kHz. Those with a PTA above the 25 dB threshold over high, low or four frequencies were classified as having any hearing loss. The hearing loss threshold for adults aged 19 or older was based on the American Speech-Language-Hearing Association guidelines.Note 26 Tinnitus was described as “the presence of hissing, buzzing, ringing, rushing or roaring sounds in your ears when there is no other sound around you.” The focus was on respondents who had experienced tinnitus within the past year; they were asked whether it bothered them, affecting their sleep, concentration or mood, for example. Those who responded “yes” were considered to have bothersome tinnitus.
Six systolic blood pressure (SBP) and diastolic blood pressure (DBP) readings were taken at the MEC using the BpTRU™ BPM-300 device (BpTRU Medical Devices Ltd., Coquitlam, British Columbia).Note 27 The last five measurements were averaged for the SBP and DBP levels. Hypertension was defined as SBP ≥ 140 mm Hg or DBP ≥ 90 mm HgNote 28 or the use of antihypertensive medication in the past month. Medications were recorded at the household interview, verified at the MEC and classified according to Health Canada’s Anatomical Therapeutic Chemical (ATC) classification codes (Appendix Table A).
Age groups are 19 to 39, 40 to 59 and 60 to 79 years. Age was entered into the multivariate analyses in single years as a continuous variable.
Household education indicates the highest level of education acquired by any member of the household and was classified as less than postsecondary or a higher level of educational attainment.
Respondents were asked about long-term health conditions (lasting or expected to last at least six months) that have been diagnosed by a health professional. The following five chronic conditions that have been associated with hypertension, hearing loss or tinnitus or that may be treated with ototoxic medications were selected for this study: diabetes (excluding gestational diabetes) or drugs used for diabetes in the last month (ATC classification code A10), kidney dysfunction or disease, cardiovascular disease (heart disease, history of a heart attack, or suffers from the effects of a stroke), current or history of cancer, and arthritis. Respondents were grouped into those who had one or more of the chronic conditions and those who had none of the conditions.
Self-perceived stress was classified as low, medium or high based on responses to the following question: thinking about the amount of stress in your life, would you say that most days are not at all or not very stressful (low), a bit stressful (medium), or quite a bit or extremely stressful (high)?
Based on body mass index (BMI=measured weight [kg] / measured height [metres] squared), respondents with a BMI ≥ 30.00 kg/m2 were classified as having obesity.Note 29 Continuous BMI values were entered into multivariate models.
Those exposed to smoke included current smokers (daily or occasional) and non-smokers (former smokers or never smoked) who were exposed to second-hand smoke (defined as living in a home where smoking was allowed or being exposed to second-hand smoke in private vehicles, places of work, someone else’s home or public indoor places). Non-smokers who were not exposed to second-hand smoke comprised the comparison group.
History of work-related noise exposure was captured using the following two questions: “At any time in your life, have you worked in a noisy environment?” and, if so, “How long did you work in a noisy environment?” A noisy work environment was defined as one that was so loud that respondents and their co-workers had to speak in raised voices to be understood by or communicate with someone standing an arm’s length away. Respondents’ history of work-related noise exposure was classified as never, less than 10 years, or 10 years or more.
Loud noise at work, at school or during leisure time was based on exposure in the last 12 months. Sources of loud noise include power tools, heavy construction or farming equipment, gasoline engines such as chainsaws and leaf blowers, motorcycles and snowmobiles, concerts, sporting and other entertainment events, firearms, and the use of audio devices with headphones or earbuds. A count of the number of different sources of exposure was included as a continuous variable in the multivariate analysis.
Analytical techniques
Weighted frequencies were used to describe the study population, specifically the prevalence of hypertension, hearing health variables and selected covariates that are potential confounding variables in the relationship between hypertension and hearing health problems. Weighted cross-tabulations were calculated to estimate the prevalence of hearing health problems by hypertension status and the selected covariates described in the “Definitions” section. Separate logistic regression models for males and females were used to examine the odds of having hearing health problems by hypertension status in models that controlled for age, which is a potentially important confounding variable (Model 1), followed by fully adjusted models that controlled for age, sociodemographic, health-related and noise exposure variables (Model 2). The selection of covariates was informed by earlier studies and was based on potential relationships with hypertension and hearing health problems. Variance inflation factors (≤ 2.9) and tolerance estimates (≥ 0.2) for the models demonstrated that multicollinearity was not a problem.
To account for the complex survey design, 95% confidence intervals (CIs), standard errors and coefficients of variation were estimated using the bootstrap technique with 22 degrees of freedom.Note 30Note 31
Results
The population distribution of hypertension and hearing health problems is presented in Table 1. An estimated 22% of adults aged 19 to 79 years had hypertension, which is the primary exposure variable in this study. There was no difference in the prevalence of hypertension between males and females.
| Characteristics | Both sexes | Males | Females | |||||||||
|---|---|---|---|---|---|---|---|---|---|---|---|---|
| Number '000 | % | 95% confidence interval |
Number '000 | % | 95% confidence interval |
Number '000 | % | 95% confidence interval |
||||
| from | to | from | to | from | to | |||||||
| Total | 24,624 | 100.0 | Note ...: not applicable | Note ...: not applicable | 12,274 | 100.0 | Note ...: not applicable | Note ...: not applicable | 12,351 | 100.0 | Note ...: not applicable | Note ...: not applicable |
| Hypertension | ||||||||||||
| Yes | 5,498 | 22.4 | 20.2 | 24.6 | 2,839 | 23.1 | 20.9 | 25.5 | 2,660 | 21.6 | 18.6 | 24.8 |
| No | 19,100 | 77.6 | 75.4 | 79.8 | 9,434 | 76.9 | 74.5 | 79.1 | 9,666 | 78.4 | 75.2 | 81.4 |
| Hearing health | ||||||||||||
| Hearing health problems | 14,369 | 59.7 | 57.6 | 61.9 | 7,838 | 66.2 | 62.0 | 70.1 | 6,531 | 53.5Note * | 56.6 | 56.8 |
| Hearing loss and tinnitus | 3,475 | 14.4 | 12.7 | 16.4 | 1,989 | 16.8 | 14.3 | 19.6 | 1,486 | 12.2Note * | 10.1 | 14.6 |
| Hearing loss only | 5,617 | 23.3 | 21.6 | 25.2 | 3,251 | 27.5 | 23.9 | 31.3 | 2,365 | 19.4Note * | 17.2 | 21.8 |
| Tinnitus only | 5,277 | 21.9 | 20.0 | 24.0 | 2,597 | 21.9 | 18.5 | 25.8 | 2,680 | 21.9 | 19.6 | 24.4 |
| No hearing health problems | 9,688 | 40.3 | 38.1 | 42.4 | 4,002 | 33.8 | 29.9 | 38.0 | 5,685 | 46.5Note * | 49.7 | 49.5 |
| Any hearing loss | 9,238 | 37.5 | 36.1 | 39.0 | 5,328 | 43.4 | 40.5 | 46.4 | 3,910 | 31.7Note * | 28.4 | 35.1 |
| Low frequency | 3,834 | 15.6 | 14.1 | 17.1 | 2,144 | 17.5 | 15.3 | 19.9 | 1,690 | 13.7Note * | 11.9 | 15.7 |
| Four frequency | 4,757 | 19.3 | 17.7 | 21.0 | 2,963 | 24.1 | 21.3 | 27.2 | 1,794 | 14.5Note * | 12.8 | 16.5 |
| High frequency | 8,843 | 35.9 | 34.4 | 37.4 | 5,057 | 41.2 | 38.4 | 44.1 | 3,786 | 30.7Note * | 27.6 | 33.9 |
| No hearing loss | 15,386 | 62.5 | 61.0 | 63.9 | 6,946 | 56.6 | 53.6 | 59.5 | 8,441 | 68.3Note * | 64.9 | 71.6 |
| Tinnitus (past year) | 8,752 | 36.4 | 33.4 | 39.5 | 4,587 | 38.7 | 33.7 | 44.1 | 4,166 | 34.1 | 31.9 | 36.4 |
| Bothersome | 1,543 | 6.4 | 5.4 | 7.5 | 686 | 5.8 | 4.1 | 8.1 | 857 | 7.0 | 5.6 | 8.7 |
| Not bothersome | 7,207 | 30.0 | 27.2 | 32.9 | 3,901 | 32.9 | 28.8 | 37.4 | 3,306 | 27.1Note * | 24.6 | 29.7 |
| No tinnitus (past year) | 15,304 | 63.6 | 60.5 | 66.6 | 7,254 | 61.3 | 55.9 | 66.3 | 8,051 | 65.9 | 63.6 | 68.1 |
... not applicable
|
||||||||||||
The outcome in this study is hearing health problems. Approximately 60% of the adult population were classified as having a hearing health problem—that is, they had either hearing loss (23%), tinnitus (22%) or both conditions (14%) (Table 1; Figure 2). The remaining 40% of adults did not have either condition. The distribution of hearing loss over different frequencies and tinnitus (bothersome or not) is provided in Table 1.

Description for Figure 2
The figure includes a pie chart on the right and a Venn diagram on the left. The pie chart has four separate wedges to show the proportion of the adult population aged 19 to 79 that had no hearing loss or tinnitus (40.3%), hearing loss (23.3%), tinnitus in the past year (21.9%), or both hearing loss and tinnitus (14.4%).
The Venn diagram represents the population with hearing health problems—that is, hearing loss, tinnitus or both conditions. The circle on the left represents those with hearing loss, and the circle on the right represents those with tinnitus in the past year. The centre portion where the two circles overlap represents people who have both hearing loss and tinnitus. Percentages placed on the Venn diagram demonstrate that among those with hearing health problems, 39.1% had hearing loss, 36.7% had tinnitus in the past year and 24.2% had both conditions.
A number of conditions or circumstances related to both hypertension and hearing health (Table 2) were taken into account in the multivariate analysis (tables 4 and 5). These potential confounding variables include other chronic conditions, obesity, stress, and exposure to smoke and noise. An estimated 28% of adults had at least one of the selected chronic conditions, 28% had obesity, 26% reported high stress, and 32% were exposed to smoke either as a smoker or from second-hand smoke. Overall, 15% of adults had worked in noisy environments for 10 years or more, and 44% of the adult population had been exposed to three or more sources of loud noise in the past year at work, at school or during leisure time. Males were more likely than females to have been exposed to smoke and noise.
Males and females with hypertension were more likely than individuals without hypertension to have hearing health problems (Table 3). Overall, 79% (95% CI: 75.3% to 82.5%) of adults with hypertension had hearing health problems, compared with 54% (95% CI: 51.8% to 56.8%) of individuals without hypertension (data not shown in table). Of the potentially confounding variables, older age, lower levels of household education, selected chronic conditions and history of work in noisy environments for 10 years or more were associated with a higher likelihood of hearing health problems for males and females. No or few associations were evident between hearing health and obesity; smoke exposure; stress; or the number of sources of loud noise at work, at school or during leisure time in the past year.
| Characteristics | Both sexes | Males | Females | |||||||||
|---|---|---|---|---|---|---|---|---|---|---|---|---|
| Number '000 | % | 95% confidence interval |
Number '000 | % | 95% confidence interval | Number '000 | % | 95% confidence interval | ||||
| from | to | from | to | from | to | |||||||
| Total | 24,624 | 100.0 | Note ...: not applicable | Note ...: not applicable | 12,274 | 100.0 | Note ...: not applicable | Note ...: not applicable | 12,351 | 100.0 | Note ...: not applicable | Note ...: not applicable |
| Sociodemographic | ||||||||||||
| Age group (years) | ||||||||||||
| 19 to 39 | 9,453 | 38.4 | 37.7 | 39.1 | 4,778 | 38.9 | 38.1 | 39.8 | 4,675 | 37.9 | 36.9 | 38.8 |
| 40 to 59 | 9,500 | 38.6 | 38.1 | 39.1 | 4,722 | 38.5 | 37.7 | 39.2 | 4,778 | 38.7 | 38.0 | 39.4 |
| 60 to 79 | 5,671 | 23.0 | 22.6 | 23.5 | 2,773 | 22.6 | 22.2 | 23.0 | 2,897 | 23.5Note * | 22.8 | 24.1 |
| Household education | ||||||||||||
| Postsecondary or higher | 18,411 | 78.3 | 74.9 | 81.3 | 8,801 | 75.6 | 71.4 | 79.4 | 9,609 | 80.8Note * | 76.5 | 84.5 |
| Less than postsecondary | 5,110 | 21.7 | 18.7 | 25.1 | 2,834 | 24.4 | 20.6 | 28.6 | 2,276 | 19.2Note * | 15.5 | 23.5 |
| Chronic conditions | ||||||||||||
| Diabetes | ||||||||||||
| Yes | 1,534 | 6.2 | 5.4 | 7.2 | 852 | 6.9 | 5.9 | 8.2 | 682 | 5.5 | 4.4 | 6.9 |
| No | 23,076 | 93.8 | 92.8 | 94.6 | 11,416 | 93.1 | 91.8 | 94.1 | 11,660 | 94.5 | 93.1 | 95.6 |
| Kidney disease | ||||||||||||
| Yes | 346Note E: Use with caution | 1.4Note E: Use with caution | 1.0 | 2.0 | 191Note E: Use with caution | 1.6Note E: Use with caution | 1.0 | 2.4 | 155Note E: Use with caution | 1.3Note E: Use with caution | 0.7 | 2.2 |
| No | 24,270 | 98.6 | 98.0 | 99.0 | 12,079 | 98.4 | 97.6 | 99.0 | 12,191 | 98.7 | 97.8 | 99.3 |
| Cardiovascular disease | ||||||||||||
| Yes | 1,325 | 5.4 | 4.6 | 6.3 | 907 | 7.4 | 6.1 | 9.0 | 418 | 3.4Note * | 2.6 | 4.4 |
| No | 23,245 | 94.6 | 93.7 | 95.4 | 11,352 | 92.6 | 91.0 | 93.9 | 11,893 | 96.6Note * | 95.6 | 97.4 |
| Cancer | ||||||||||||
| Yes | 1,847 | 7.5 | 6.2 | 9.0 | 838 | 6.8 | 5.4 | 8.5 | 1,008 | 8.2 | 6.4 | 10.4 |
| No | 22,774 | 92.5 | 91.0 | 93.8 | 11,432 | 93.2 | 91.5 | 94.6 | 11,342 | 91.8 | 89.6 | 93.6 |
| Arthritis | ||||||||||||
| Yes | 4,088 | 16.6 | 14.6 | 18.9 | 1,773 | 14.4 | 11.5 | 17.9 | 2,315 | 18.8Note * | 16.9 | 20.8 |
| No | 20,506 | 83.4 | 81.1 | 85.4 | 10,498 | 85.6 | 82.1 | 88.5 | 10,008 | 81.2Note * | 79.2 | 83.1 |
| One or more of these chronic conditions | ||||||||||||
| Yes | 6,847 | 27.8 | 25.2 | 30.6 | 3,395 | 27.7 | 24.2 | 31.5 | 3,452 | 28.0 | 25.3 | 30.9 |
| No | 17,746 | 72.2 | 69.4 | 74.8 | 8,866 | 72.3 | 68.5 | 75.8 | 8,879 | 72.0 | 69.1 | 74.7 |
| Obesity | ||||||||||||
| Yes, body mass index (BMI) (kg/m2) ≥ 30.00 | 6,788 | 27.9 | 24.8 | 31.1 | 3,445 | 28.2 | 24.3 | 32.4 | 3,343 | 27.5 | 23.8 | 31.5 |
| No, BMI (kg/m2) < 30.00‡ | 17,580 | 72.1 | 68.9 | 75.2 | 8,775 | 71.8 | 67.6 | 75.7 | 8,805 | 72.5 | 68.5 | 76.2 |
| Stress | ||||||||||||
| High | 6,385 | 26.0 | 23.4 | 28.8 | 3,104 | 25.4 | 21.4 | 29.9 | 3,281 | 26.6 | 22.7 | 30.9 |
| Medium | 10,220 | 41.6 | 39.4 | 43.8 | 4,995 | 40.9 | 37.6 | 44.2 | 5,225 | 42.3 | 38.4 | 46.3 |
| Low | 7,968 | 32.4 | 29.9 | 35.0 | 4,127 | 33.8 | 30.4 | 37.2 | 3,842 | 31.1 | 27.6 | 34.9 |
| Exposure to smoke | ||||||||||||
| Yes | 7,705 | 31.6 | 29.3 | 33.9 | 4,383 | 36.1 | 33.2 | 39.0 | 3,322 | 27.1Note * | 24.0 | 30.5 |
| No | 16,714 | 68.4 | 66.1 | 70.7 | 7,774 | 63.9 | 61.0 | 66.8 | 8,940 | 72.9Note * | 69.5 | 76.0 |
| Exposure to noise | ||||||||||||
| Time worked in a noisy environment | ||||||||||||
| Never | 14,013 | 57.1 | 53.7 | 60.4 | 4,824 | 39.5 | 34.7 | 44.5 | 9,189 | 74.5Note * | 70.5 | 78.1 |
| Less than 10 years | 6,949 | 28.3 | 26.3 | 30.3 | 4,517 | 37.0 | 34.1 | 39.9 | 2,432 | 19.7Note * | 16.4 | 23.6 |
| 10 years or more | 3,594 | 14.6 | 12.7 | 16.8 | 2,880 | 23.6 | 19.9 | 27.7 | 714 | 5.8Note * | 4.7 | 7.1 |
| Exposure to sources of loud noise | ||||||||||||
| at work, at school or during leisure time | ||||||||||||
| No exposure | 4,184 | 17.1 | 15.4 | 18.9 | 1,338 | 11.0 | 8.9 | 13.4 | 2,846 | 23.1Note * | 20.9 | 25.6 |
| One source | 5,050 | 20.6 | 18.4 | 22.9 | 1,941 | 15.9 | 12.9 | 19.5 | 3,109 | 25.3Note * | 22.1 | 28.7 |
| Two sources | 4,525 | 18.5 | 16.6 | 20.5 | 2,009 | 16.4 | 14.5 | 18.6 | 2,516 | 20.5Note * | 17.5 | 23.8 |
| Three or more sources | 10,758 | 43.9 | 40.3 | 47.6 | 6,932 | 56.7 | 51.7 | 61.6 | 3,825 | 31.1Note * | 28.0 | 34.4 |
|
... not applicable E use with caution
Source: 2012 to 2013 and 2014 to 2015 Canadian Health Measures Surveys, combined. |
||||||||||||
| Characteristics | Males | Females | ||||
|---|---|---|---|---|---|---|
| percent | 95% confidence interval | percent | 95% confidence interval | |||
| from | to | from | to | |||
| Total | 66.4 | 62.3 | 70.3 | 53.7 | 50.5 | 56.8 |
| Hypertension | ||||||
| Yes | 84.5Note * | 79.7 | 88.4 | 73.4Note * | 67.8 | 78.4 |
| NoTable 3 Note ‡ | 60.8 | 55.6 | 65.8 | 48.1 | 44.6 | 51.7 |
| Sociodemographic | ||||||
| Age group (years) | ||||||
| 19 to 39Table 3 Note ‡ | 49.9 | 44.3 | 55.5 | 41.3 | 36.7 | 46.1 |
| 40 to 59 | 67.0Note * | 59.9 | 73.4 | 50.2Note * | 43.8 | 56.7 |
| 60 to 79 | 92.7Note * | 90.1 | 94.6 | 79.2Note * | 74.9 | 83.0 |
| Household education | ||||||
| Postsecondary or higherTable 3 Note ‡ | 63.0 | 58.0 | 67.7 | 50.3 | 46.8 | 53.7 |
| Less than postsecondary | 75.3Note * | 68.6 | 81.0 | 67.5Note * | 61.5 | 73.0 |
| Other chronic conditions | ||||||
| Diabetes | ||||||
| Yes | 87.5Note * | 79.8 | 92.6 | 70.9Note * | 57.5 | 81.4 |
| NoTable 3 Note ‡ | 64.8 | 60.3 | 69.1 | 52.7 | 49.2 | 56.1 |
| Kidney disease | ||||||
| Yes | 79.3 | 60.6 | 90.6 | 70.9Note E: Use with caution | 38.4 | 90.5 |
| NoTable 3 Note ‡ | 66.2 | 62.0 | 70.2 | 53.4 | 50.1 | 56.8 |
| Cardiovascular disease | ||||||
| Yes | 87.3Note * | 82.2 | 91.1 | 75.8Note * | 66.8 | 83.0 |
| NoTable 3 Note ‡ | 64.7 | 60.3 | 68.8 | 52.8 | 49.6 | 55.9 |
| Cancer | ||||||
| Yes | 88.9Note * | 81.0 | 93.7 | 74.8Note * | 63.5 | 83.5 |
| NoTable 3 Note ‡ | 64.7 | 60.4 | 68.8 | 51.8 | 48.4 | 55.1 |
| Arthritis | ||||||
| Yes | 84.6Note * | 76.5 | 90.3 | 70.2Note * | 64.6 | 75.3 |
| NoTable 3 Note ‡ | 63.3 | 58.8 | 67.5 | 49.7 | 45.7 | 53.7 |
| One or more of these chronic conditions | ||||||
| Yes | 84.7Note * | 80.2 | 88.3 | 68.9Note * | 63.6 | 73.7 |
| NoTable 3 Note ‡ | 59.2 | 54.2 | 64.1 | 47.7 | 43.3 | 52.2 |
| Obesity | ||||||
| Yes, body mass index (BMI) (kg/m2) ≥ 30.00 | 70.0 | 63.8 | 75.6 | 54.5 | 47.3 | 61.4 |
| No, BMI (kg/m2) < 30.00‡ | 65.2 | 60.2 | 69.8 | 53.0 | 49.1 | 56.8 |
| Stress | ||||||
| High | 68.1 | 61.1 | 74.3 | 50.0 | 42.2 | 57.8 |
| Medium | 60.6Note * | 53.3 | 67.5 | 52.9 | 49.5 | 56.3 |
| LowTable 3 Note ‡ | 72.9 | 66.8 | 78.2 | 57.9 | 52.0 | 63.5 |
| Exposure to smoke | ||||||
| Yes | 64.5 | 58.7 | 69.9 | 57.5 | 51.5 | 63.3 |
| NoTable 3 Note ‡ | 67.7 | 63.0 | 72.1 | 52.0 | 48.6 | 55.3 |
| Exposure to noise | ||||||
| Time worked in a noisy environment | ||||||
| NeverTable 3 Note ‡ | 63.1 | 58.2 | 67.7 | 52.4 | 48.5 | 56.3 |
| Less than 10 years | 62.4 | 55.2 | 69.0 | 52.3 | 44.5 | 60.0 |
| 10 years or more | 78.5Note * | 74.2 | 82.3 | 74.8Note * | 64.1 | 83.3 |
| Exposure to sources of loud noise | ||||||
| at work, at school or during leisure time | ||||||
| No exposureTable 3 Note ‡ | 73.6 | 62.9 | 82.1 | 59.4 | 51.5 | 66.8 |
| One source | 69.1 | 62.7 | 74.8 | 49.6Note * | 44.3 | 55.0 |
| Two sources | 63.5Note * | 57.1 | 69.5 | 56.9 | 47.1 | 66.3 |
| Three or more sources | 65.1 | 57.4 | 72.1 | 50.6 | 42.6 | 58.6 |
E use with caution
Source: 2012 to 2013 and 2014 to 2015 Canadian Health Measures Surveys, combined. |
||||||
Preliminary models (Model 1) examined associations between hypertension and hearing health problems, controlling only for age (Table 4). Hypertension was significantly associated with hearing health problems, over and above the effects of age, for both males and females. The associations persisted in the fully adjusted models (Model 2), where both males with hypertension (adjusted odds ratio [AOR]=1.7) and females with hypertension (AOR=1.6) had higher odds of having hearing health problems than their counterparts without hypertension. Several covariates were also independently associated with hearing health problems. Increasing age, number of exposures to loud noises and a lower level of household education were significantly associated with higher odds of hearing health problems for both males and females. Additionally, having any of the five chronic conditions was associated with increased odds of hearing health problems for males.
| Characteristic | Males | Females | ||||||||||
|---|---|---|---|---|---|---|---|---|---|---|---|---|
| Model 1 | Model 2 | Model 1 | Model 2 | |||||||||
| Odds ratio | 95% confidence interval | Odds ratio | 95% confidence interval | Odds ratio | 95% confidence interval | Odds ratio | 95% confidence interval | |||||
| from | to | from | to | from | to | from | to | |||||
| Hypertension | ||||||||||||
| Yes | 1.6Note * | 1.1 | 2.2 | 1.7Note * | 1.1 | 2.4 | 1.7Note * | 1.2 | 2.5 | 1.6Note * | 1.1 | 2.3 |
| NoTable 4 Note †† | 1.0 | ... | Note ...: not applicable | 1.0 | ... | Note ...: not applicable | 1.0 | ... | Note ...: not applicable | 1.0 | ... | Note ...: not applicable |
| Age (years) | 1.05Note * | 1.04 | 1.06 | 1.05Note * | 1.04 | 1.07 | 1.03Note * | 1.02 | 1.04 | 1.04Note * | 1.03 | 1.05 |
| Household education | ||||||||||||
| Postsecondary or higherTable 4 Note †† | ... | ... | Note ...: not applicable | 1.0 | ... | Note ...: not applicable | ... | ... | Note ...: not applicable | 1.0 | ... | Note ...: not applicable |
| Less than postsecondary | ... | ... | Note ...: not applicable | 1.9Note * | 1.2 | 2.9 | ... | ... | Note ...: not applicable | 1.9Note * | 1.4 | 2.6 |
| Chronic conditionsTable 4 Note ‡ | ||||||||||||
| Any | ... | ... | Note ...: not applicable | 1.7Note * | 1.1 | 2.6 | ... | ... | Note ...: not applicable | 1.3 | 0.9 | 1.8 |
| NoneTable 4 Note †† | ... | ... | Note ...: not applicable | 1.0 | ... | Note ...: not applicable | ... | ... | Note ...: not applicable | 1.0 | ... | Note ...: not applicable |
| Self-perceived stress | ||||||||||||
| High | ... | ... | Note ...: not applicable | 1.0 | 0.6 | 1.5 | ... | ... | Note ...: not applicable | 0.9 | 0.6 | 1.4 |
| Medium | ... | ... | Note ...: not applicable | 0.6 | 0.4 | 1.0 | ... | ... | Note ...: not applicable | 1.0 | 0.7 | 1.4 |
| LowTable 4 Note †† | ... | ... | Note ...: not applicable | 1.0 | ... | Note ...: not applicable | ... | ... | Note ...: not applicable | 1.0 | ... | Note ...: not applicable |
| Body mass index | ... | ... | Note ...: not applicable | 0.91 | 0.76 | 1.09 | ... | ... | Note ...: not applicable | 0.93 | 0.81 | 1.07 |
| Exposure to smoke | ||||||||||||
| Yes | ... | ... | Note ...: not applicable | 1.0 | 0.7 | 1.4 | ... | ... | Note ...: not applicable | 1.2 | 0.9 | 1.5 |
| NoTable 4 Note †† | ... | ... | Note ...: not applicable | 1.0 | ... | Note ...: not applicable | ... | ... | Note ...: not applicable | 1.0 | ... | Note ...: not applicable |
| Exposure to noise | ||||||||||||
| Time worked in a noisy environment | ||||||||||||
| NeverTable 4 Note †† | ... | ... | Note ...: not applicable | 1.0 | ... | Note ...: not applicable | ... | ... | Note ...: not applicable | 1.0 | ... | Note ...: not applicable |
| Less than 10 years | ... | ... | Note ...: not applicable | 1.1 | 0.7 | 1.7 | ... | ... | Note ...: not applicable | 1.0 | 0.7 | 1.6 |
| 10 years or more | ... | ... | Note ...: not applicable | 0.9 | 0.6 | 1.5 | ... | ... | Note ...: not applicable | 1.8 | 1.0 | 3.3 |
| Number of exposures to sources of loud | ||||||||||||
| noise at work, at school or during leisure time | ... | ... | Note ...: not applicable | 1.14Note * | 1.00 | 1.30 | ... | ... | Note ...: not applicable | 1.18Note * | 1.05 | 1.33 |
... not applicable
Source: 2012 to 2013 and 2014 to 2015 Canadian Health Measures Surveys, combined. |
||||||||||||
A sensitivity analysis was conducted to investigate whether hearing loss or tinnitus was driving the associations between hypertension and hearing health problems (Table 5). Separate models were examined for the following three mutually exclusive populations: those with (a) hearing loss only, (b) tinnitus only, or (c) both conditions. In each model, the affected group was compared with those who had optimal hearing, i.e., the population without any hearing loss or tinnitus. Hypertension was significantly associated with hearing loss for females (AOR=1.7). The AORs for hypertension were positive in all other sensitivity analysis models, although they did not reach statistical significance. This suggests that the significant associations found in this study could be the result of the increased statistical power of a combined measure of hearing health problems.
| Hearing health outcome | Males | Females | ||||||||
|---|---|---|---|---|---|---|---|---|---|---|
| Observations in model | Observations with condition | Odds ratio | 95% confidence interval | Observations in model | Observations with condition | Odds ratio | 95% confidence interval | |||
| from | to | from | to | |||||||
| Hearing loss only | 1,786 | 803 | 1.3 | 0.8 | 2.2 | 1,883 | 598 | 1.7Note * | 1.0 | 2.7 |
| Tinnitus only | 1,536 | 553 | 1.8 | 0.7 | 4.3 | 1,875 | 590 | 1.2 | 0.6 | 2.3 |
| Both hearing loss and tinnitus | 1,495 | 512 | 1.2 | 0.7 | 1.9 | 1,664 | 379 | 1.4 | 0.9 | 2.2 |
| Hearing loss or tinnitus | 2,874 | 1,891 | 1.7Note * | 1.1 | 2.4 | 2,869 | 1,584 | 1.6Note * | 1.1 | 2.3 |
Source: 2012 to 2013 and 2014 to 2015 Canadian Health Measures Surveys, combined. |
||||||||||
Discussion
This study examined associations between hypertension and hearing health problems among Canadian adults. The co-occurrence of hearing loss and tinnitus presents a challenge when examining the association of hypertension with one or the other outcome. An alternative approach, which was used in this study, defines the outcome more broadly as “hearing health problems”—that is, the presence of hearing loss or tinnitus or both conditions, distinct from “optimal hearing health,” where neither condition is present. To the authors’ knowledge, this is the first study to examine associations between hypertension and combined hearing health problems—an approach that combines outcomes that share some causal pathways and provides greater statistical power in the models.
Based on nationally representative data from the CHMS, an estimated 22% of the adult population had hypertension and 60% experienced hearing health problems. Preliminary models demonstrated that there was an association between hypertension and hearing health problems over and above the impact of age. In fully adjusted models, males and females with hypertension had a 60% to 70% higher risk than the non-hypertensive population of experiencing hearing health problems, even after age and other threats to hearing health were taken into account. In addition to the potential damage that hypertension has on hearing health, the drugs used to control hypertension may be ototoxicNote 9Note 10Note 20Note 32 As with earlier studies, measured high blood pressure and the current use of anti-hypertensive medications were used to define those with hypertension in this study.Note 12Note 21Note 33 Consequently, associations of hypertension with hearing health problems may reflect the condition itself or the medications used to treat hypertension. An added complication is that individuals with uncontrolled hypertension are exposed to both high blood pressure and anti-hypertensive medication. Among Canadians aged 20 to 79 years with hypertension, the condition was not controlled for approximately one-third of individuals,Note 12 and there is evidence that the percentage with uncontrolled hypertension is higher at older ages, especially among females.Note 33 Nevertheless, research on the impact of anti-hypertensive drugs on hearing health is inconclusive. For example, a prospective study that examined the relationship between hypertension and hearing loss among females found an association between hypertension and hearing loss, but no difference between those who were using anti-hypertensive medication and those who were not.Note 19
Comorbid conditions may have an adverse impact on hearing healthNote 34Note 35Note 36Note 37Note 38Note 39 and may also be associated with hypertension. Medications used to treat comorbid conditions may also pose a threat to hearing health. The list of ototoxic medications is extensive, ranging from those available over the counter to powerful prescription medications.Note 40Note 41 Some examples are acetylsalicylic acid (ASA), which may be used to prevent cardiovascular events; the cancer drug cisplatin; and aminoglycosides, which are a group of systemic antibacterials used to treat severe infections.Note 39Note 42Note 43Note 44Note 45
Researchers have addressed the complexity of relationships between hypertension, hearing health and medications in various ways. For example, in their study “Hypertension, diuretic use, and risk of hearing loss,” Lin et al.Note 19 excluded participants with a history of non-melanoma skin cancer to eliminate possible confounding by ototoxic medications used in chemotherapy. In a study of diabetes and hearing impairment, Bainbridge et al.Note 46 controlled for selected ototoxic medication use in the past 30 days. They found no association between medication use and hearing loss, although they acknowledge that the absence of information about use prior to the past 30 days is a limitation. By controlling for current or past cancer, diabetes, cardiovascular disease, kidney disease, and arthritis diagnoses, the current study indirectly took the history of many potentially ototoxic medications into account.
The multivariate analysis revealed that the number of sources of loud noise was significantly associated with hearing health problems, over and above the effects of hypertension and other factors. In addition to comorbid conditions and associated medications, noise may act in tandem with hypertension to accelerate hearing health problems.Note 47 In a study of occupational noise and hypertension, Wang et al.Note 48 concluded that workers with hypertension experienced greater hearing loss than non-hypertensive workers with the same noise exposure. Multiple pathways may be involved, such as noise exposure contributing directly to hearing loss and indirectly by contributing to high blood pressure.Note 49 Sources of loud noise may involve tools and machinery that not only are loud, but also vibrate. There is evidence that vibration increases the likelihood of noise-induced hearing loss, especially among those with circulatory problems.Note 42
Both hearing loss and hypertension are conditions that can go undetected. A previous study found that among 8.2 million middle-aged or older Canadians with measured high-frequency hearing loss, a high proportion (77%) did not perceive any loss of hearing.Note 22 Screening individuals with hypertension for hearing loss may help with early detection and management of the condition. Likewise, screening those with hearing loss or tinnitus for hypertension may help identify and treat those who were unaware of their high blood pressure. This may be especially important for younger adults, who are more likely to be unaware that they have hypertension, to be receiving treatment or to have their hypertension under control.Note 12
Strengths and limitations
A strength of this study is the large sample representative of the Canadian population. The CHMS includes objectively measured data for hearing acuity. Blood pressure was measured objectively using an automated device with high quality control. Furthermore, detailed hypertension medication information was recorded from respondents’ containers, thereby reducing recall bias. In addition to self-reported data on tinnitus, the CHMS includes data on potential confounding variables, such as other chronic conditions, noise exposure, and exposure to smoke either directly as a smoker or via second-hand smoke.
It is not possible to establish temporal order between hypertension, hearing loss and tinnitus, or the duration or age of onset of these conditions from the cross-sectional CHMS data. A blood pressure reading at one point in time fails to identify people with fluctuating blood pressure, which may be a risk factor for hearing loss.Note 50 Past use of potentially ototoxic medications is not known, although comorbid conditions may be proxy measures for medication use. Canadians older than 79 years and individuals residing in institutions such as long-term care facilities are not included in the CHMS, excluding a sector of the population that is more likely to have hearing loss, have chronic conditions and require medications. The response rate for the combined CHMS cycles is 52.7%. The survey weights take non-response into account to reduce bias so that the study sample is representative of the population.
Conclusion
Hearing loss and tinnitus can be disabling, and, therefore, the identification of potential modifiable risk factors is an important public health issue. Results from this study support the integration of audiology and chronic disease management.Note 7Note 39Note 51Note 52 A better understanding of the relationship between hypertension and hearing health problems has important clinical implications for hearing loss prevention, such as early referral of patients with hypertension to audiologists for assessment and intervention (e.g., hearing aids or tinnitus retraining therapy). Conversely, audiologists could provide point-of-entry care by referring individuals who present with hearing health problems to have their blood pressure and other conditions assessed.Note 51Note 52 Future researchcould investigate how the early detection and management of hypertension and hearing health problems have the potential to prevent further morbidity and improve quality of life.
Appendix
| C—cardiovascular system | Description |
|---|---|
| C02 | Antihypertensives Excluding: C02KX01 bosetan |
| C03 | Diuretics Excluding: C03BA08 metolazone C03CA01 furosemide |
| C07 | Beta blocking agents Excluding: C07AA07 sotalol C07AA12 nadolol C07AG02 carvedilol |
| C08 | Calcium channel blockers |
| C09 | Agents acting on the renin-angiotensin system |
| Source: http://www.whocc.no/atc_ddd_index/. | |
- Date modified: