
Education Indicators in Canada: An International Perspective, 2020
Chapter A
The output of educational institutions and the impact of learning

Archived Content
Information identified as archived is provided for reference, research or recordkeeping purposes. It is not subject to the Government of Canada Web Standards and has not been altered or updated since it was archived. Please "contact us" to request a format other than those available.
October 20, 2022: Since the original publication date, the methodology for calculating extended-time high school graduation rates has been updated. Please refer to table 37-10-0221 for the revised data.
A1 Educational attainment of the adult population
Context
This indicator provides a profile of the educational attainment of the adult population aged 25 to 64; that is, the percentage of that population that has successfully completed a certain level of education. For this international indicator, educational attainment reflects the highest level of education completed, based on the International Standard Classification of Education (ISCED) categories.Note As all subsequent indicators are examined by educational attainment within this international structure, this opening indicator, A1, sets the stage with an overview of the situation in Canada, including a breakdown of attainment by sex to reveal any gender differences. Information on generational differences reflects the shifts in educational attainment over time. Overall trends are also presented. This portrait of educational attainment places Canada and its provinces and territories in an international context.
Education helps give individuals the tools they need to participate in social and economic life and is key to the social and economic well-being of a country. As a large number of people in the 25-to-64 age range will have completed their formal education, this indicator provides some information on the skills and knowledge of this segment of the population, the core segment active in the labour market. Overall, the educational attainment of all individuals in the working-age population influences the competitiveness of economies and the prosperity of societies. Variations in attainment over time reflect differences in access to education, and indicate the evolution of knowledge available in the working-age population.
The distribution of educational attainment across Canada should not be considered an exact reflection of any educational system’s output because many other factors come into play; for example, differences in labour market and economic situations, in the relative magnitude of international and inter-jurisdictional migrations, and the overall mobility of students and workers.
Observations
Data table for Chart A.1.1
| Below upper secondary | Upper secondary education | Post-secondary non-tertiary | Short-cycle tertiary | Bachelor's or equivalent | Master's, Doctoral or equivalent | |
|---|---|---|---|---|---|---|
| percent | ||||||
| DEU | 13 | 44 | 13 | 1 | 16 | 13 |
| FRA | 20 | 42 | 0 | 15 | 11 | 13 |
| GBR | 20 | 21 | Note ..: not available for a specific reference period | 10 | 24 | 13 |
| ITA | 38 | 42 | 1 | 0 | 5 | 15 |
| JPN | Note ..: not available for a specific reference period | 47 | Note ..: not available for a specific reference period | 21 | 31 | Note ..: not available for a specific reference period |
| USA | 9 | 42 | Note ..: not available for a specific reference period | 11 | 24 | 14 |
| OECD | 21 | 37 | 6 | 7 | 18 | 14 |
| CAN | 8 | 22 | 10 | 26 | 22 | 11 |
| N.L. | 11 | 21 | 17 | 30 | 14 | 7 |
| P.E.I. | 11 | 25 | 9 | 29 | 19 | 8 |
| N.S. | 9 | 23 | 12 | 25 | 18 | 12 |
| N.B. | 12 | 27 | 8 | 30 | 17 | 7 |
| Que. | 10 | 17 | 18 | 25 | 20 | 10 |
| Ont. | 7 | 23 | 5 | 29 | 25 | 12 |
| Man. | 10 | 27 | 7 | 25 | 21 | 8 |
| Sask. | 9 | 29 | 16 | 19 | 19 | 7 |
| Alta. | 8 | 23 | 13 | 24 | 23 | 9 |
| B.C. | 6 | 24 | 11 | 24 | 24 | 11 |
| Y.T. | Note ..: not available for a specific reference period | 24 | 14 | 21 | 21 | 12 |
| N.W.T. | 18 | 24 | 12 | 24 | 17 | 7 |
| Nvt. | 40 | 16 | 8 | 21 | 10 | 6 |
|
.. not available for a specific reference period Note: The bars representing Canada and the OECD are filled with a diagonal line pattern to make them easier to find. Totals may not add up to 100% due to missing, suppressed or rounded data. Sources: Table A.1.1 and Education at a Glance 2020: OECD indicators. |
||||||
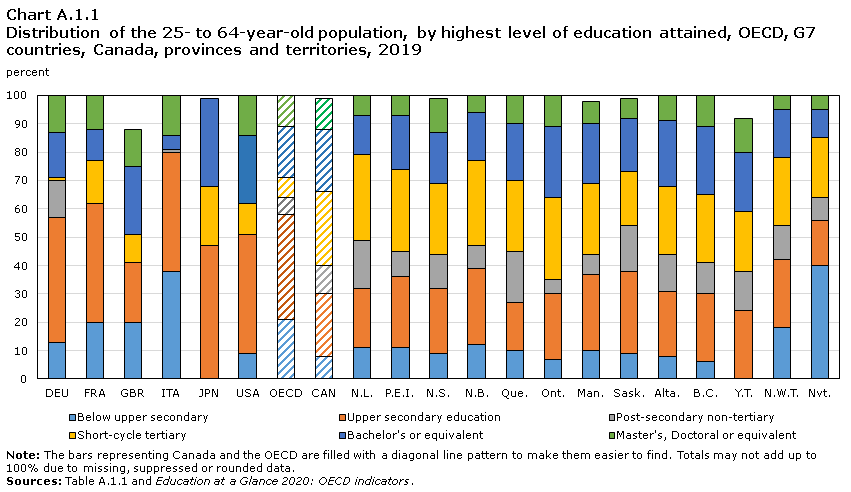
- Almost six out of ten Canadians (59%) aged 25 to 64 had attained a tertiary level (college and university) education in 2019. Canada had the highest proportion of its population with a tertiary level of education among the G7 countries, with other countries ranging from 20% in Italy to 52% in Japan.
- Within Canada, the proportion of the population with a tertiary education ranged from 37% in NunavutNote to 66% in Ontario.
- A larger proportion of Canadians (26%) had attained a college qualification in comparison to the OECD of 7%. Among G7 countries, Canada had the highest proportion of its population with short-cycle tertiary education (college), with other countries ranging from 0% in Italy to 21% in Japan.
- The proportion of Canadians with university as the highest educational qualification was comparable for Canada (33%) and the OECD average (32%).
- Ten percent of Canadians had attained a “postsecondary non-tertiary education” versus six percent for the OECD. This level of education includes certificates or diplomas from vocational schools or apprenticeship training.Note Among G7 countries, this is not a common level of attainment – only Germany had a substantial proportion of the population (13%) who had postsecondary non-tertiary education as their highest level of attainment.
- Eight percent of Canadians have not completed high school (“upper secondary”). Among G7 countries, Canada is comparable to the United States at 9% but significantly lower than Italy (38%), France and the United Kingdom (both at 20%).
Gender differences, G7 countries and OECD

Data table for Chart A.1.2
| Men (Canada) | Women (Canada) | Men (OECD) | Women (OECD) | |
|---|---|---|---|---|
| percent | ||||
| Below upper secondary | 9 | 7 | 22 | 21 |
| Upper secondary | 23 | 21 | 39 | 34 |
| Postsecondary non-tertiary |
14 | 7 | 6 | 5 |
| Short-cycle tertiary |
23 | 29 | 7 | 8 |
| Bachelor's or equivalent | 20 | 25 | 16 | 20 |
| Master's, Doctoral or equivalent | 10 | 11 | 13 | 16 |
| Sources: Table A.1.1. and Education at a Glance 2020: OECD indicators. | ||||
- In Canada, there were more men (9%) that had less than high school (upper secondary) as their highest level of education than women (7%). These proportions were much higher at the OECD average, where 22% of men and 21% of women had less than a high school diploma in 2019.
- In Canada, at the post-secondary non-tertiary level, which captures the traditionally male-dominated areas of trades, the proportion of men who had this level of education as their highest (14%) was double that of women (7%). This was not the case among the OECD countries, where the proportion of men and women reported having post-secondary non-tertiary as their highest level of educational attainment were similar (6% for men and 5% for women).
- In Canada, a larger proportion of women reported having college or university as their highest level of educational attainment, with the gap similar in college (29% for women versus 23% for men) and university (36% for women versus 30% for men). For the OECD averages, women also outnumbered men with more women attaining a college diploma (8% of women versus 7% of men) or university degree (36% women versus 29% of men) than men in 2019.
Tertiary attainment

Data table for Chart A.1.3
| Bachelor's, Master's or Doctoral or equivalent | Short-cycle tertiary | Total tertiary | |
|---|---|---|---|
| percent | |||
| DEU | 29 | 1 | 30 |
| FRA | 23 | 15 | 38 |
| GBR | 37 | 10 | 47 |
| ITA | 20 | 0 | 20 |
| JPN | 31 | 21 | 53 |
| USA | 38 | 11 | 48 |
| OECD | 32 | 7 | 38 |
| CAN | 33 | 26 | 59 |
| N.L. | 21 | 30 | 51 |
| P.E.I. | 27 | 29 | 56 |
| N.S. | 30 | 25 | 55 |
| N.B. | 24 | 30 | 54 |
| Que. | 30 | 25 | 55 |
| Ont. | 37 | 29 | 66 |
| Man. | 29 | 25 | 55 |
| Sask. | 26 | 19 | 46 |
| Alta. | 32 | 24 | 56 |
| B.C. | 35 | 24 | 59 |
| Y.T. | 33 | 21 | 54 |
| N.W.T. | 24 | 24 | 47 |
| Nvt. | 16 | 21 | 36 |
|
Note: The bars representing Canada and the OECD are filled with a diagonal line pattern to make them easier to find. Due to rounding, totals may not match the sum of the individual values. Sources: Table A.1.1, Table A.1.3. and Education at a Glance 2020: OECD indicators. |
|||
- Among OECD countries, 7% of 25- to 64-year-olds, on average, had completed college programs in 2019, far fewer than the 26% reported for Canada. This number reflects Canada’s well-developed college sector.
- The corresponding OECD and Canada average for university (Bachelor’s, Master’s, Doctoral or equivalent) was similar (32% for OECD and 33% for Canada)
- Within Canada, university attainment ranged from 16% in Nunavut to 37% in Ontario. For college, the numbers range from 19% in Saskatchewan to 30% in New Brunswick and Newfoundland and Labrador.
- Canada leads the G7 countries with the highest proportion of its population having attained tertiary education at 59% followed by Japan (53%) and the United States (48%). The comparable OECD average was 38%.
Generational differences in tertiary attainment
Data table for Chart A.1.4.1
| Total population | 25-34 | 35-44 | 45-54 | 55-64 | |
|---|---|---|---|---|---|
| percent | |||||
| DEU | 30 | 33 | 33 | 28 | 27 |
| FRA | 38 | 48 | 46 | 34 | 24 |
| GBR | 47 | 52 | 54 | 44 | 39 |
| ITA | 20 | 28 | 24 | 17 | 13 |
| JPN | 53 | 62 | 58 | 49 | 44 |
| USA | 48 | 50 | 51 | 48 | 43 |
| OECD | 38 | 45 | 44 | 35 | 28 |
| CAN | 59 | 63 | 65 | 60 | 50 |
| N.L. | 51 | 58 | 61 | 51 | 39 |
| P.E.I. | 56 | 59 | 63 | 60 | 44 |
| N.S. | 55 | 61 | 63 | 56 | 44 |
| N.B. | 54 | 60 | 64 | 55 | 40 |
| Que. | 55 | 58 | 61 | 56 | 45 |
| Ont. | 66 | 70 | 70 | 67 | 56 |
| Man. | 55 | 55 | 61 | 55 | 47 |
| Sask. | 46 | 47 | 52 | 45 | 38 |
| Alta. | 56 | 57 | 60 | 55 | 48 |
| B.C. | 59 | 61 | 63 | 60 | 51 |
| Y.T. | 54 | 51 | 58 | 56 | 52 |
| N.W.T. | 47 | 44 | 51 | 46 | 48 |
| Nvt. | 36 | 31 | 39 | 33 | 46 |
|
Note: The bars representing Canada and the OECD are filled with a diagonal line pattern to make them easier to find. Sources: Table A.1.3. and Education at a Glance 2020: OECD indicators. |
|||||
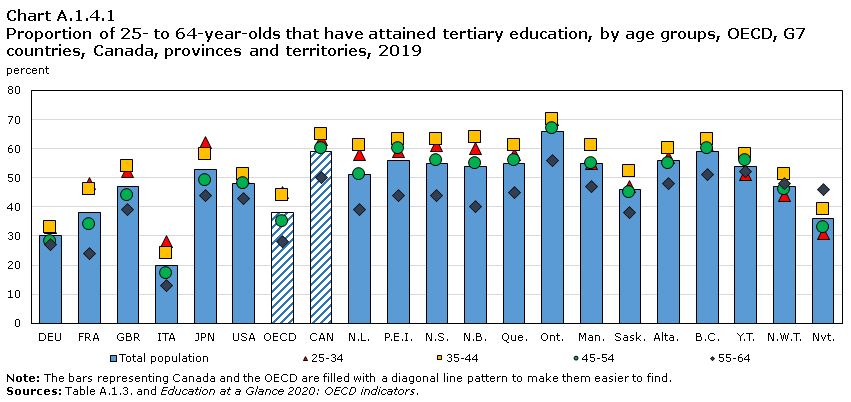
- Compared to all G7 countries and the OECD average, Canada had the highest proportion of people with tertiary education for all age groups.
- The proportion of Canadians with tertiary education was highest for 35-44 year olds (65%). This trend was observed in the majority of provinces and territories.
- Ontario had the highest proportion of its population aged 25 to 64 with tertiary education (66%).
Data table for Chart A.1.4.2
| Total population | Men | Women | |
|---|---|---|---|
| percent | |||
| DEU | 30 | 32 | 27 |
| FRA | 38 | 35 | 41 |
| GBR | 47 | 45 | 49 |
| ITA | 20 | 17 | 22 |
| JPN | 53 | 51 | 54 |
| USA | 48 | 45 | 52 |
| OECD | 38 | 35 | 41 |
| CAN | 59 | 53 | 66 |
| N.L. | 51 | 43 | 59 |
| P.E.I. | 56 | 47 | 64 |
| N.S. | 55 | 47 | 63 |
| N.B. | 54 | 48 | 59 |
| Que. | 55 | 49 | 60 |
| Ont. | 66 | 61 | 70 |
| Man. | 55 | 48 | 61 |
| Sask. | 46 | 35 | 56 |
| Alta. | 56 | 47 | 65 |
| B.C. | 59 | 52 | 66 |
| Y.T. | 54 | 43 | 66 |
| N.W.T. | 47 | 36 | 58 |
| Nvt. | 36 | 31 | 41 |
|
Note: The bars representing Canada and the OECD are filled with a diagonal line pattern to make them easier to find. Sources: Table A.1.3. and Education at a Glance 2020: OECD indicators. |
|||
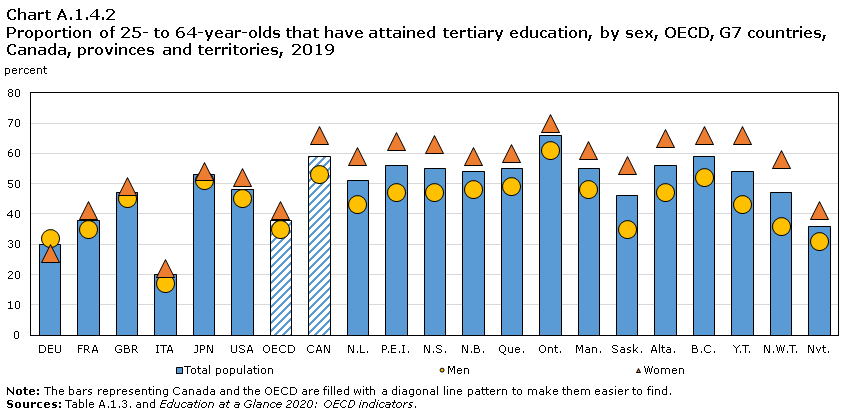
- In all Canadian provinces and territories, a higher proportion of women than men had completed tertiary education. The largest gender differences were observed in Yukon (23 percentage points), Northwest Territories (22 percentage points) and Saskatchewan (21 percentage points). This gender difference was smaller in OECD countries than in Canada (6 percentage points versus 13 percentage points).
- Ontario (9 percentage points) and Nunavut (10 percentage points) had the lowest gaps between men and women aged 25 to 64 with tertiary education.

Data table for Chart A.1.5
| Total population | Men | Women | |
|---|---|---|---|
| percent | |||
| DEU | 13 | 9 | 16 |
| FRA | 0 | 0 | 0 |
| ITA | 1 | 1 | 1 |
| OECD | 6 | 6 | 5 |
| CAN | 10 | 14 | 7 |
| N.L. | 17 | 24 | 10 |
| P.E.I. | 9 | 11 | 6 |
| N.S. | 12 | 17 | 8 |
| N.B. | 8 | 10 | 5 |
| Que. | 18 | 21 | 15 |
| Ont. | 5 | 7 | 3 |
| Man. | 7 | 11 | 4 |
| Sask. | 16 | 22 | 10 |
| Alta. | 13 | 20 | 6 |
| B.C. | 11 | 17 | 5 |
| Y.T. | 14 | 22 | 7 |
| N.W.T. | 12 | 19 | 4 |
| Nvt. | 8 | 12 | 4 |
|
Note: The bars representing Canada and the OECD are filled with a diagonal line pattern to make them easier to find. Data are unvailable for the United Kingdom, The United States and Japan. Sources: Table A.1.1. and Education at a Glance 2020: OECD Indicators. |
|||
- Among the jurisdictions, a higher proportion of men have attained post-secondary non-tertiary education as their highest level of educational attainment than women. In Germany, women were more likely to have completed non-tertiary post-secondary education at 16% compared to 9% for men. At the OECD average, the proportion of people who have attained post-secondary non-tertiary was 6% for men versus 5% for women.
- Among the jurisdictions, various gender differences emerge at the post-secondary non-tertiary level, ranging from 4 percentage points in Ontario to 15 percentage points in Yukon and Northwest Territories.
- Quebec had the highest proportion of women (15%) reporting post-secondary non-tertiary as their highest level of education followed by Saskatchewan and Newfoundland and Labrador (10% each).
- Ontario (3%), Manitoba, Nunavut and Northwest Territories had the lowest proportion (4% each) of women that have attained post-secondary non-tertiary as their highest level of education.
- The largest proportion of men reporting post-secondary non-tertiary as their highest level of education was found in Newfoundland and Labrador at 24%, followed by Saskatchewan, Yukon (22% each), and Quebec (21%).
Definitions, sources and methodology
This indicator examines educational attainment among Canada’s adult population aged 25 to 64, by age group and sex. It presents a portrait of the situation in 2019, but also shows the evolution since 2005.
The percentage of the population represented by a given age group that has attained a particular education level is obtained by taking the number of persons in this age group who have received a diploma attesting to that level, dividing it by the total number of persons in this same age group, and then multiplying by 100.
The education level corresponds to the highest level of education an individual has attained. The designation of the different levels of schooling is based on the International Standard Classification of Education (ISCED-2011) (see the “ISCED classifications and descriptions” and the “Mapping to ISCED” section for the Labour Force Survey [LFS] in Notes to readers). An individual must have successfully completed a programme at a given ISCED level to be considered as having attained that level of education. An individual who has not successfully completed a programme is assigned the preceding education level. For example, a secondary school graduate, as well as an individual who has undertaken some postsecondary education but who has not obtained a credential at that level, is considered to have attained ISCED level 3 (upper secondary education); a student who has not successfully completed secondary school is considered to have obtained ISCED level 2 (lower secondary education).
The information presented for Canada on population and educational attainment is based on data from the LFS, which surveys approximately 56,000 households every month.Note The LFS seeks to obtain a detailed and timely picture of the population aged 15 or older throughout the country. It allows proxy reporting, meaning that information on the entire household can be collected from a single member of the household. In all, this type of reporting accounts for approximately 65% of all information collected. Figures from the Organisation for Economic Co-operation and Development (OECD) are those reported by the OECD, and are drawn from OECD and Eurostat databases, as compiled from national labour force surveys or population registers.
Some limitations are encountered when using LFS data to examine and categorize educational attainment using ISCED as it is not possible to make a precise delineation between “postsecondary non-tertiary education” and “short-cycle tertiary education”. LFS data reported for the Canadian population that has attained ISCED level 5 (short-cycle tertiary education) will be somewhat overestimated because this category includes, for example, some CEGEP or college university transfer program graduates who, under the international classification standards, would have been placed in ISCED level 4 (Post-secondary non-tertiary education).
In Statistics Canada’s LFS the Master’s or equivalent and Doctors or equivalent levels cannot be identified as separate levels of educational attainment in the ISCED 8; therefore, educational attainment in the ISCED 7 and 8 (Master’s or equivalent and Doctoral or equivalent) categories are combined.
Note: The corresponding OECD indicator is A1, To what level have adults studied?
A2 On-time and extended-time high-school graduation rate
Context
High school graduation is an important milestone for students, providing them with a foundation for postsecondary education, as well as broader social and economic benefits for society. Graduation from high school is widely considered the minimum requirement for successful entry into the labour market.
Since 2018, a true-cohort methodology has been used to calculate on-time and extended-time high-school graduation rates. This pan-Canadian methodology has been developed with provinces and territories to respond to their needs while also improving Canada’s international reporting to the OECD. The 2019 data collection aligns with the OECD true-cohort reporting cycle which allows for international comparisons for on-time and extended-time graduation rates.
For this indicator, on-time high-school graduation rates are calculated by tracking students who started Grade 10 (Secondary 3 in Quebec) in 2015/2016 and graduated from Grade 12 (Secondary 5) by the end of the 2017/2018 school year. On-time high-school graduation rates are also provided for 2015/2016 by tracking the group of students who started Grade 10 (Secondary 3) in 2013/2014. This 2013/2014 Grade 10 (Secondary 3) group is tracked to determine the extended-time high-school graduation rates for 2017/2018, which is the percentage of the group that graduated high school within five years of starting Grade 10 (Secondary 3). Comparisons of high school graduation rates between provinces and territories require a nuanced interpretation as academic pathways, pass marks, subject requirements and the groups of students under consideration may differ from one province or territory to another.
Observations
A.2.1 Trends in on-time and extended-time high-school graduation rates

Data table for Chart A.2.1.1
| Province / TerritoryData table Note 1 | 2015-16 | 2016-17 | 2017-18 |
|---|---|---|---|
| percent | |||
| CANData table Note 2 | 79 | 80 | 81 |
| N.L. | 87 | 88 | 89 |
| N.S. | 86 | Note ..: not available for a specific reference period | 88 |
| P.E.I. | 83 | 86 | 87 |
| N.B. | 86 | 85 | 87 |
| Que. | 74 | 75 | 75 |
| Ont. | 81 | 82 | 82 |
| Man. | 82 | 82 | 83 |
| Sask. | 77 | 79 | 79 |
| Alta. | 79 | 79 | 80 |
| B.C. | 80 | 81 | 81 |
| N.W.T. | 54 | 54 | 52 |
.. not available for a specific reference period
|
|||
- In 2015/2016, 79% of students in Canada completed their high-school studies within a three-year period after starting Grade 10 (Secondary 3). This rate increased by 2 percentage points to 81% by 2017/2018.
- Across provinces and territories, the largest increases between the on-time high-school graduation rates from 2015/2016 to 2017/2018 were in Prince Edward Island with a difference of 4 percentage points, followed by Newfoundland and Labrador, Nova Scotia, and Saskatchewan with a difference of 2 percentage points. The other provinces showed smaller increases over this three-year cycle. On-time high-school graduation rates only decreased in one jurisdiction with available data: Northwest Territories (-2 percentage points).

Data table for Chart A.2.1.2
| Province / TerritoryData table Note 1 | 2015-16 | 2016-17 | 2017-18 |
|---|---|---|---|
| percent | |||
| CANData table Note 2 | 88 | 89 | 89 |
| N.L. | 93 | 93 | 93 |
| P.E.I. | 94 | 90 | 89 |
| N.B. | 93 | 87 | 91 |
| Que. | 83 | 83 | 84 |
| Ont. | 92 | 93 | 92 |
| Man. | 89 | 89 | 90 |
| Sask. | 87 | 87 | 86 |
| Alta. | 83 | 86 | 88 |
| B.C. | 89 | 88 | 89 |
|
|||
- In Canada, the extended-time high-school graduation rate was 88% in 2015/2016, and increased by 1 percentage point to 89% in 2017/2018.
- The trends at the provincial level are more varied than for on-time graduation rates. Alberta saw the largest increase of 5 percentage points between 2015/2016 and 2017/2018 in their extended-time graduation rate. Other provinces, notably Prince Edward Island and New Brunswick, experienced decreases of 5 and 2 percentage points, respectively, in their extended-time high-school graduation rates between 2015/2016 and 2017/2018.
- In other provinces, the extended-time high-school graduation rates remained relatively stable between 2015/2016 and 2017/2018, including in British Columbia (no change), Saskatchewan (-1 percentage point), Manitoba (+1 percentage point), and Quebec (+1 percentage point).Newfoundland and Labrador and Ontario had the highest extended-time graduation rates in the country, which remained stable at 93% over this time period.
A.2.2 From on-time to extended-time high-school graduation rates

Data table for Chart A.2.2.1
| Province / TerritoryData table Note 1 | On-time graduation rate (2015/2016) (%) | Difference (percentage points) between extended-time (2017/2018) and on-time graduation rate (2015/2016) |
|---|---|---|
| percent | ||
| CANData table Note 2 | 79 | 10 |
| N.L. | 87 | 6 |
| N.S. | 86 | 9 |
| P.E.I. | 83 | 6 |
| N.B. | 86 | 5 |
| Que. | 74 | 10 |
| Ont. | 81 | 11 |
| Man. | 82 | 8 |
| Sask. | 77 | 9 |
| Alta. | 79 | 9 |
| B.C. | 80 | 9 |
|
||
- On average across Canada, an additional two years to complete high school has a significant impact on graduation rates. The cohort of students starting Grade 10 (Secondary 3) in 2013/2014 demonstrated an increase of 10 percentage points in their extended-time high-school graduation rate (89%) compared to their on-time high-school graduation rate (79%).
- The additional proportion of students who graduated after the two-year extended period ranged from a 5 percentage point difference in New Brunswick to an 11 percentage point difference in Ontario.
A.2.3 The gender gap in on-time and extended-time high-school graduation rates
Data table for Chart A.2.3.1
| Country / Province / TerritoryData table Note 1 | Total gender | Male gender | Female gender |
|---|---|---|---|
| percent | |||
| OECD avg.Data table Note 2 | 76 | 72 | 79 |
| FinlandData table Note 3 | 81 | 81 | 81 |
| FranceData table Note 3 | 77 | 74 | 80 |
| Italy | 77 | 74 | 79 |
| USAData table Note 4 | 93 | 91 | 94 |
| CANData table Note 5 | 79 | 76 | 83 |
| N.L. | 87 | 86 | 89 |
| N.S. | 86 | 84 | 89 |
| P.E.I. | 83 | 79 | 87 |
| N.B. | 86 | 82 | 90 |
| Que.Data table Note 6 | 74 | 68 | 80 |
| Ont. | 81 | 77 | 85 |
| Man. | 82 | 79 | 85 |
| Sask. | 77 | 75 | 80 |
| Alta. | 79 | 77 | 81 |
| B.C. | 80 | 77 | 82 |
| N.W.T. | 54 | 50 | 59 |
|
|||
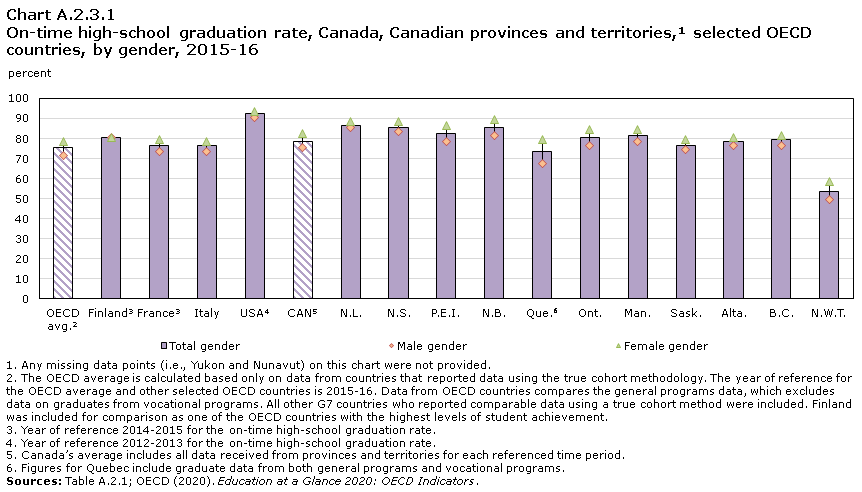
- In Canada, a higher proportion of females (83%) completed high-school on-time than males (76%) in 2015/2016. This trend was observed in all provinces and territories.
- The largest difference in the on-time high-school graduation rate between males and females was found in Quebec with a 12 percentage point difference, followed by Northwest Territories with a 9 percentage point difference. Newfoundland and Labrador and Alberta had much smaller discrepancies between female and male on-time graduation rates with 3 and 4 percentage point gender gaps respectively.
- While Canada’s overall on-time graduation rate (79%) was slightly higher than the OECD average (76%) for general programs, the gender gap for both was 7 percentage points in 2015/2016. Canada had an overall on-time graduation rate that was higher than comparable OECD countries such as France (77%) and Italy (77%) for general programs, however Canada had a lower rate than Finland (81%) and the USA (93%). Finland, France, Italy, and the USA all had smaller gender gaps than Canada, for general programs.
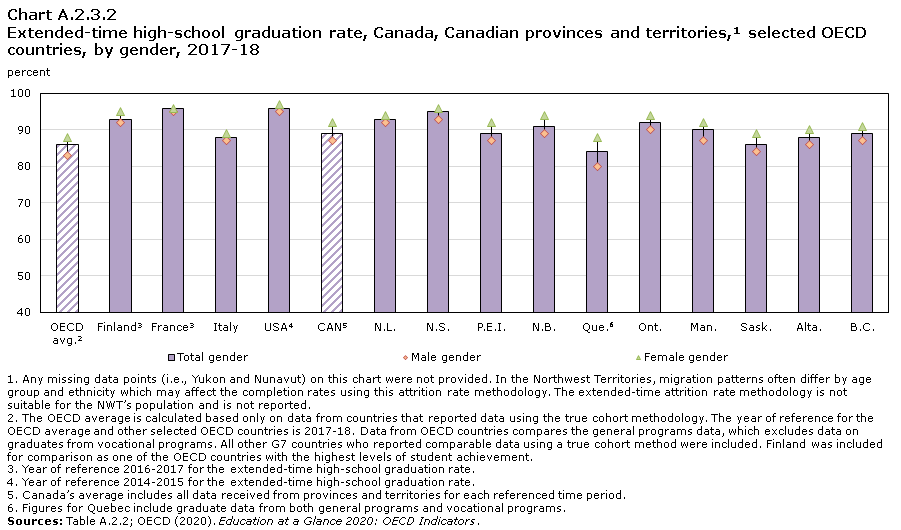
Data table for Chart A.2.3.2
| Country / Province / TerritoryData table Note 1 | Total gender | Male gender | Female gender |
|---|---|---|---|
| percent | |||
| OECD avg.Data table Note 2 | 86 | 83 | 88 |
| FinlandData table Note 3 | 93 | 92 | 95 |
| FranceData table Note 3 | 96 | 95 | 96 |
| Italy | 88 | 87 | 89 |
| USAData table Note 4 | 96 | 95 | 97 |
| CANData table Note 5 | 89 | 87 | 92 |
| N.L. | 93 | 92 | 94 |
| N.S. | 95 | 93 | 96 |
| P.E.I. | 89 | 87 | 92 |
| N.B. | 91 | 89 | 94 |
| Que.Data table Note 6 | 84 | 80 | 88 |
| Ont. | 92 | 90 | 94 |
| Man. | 90 | 87 | 92 |
| Sask. | 86 | 84 | 89 |
| Alta. | 88 | 86 | 90 |
| B.C. | 89 | 87 | 91 |
|
|||
- In Canada, a larger proportion of female students (92%) graduated after a two-year extended period than males (87%) in 2017/2018. The same trend was observed in all provinces and territories.
- The gender differences were more visible in Quebec where the female extended-time high-school graduation rate was approximately 8 percentage points above this rate for males. Newfoundland and Labrador and Nova Scotia had the smallest gender gaps at 2 and 3 percentage points, respectively.
- Canada had a higher extended-time graduation rate (89%) than the OECD average (86%) in 2017/2018. Nonetheless, Canada’s average extended-time graduation rate was lower than some other comparable OECD countries including Finland (93%), France (96%), and the USA (96%). These three countries, as well as Italy, also had smaller gender gaps than Canada.
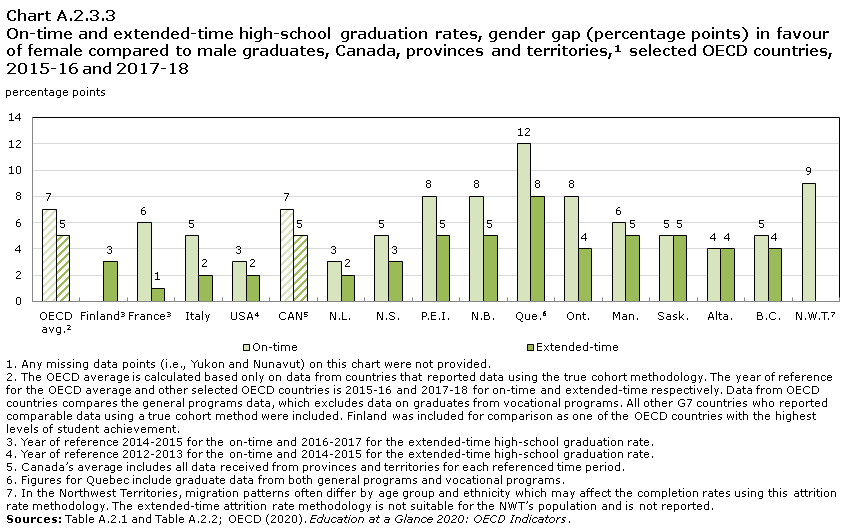
Data table for Chart A.2.3.3
| Country / Province / TerritoryData table Note 1 | On-time | Extended-time |
|---|---|---|
| percentage points | ||
| OECD avg.Data table Note 2 | 7 | 5 |
| FinlandData table Note 3 | 0 | 3 |
| FranceData table Note 3 | 6 | 1 |
| Italy | 5 | 2 |
| USAData table Note 4 | 3 | 2 |
| CANData table Note 5 | 7 | 5 |
| N.L. | 3 | 2 |
| N.S. | 5 | 3 |
| P.E.I. | 8 | 5 |
| N.B. | 8 | 5 |
| Que.Data table Note 6 | 12 | 8 |
| Ont. | 8 | 4 |
| Man. | 6 | 5 |
| Sask. | 5 | 5 |
| Alta. | 4 | 4 |
| B.C. | 5 | 4 |
| N.W.T.Data table Note 7 | 9 | Note ..: not available for a specific reference period |
.. not available for a specific reference period
|
||
- On average across Canada, female graduates graduation rates were higher than male graduation rates in 2015/2016 and 2017/2018. This gender gap decreased for the cohort entering Grade 10 (Secondary 3) in 2013/2014 by 2 percentage points between 2015/2016 (on-time graduation) and 2017/2018 (extended-time graduation). Quebec and Ontario each saw the largest declines, both by 4 percentage points. While the gap decreased in most provinces, Saskatchewan and Alberta showed no change in the gender gap between on-time and extended-time high-school graduation rates.
- The gender gap decrease between on-time and extended-time graduation rates in Canada mirrored the OECD average gender gap, which also decreased by 2 percentage points. France and Italy saw a larger decrease in their gender gap between on-time and extended-time graduation rates for general programs than Canada, with a 5 and 3 percentage point decrease, respectively.
Definitions, sources and methodology
This indicator presents the high-school graduation rate, using a true-cohort methodology for students in public and private schools.
The true-cohort methodology follows a cohort of students from Grade 10, or Secondary 3 in Quebec, to the end of their third year of high school, and then over a period of two additional years. Many students will graduate from Grade 12 (Secondary 5 in Quebec) after three years, but some students may take longer to complete their high school studies. Grade 10 / Secondary 3 is used as the starting point because this is the grade where students begin accumulating credits toward Grade 12 graduation in most provinces and territories. An adjustment is made to the graduation rate (using an attrition methodology) to account for students who can no longer be tracked toward graduation for the following reasons: moving out of the province or territory, moving to a band-operated school or an excluded private school, or becoming home-schooled. These students have not dropped out of school, but would no longer be tracked through to graduation.
Graduation credentials
One of the objectives of the high-school graduation rate data collection is to better understand differences in graduation credentials across provinces and territories and the prevalence of issuance of those credentials to inform comparability of the results at a pan-Canadian level. The following table (updated since last year’s PCEIP publication) shows the credentials that are included in the high-school graduation rate (i.e., Grade 12 or Secondary V).
| Province/Territory | High-school credential |
|---|---|
| British Columbia | British Columbia Certificate of Graduation ("Dogwood") British Columbia Adult Graduation Diploma ("Adult Dogwood") |
| Alberta | Alberta High School Diploma Certificate of High School Achievement High School Equivalency Diploma |
| Saskatchewan | "Regular" 24-credit policy "Adult 12" policy |
| Manitoba | ("Regular") High School Diploma Mature Student Diploma |
| Ontario | Ontario Secondary School Diploma (OSSD) Ontario Secondary School Diploma 2 (OSSD2) Secondary School Graduation Diploma (SSGD) Ontario Secondary School Diploma(OSSD)/Specialist High Skills Major (SHSM) |
| Quebec | DES - Diplôme d'études secondaires, secteur des jeunes DES - Diplôme d'études secondaires, secteur des adultes DEP - Diplôme d'études professionnelles, secteur de la formation professionnelle ASP - Attestation de spécialisation professionnelle AEP - Attestation d'études professionnelles CFMS - Certificat de formation à un métier semi-spécialisé, secteurs jeunes ou adultes CFPT - Certificat de formation préparatoire au travail |
| New Brunswick | New Brunswick High School Diploma |
| Nova Scotia | Nova Scotia High School Graduation Diploma |
| Prince Edward Island | Senior High School Graduation Certificate |
| Newfoundland and Labrador | High School Graduation Diploma |
| Yukon | Note ..: not available for a specific reference period |
| Northwest Territories | N.W.T. High School Diploma |
| Nunavut | Nunavut Secondary School Diploma |
| .. not available for a specific reference period | |
A3 International students
Context
This indicator presents international students as a proportion of enrolment in tertiary education in accordance with the four International Standard Classification of Education (ISCED) categories,Note which represent enrolments in colleges and universities.Note Their distribution by province of study and by region of origin are also presented.
Students choose to pursue their education abroad for many reasons. Some may do so because they wish to explore different cultures, societies and languages while improving their employment prospects. Growing recognition of the importance of tertiary education as a determinant of higher earnings and employability has led to a growing demand, one that educational institutions in some countries may find difficult to meet. At the same time, the globalization of markets has increased demand for workers with broader knowledge and competencies, with work increasingly performed by teams that span regions and countries.
Several factors may contribute to the choice of country for study. The language spoken and used in instruction, the quality of education offered, the tuition fees and cost of living, and the immigration policy of the destination country are all important factors. Other factors include recognition of foreign degrees, future job opportunities, and any geographical, trade and cultural links between countries.
International students are well received because they represent an additional source of revenue for the institutions they attend. They may also contribute to the viability of programs when the domestic student base is somewhat limited. In Canada, as in other countries that belong to the Organization for Economic Co-operation and Development (OECD), many institutions and governments are now actively marketing their educational programs to attract such students. In addition to the economic benefits they may provide, international and foreign students also add to the social and cultural dimensions of the communities in which they study. They may become future citizens, or they may become unofficial ambassadors when they return home.
Observations
International students in tertiary education
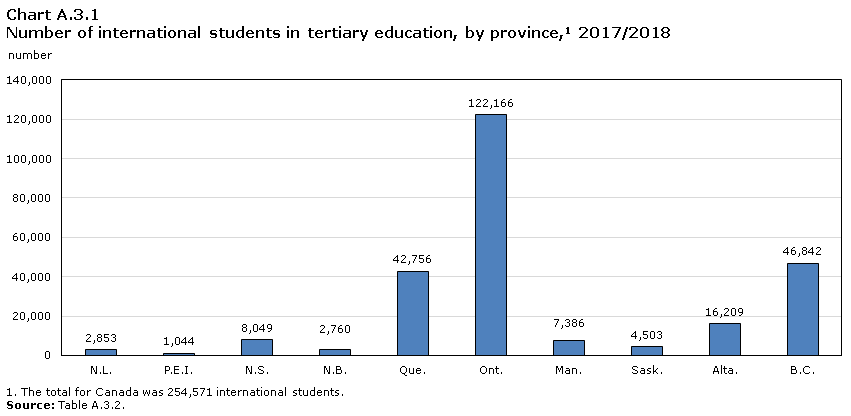
Data table for Chart A.3.1
| NumberData table Note 1 | |
|---|---|
| N.L. | 2,853 |
| P.E.I. | 1,044 |
| N.S. | 8,049 |
| N.B. | 2,760 |
| Que. | 42,756 |
| Ont. | 122,166 |
| Man. | 7,386 |
| Sask. | 4,503 |
| Alta. | 16,209 |
| B.C. | 46,842 |
|
|
- In 2017/2018, there were 254,571 international students studying in Canada. Ontario attracted the largest proportion of international students (48%), followed by British Columbia (18%) and Quebec (17%).
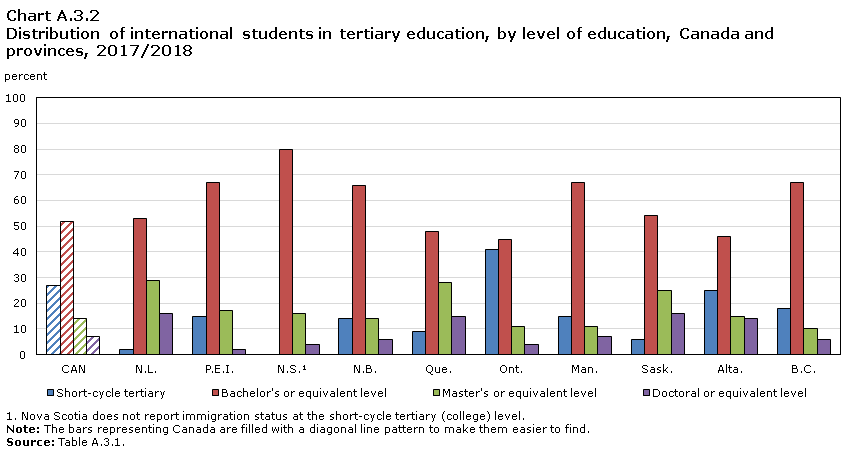
Data table for Chart A.3.2
| Short-cycle tertiary | Bachelor's or equivalent level | Master's or equivalent level | Doctoral or equivalent level | |
|---|---|---|---|---|
| percent | ||||
| CAN | 27 | 52 | 14 | 7 |
| N.L. | 2 | 53 | 29 | 16 |
| P.E.I. | 15 | 67 | 17 | 2 |
| N.S.Data table Note 1 | Note ..: not available for a specific reference period | 80 | 16 | 4 |
| N.B. | 14 | 66 | 14 | 6 |
| Que. | 9 | 48 | 28 | 15 |
| Ont. | 41 | 45 | 11 | 4 |
| Man. | 15 | 67 | 11 | 7 |
| Sask. | 6 | 54 | 25 | 16 |
| Alta. | 25 | 46 | 15 | 14 |
| B.C. | 18 | 67 | 10 | 6 |
.. not available for a specific reference period
Source: Table A.3.1. |
||||
- The majority of international students in tertiary education in Canada were registered in Bachelor’s or equivalent level programs. The highest proportion of students were concentrated at this level in every province.
- The proportion of international students registered at the short-cycle tertiary level (college) varied greatly by province; approaching half in Ontario (41%) to only 2% in Newfoundland and Labrador.
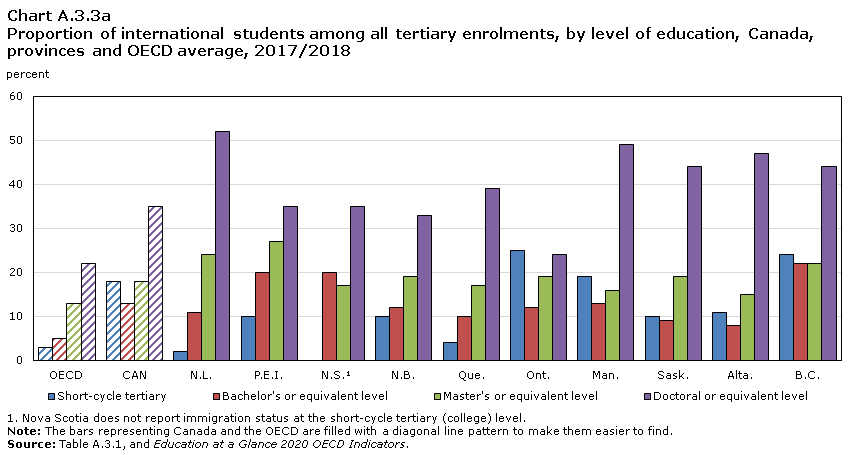
Data table for Chart A.3.3a
| Short-cycle tertiary | Bachelor's or equivalent level | Master's or equivalent level | Doctoral or equivalent level | |
|---|---|---|---|---|
| percent | ||||
| OECD | 3 | 5 | 13 | 22 |
| CAN | 18 | 13 | 18 | 35 |
| N.L. | 2 | 11 | 24 | 52 |
| P.E.I. | 10 | 20 | 27 | 35 |
| N.S.Data table Note 1 | Note ..: not available for a specific reference period | 20 | 17 | 35 |
| N.B. | 10 | 12 | 19 | 33 |
| Que. | 4 | 10 | 17 | 39 |
| Ont. | 25 | 12 | 19 | 24 |
| Man. | 19 | 13 | 16 | 49 |
| Sask. | 10 | 9 | 19 | 44 |
| Alta. | 11 | 8 | 15 | 47 |
| B.C. | 24 | 22 | 22 | 44 |
.. not available for a specific reference period
Source: Table A.3.1, and Education at a Glance 2020 OECD Indicators. |
||||
- While the Canada figure for Doctoral or equivalent level programs (35%) is above the proportion observed for all OECD countries (22%) overall, there are variations across provinces, as this proportion ranges from 24% in Ontario to 52% in Newfoundland and Labrador.
- At the university level, the percentage of international students rises with level of study, except in Nova Scotia, where the proportion of international students at the Bachelor’s level (20%) was higher than for the Master’s level (17%).
- The highest proportions of international students at the college level were seen in Ontario (25%), British Columbia (24%) and Manitoba (19%), with all other provinces at or below 11%.
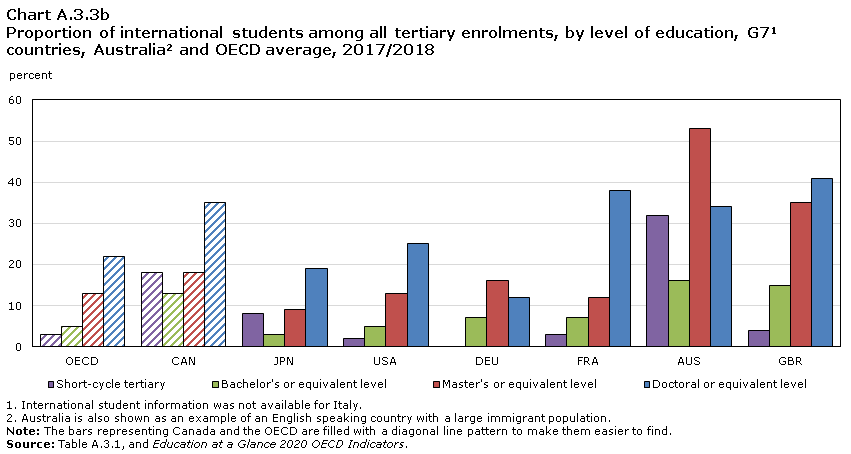
Data table for Chart A.3.3b
| Short-cycle tertiary | Bachelor's or equivalent level | Master's or equivalent level | Doctoral or equivalent level | |
|---|---|---|---|---|
| percent | ||||
| OECDData table Note 1 | 3 | 5 | 13 | 22 |
| CAN | 18 | 13 | 18 | 35 |
| JPN | 8 | 3 | 9 | 19 |
| USA | 2 | 5 | 13 | 25 |
| DEU | 0 | 7 | 16 | 12 |
| FRA | 3 | 7 | 12 | 38 |
| AUSData table Note 2 | 32 | 16 | 53 | 34 |
| GBR | 4 | 15 | 35 | 41 |
Sources: Table A.3.1, and Education at a Glance 2020: OECD Indicators. |
||||
- In comparison to other G7 countries, in Canada international students accounted for a higher proportion of postsecondary students than in Germany, Japan and the United States at all levels of postsecondary study. In the G7 countries, as is the case in Canada, the highest proportions of international students were observed at the Doctoral level.
- Australia, while not a G7 country, is included for comparison because it also hosts large numbers of immigrants. In comparison to Canada, with the exception of Doctoral students, Australia had higher proportions of international students at all levels of education, especially at the Master’s level where the proportion of international students (53%) exceeded that of all G7 countries.

Data table for Chart A.3.4
| Asia | Europe | Africa | Latin America and the Caribbean | North America | Oceania | |
|---|---|---|---|---|---|---|
| percent | ||||||
| CAN | 68 | 11 | 10 | 6 | 4 | 0 |
| N.L. | 53 | 7 | 25 | 10 | 4 | 0 |
| P.E.I. | 43 | 3 | 23 | 17 | 13 | 0 |
| N.S. | 71 | 3 | 10 | 12 | 4 | 0 |
| N.B. | 29 | 5 | 36 | 25 | 4 | 0 |
| Que. | 28 | 42 | 17 | 6 | 7 | 0 |
| Ont. | 80 | 4 | 7 | 6 | 2 | 0 |
| Man. | 61 | 3 | 26 | 6 | 3 | 0 |
| Sask. | 70 | 4 | 17 | 6 | 3 | 0 |
| Alta. | 75 | 5 | 9 | 8 | 3 | 1 |
| B.C. | 77 | 6 | 4 | 6 | 6 | 0 |
|
Note: These proportions were calculated based on students for whom the country of origin was known (the “other” category [not reported origin] was excluded from the calculation). The bars representing Canada are filled with a diagonal line pattern to make them easier to find. Source: Table A.3.2. |
||||||
- The majority of international students in Canada were from Asia (68%). Asia was the largest source region for every province, except New Brunswick and Quebec.
- In New Brunswick, the primary region of origin was Africa (36%), followed by Asia (29%) then Latin America and the Caribbean (25%).
- In Quebec, the largest source region was Europe (42%), followed by Asia (28%), then Africa (17%).
- Africa was the second highest source region in 6 provinces, in addition to being first in New Brunswick.
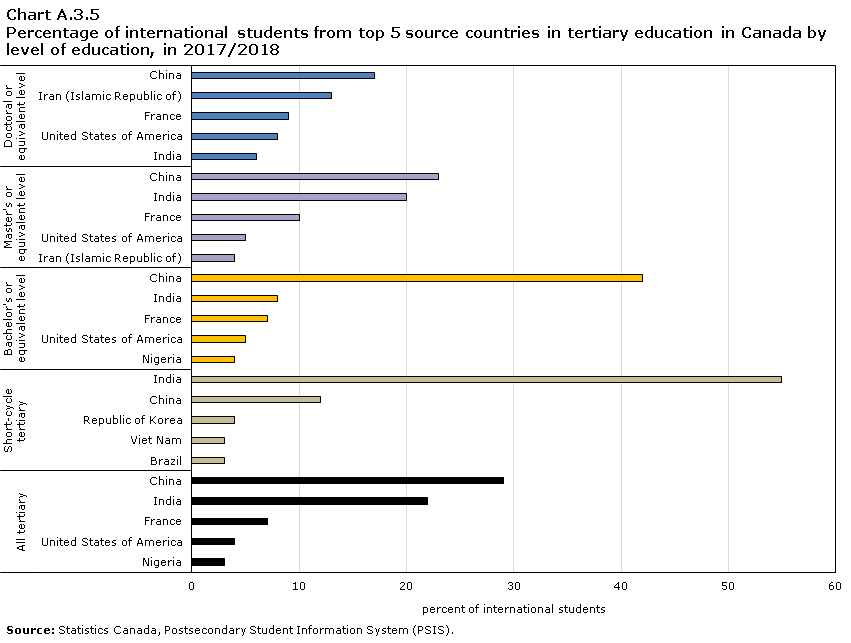
Data table for Chart A.3.5
| Education level | Origin country | Percent of international students |
|---|---|---|
| All tertiary | Nigeria | 3 |
| United States of America | 4 | |
| France | 7 | |
| India | 22 | |
| China | 29 | |
| Short-cycle tertiary | Brazil | 3 |
| Viet Nam | 3 | |
| Republic of Korea | 4 | |
| China | 12 | |
| India | 55 | |
| Bachelor's or equivalent level | Nigeria | 4 |
| United States of America | 5 | |
| France | 7 | |
| India | 8 | |
| China | 42 | |
| Master's or equivalent level | Iran (Islamic Republic of) | 4 |
| United States of America | 5 | |
| France | 10 | |
| India | 20 | |
| China | 23 | |
| Doctoral or equivalent level | India | 6 |
| United States of America | 8 | |
| France | 9 | |
| Iran (Islamic Republic of) | 13 | |
| China | 17 | |
| Source: Statistics Canada, Postsecondary Student Information System (PSIS). | ||
- China was the top source country for international students overall (30%), and at each level of tertiary education except at the college level, where India (55%) came first.
- China, India, and France made it into the top 5 source countries for international students at all levels of tertiary education except for short term tertiary.

Data table for Chart A.3.6
| 2000 | 2010 | 2017 | |
|---|---|---|---|
| percent | |||
| CANData table Note 1 | 5 | 8 | 15 |
| N.L. | 2 | 6 | 14 |
| P.E.I. | 3 | 8 | 18 |
| N.S. | 6 | 10 | 17 |
| N.B. | 7 | 13 | 13 |
| Que. | 4 | 7 | 11 |
| Ont. | 4 | 7 | 16 |
| Man. | 3 | 6 | 15 |
| Sask. | 4 | 7 | 12 |
| Alta. | 5 | 8 | 11 |
| B.C. | 6 | 12 | 23 |
|
|||
- International students increased as a percentage of all tertiary students in Canada, from 5% in 2000 to 15% in 2017.
- The proportion of international students changed the least in New Brunswick between 2010 and 2017 (both 13%), reaching a peak of 15% in 2014.
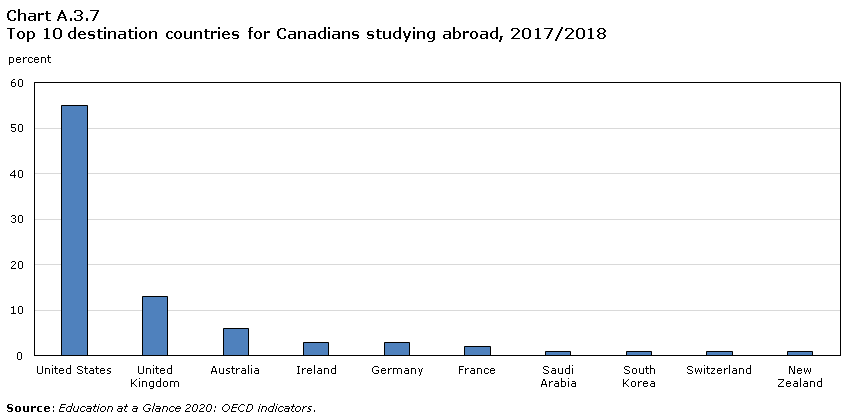
Data table for Chart A.3.7
| Destination country | Percent |
|---|---|
| United States | 55 |
| United Kingdom | 13 |
| Australia | 6 |
| Ireland | 3 |
| Germany | 3 |
| France | 2 |
| Saudi Arabia | 1 |
| South Korea | 1 |
| Switzerland | 1 |
| New Zealand | 1 |
| Source: Education at a Glance 2020: OECD indicators. | |
- In 2017/2018, the top destinations for Canadians who went abroad to study were the United States (55%), the United Kingdom (13%), Australia (6%), Ireland (3%) and Germany (3%).
Definitions, sources and methodology
This indicator examines the proportion of international students in the different categories of tertiary education.
International students are those who are pursuing education in a country other than their country of residence or the country in which they were previously educated. In Canada, the concept of “international students” includes non-permanent residents,Note such as those with a study permit. It also includes those enrolled in a Canadian program from a Canadian institution that is not located in Canada (also known as “offshore students”) as well as non-Canadian students studying via the Internet.
Foreign students correspond to a broader concept that includes students who are educated in a country for which they do not hold citizenship. In Canada, the concept of “foreign students” includes all “international students”, plus all students who are landed immigrant/permanent residents.Note
The proportion of enrolment at a given education level by international students is obtained by dividing the number of students who are neither Canadian citizens nor permanent residents of Canada by the total number of students at that level, and multiplying this ratio by 100. The total number of students includes all individuals educated in Canada, whether they are Canadian citizens, permanent residents or foreign nationals as well as “off-shore students”, but it excludes all Canadian citizens and permanent residents who are educated abroad.
The Canadian data were drawn from Statistics Canada’s Postsecondary Student Information System (PSIS), which covers only public postsecondary institutions. Results for some jurisdictions rely in part on estimates made for non-responding institutions. Due to certain methodological adjustments that have been made to the PSIS collection tool to improve reporting and mapping to ISCED, comparisons of results with those from previous years should not be made.
The OECD data on foreign students and international students reflect the same academic year as for Canada, and are drawn from the UOE collection of statistical data on education, which was carried out by the OECD. In Canada and other OECD countries, domestic and international students are usually counted on a specific day or period of the year (e.g., PSIS provides a count of students enrolled in public colleges and universities in Canada based on enrolment for a single date chosen by the institution that falls between September 30 and December 1). This procedure may not capture the total number of international students as some students may study abroad for less than a full academic year (e.g., those that enter in the winter or spring terms).
Note: The corresponding OECD indicator is B6, What is the profile of internationally mobile students?.
A4 Transitions to the labour market
Context
This indicator focuses on transitions from education to the working world. The percentages of individuals between 15 and 29 years of age who are considered to be “in education” or “not in education” are presented, along with their respective employment situations. Such information can be helpful in understanding how young adults may combine school and work, or how they may transition from one to the other. The “not in education” portion of this population is further examined with a focus on those individuals who are neither employed nor in education (or training), a group sometimes referred to as the “NEET” population.
In Canada and most other Organisation for Economic Co-operation and Development (OECD) countries, education policy-makers strive to encourage young people to complete at least their secondary education. As successfully reaching this milestone has become the norm for students in the majority of OECD countries, those who fail to do so will likely have much more difficulty when they enter the labour market, where lacking a high school education is usually an impediment to finding a job.
Recognition of the importance of postsecondary education for economic and social success—both for individuals and society—is widespread. However, the decisions that young people make regarding their education are often influenced by economic conditions. They may, for example, be inclined to leave school and enter the work force when the labour market is strong, or they may decide to continue with or return to their education when the labour market is weak and it is more difficult to find a job.
The transition from school to work is not always an easy process, and complexity may be added by a combination of factors including personal circumstances, the type and length of schooling received, and the labour market and overall economic conditions that younger people may face. It is also important to find ways to understand how this complexity may affect the NEET group, particularly the youngest members, as teens aged 15 to 19 will have both lower educational attainment and less work experience than young adults in their twenties.
As the results presented in this chapter reflect the average of the first three months of 2020, they mainly reflect the pre-pandemic situation of January and February, with some effect from March. For more information on how the NEET rate was affected in the months directly following the start of the pandemic in Canada, please refer to the Fact Sheet: Impact of the COVID-19 pandemic on the NEET (not in employment, education or training) indicator, March and April 2020.
Observations
Young adults in education, not in education

Data table for Chart A.4.1
| In education | Not in education, employed | Neither employed nor in education or training (NEET) | |
|---|---|---|---|
| percent | |||
| 15 to 19 years old | 80 | 11 | 9 |
| 18 to 24 years old | 49 | 38 | 13 |
| 20 to 24 years old | 42 | 44 | 14 |
| 25 to 29 years old | 12 | 72 | 17 |
| Source: Table A.4.1. | |||
- In 2020, the majority of young Canadians aged 15 to 19 (80%) were in school. For young adults, a higher proportion of adults aged 18 to 24 were in school (49%) in comparison to those who had transitioned to the labour market and were employed (38%). Among adults aged 20 to 24, similar proportions were observed between those in school (42%) and those who were employed (44%). For those in the 25- to 29-year-old age group, most (72%) were no longer in school and were employed.
- In 2020, the proportion of young Canadians who were “not in education, employment or training” (or the NEET rate) was higher for those aged 25 to 29 years (17%) than for those aged 18 to 24 years (13%), 20 to 24 years (14%) or 15 to 19 years (9%).

Data table for Chart A.4.2
| In education | Not in education, employed | Neither employed nor in education or training (NEET) | |
|---|---|---|---|
| percent | |||
| OECD | 53 | 33 | 14 |
| CAN | 49 | 38 | 13 |
| N.L. | 43 | 38 | 20 |
| P.E.I. | 44 | 43 | 13 |
| N.S | 43 | 40 | 17 |
| N.B. | 39 | 47 | 14 |
| Que. | 50 | 38 | 13 |
| Ont. | 52 | 35 | 13 |
| Man. | 44 | 43 | 14 |
| Sask. | 39 | 46 | 15 |
| Alta. | 42 | 43 | 15 |
| B.C. | 48 | 38 | 14 |
| Y.T. | 32 | 49 | 19 |
| N.W.T. | 36 | 33 | 32 |
| Nvt. | 24 | 29 | 48 |
|
Note: The bars representing Canada and the OECD are filled with a diagonal line pattern to make them easier to find. Sources: Table A.4.4 and Education at a Glance 2020: OECD Indicators. |
|||
- At the national level, a larger proportion of young adults aged 18 to 24 were in school (49%) in comparison to those who had transitioned to the labour market and were employed (38%). This is in comparison to the OECD average, where a higher proportion of 18-24 year olds were in school (53%) in comparison to those who were employed (33%). These percentages varied more widely at the provincial and territorial level.
- The proportion of young Canadians in education varied greatly among the provinces and territories, ranging from 24% in Nunavut to 52% in Ontario.
- The proportion of young Canadians who had transitioned into the labour market and were employed ranged from 29% in Nunavut to 49% in Yukon.
- In Quebec, Ontario and British Columbia, the proportion of 18 to 24 year olds who were still in school was larger than that who had transitioned to the labour market. The reverse was true in Saskatchewan. In all other provinces and territories, this difference was not significant.
- The NEET rate among 18- to 24-year-olds ranged from 13% in Prince Edward Island, Quebec and Ontario to 48% in Nunavut. The Canadian average was 13%, lower than the OECD average of 14%.
The NEET rate in Canada versus other countries
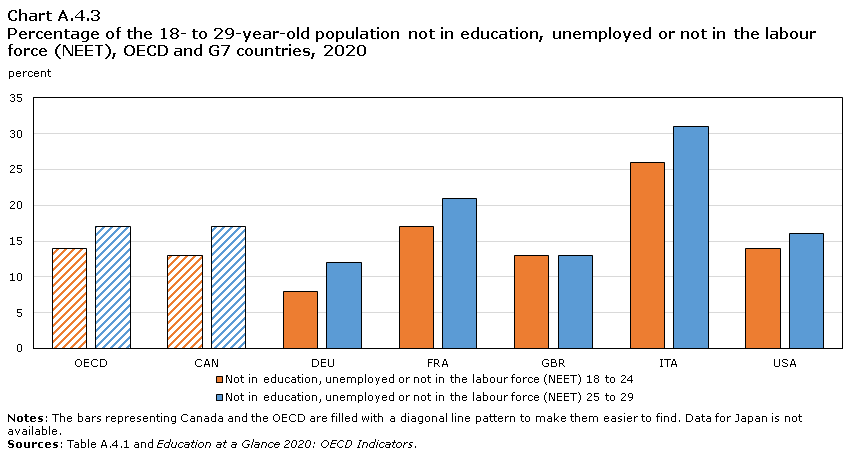
Data table for Chart A.4.3
| Not in education, unemployed or not in the labour force (NEET) | ||
|---|---|---|
| 18 to 24 | 25 to 29 | |
| percent | ||
| OECD | 14 | 17 |
| CAN | 13 | 17 |
| DEU | 8 | 12 |
| FRA | 17 | 21 |
| GBR | 13 | 13 |
| ITA | 26 | 31 |
| USA | 14 | 16 |
|
Notes: The bars representing Canada and the OECD are filled with a diagonal line pattern to make them easier to find. Data for Japan is not available. Sources: Table A.4.1 and Education at a Glance 2020: OECD Indicators. |
||
- In 2020, the NEET rate for 18- to 24-year olds and 25- to 29- year olds in Canada and for the OECD average were similar for both age groups.
- However, there is greater variability between the countries. Among the G7 countries, Italy had the highest NEET rate for the same age groups (26% for the younger age group and 31% for the older) while Germany had the lowest NEET rates (8% and 12%).
NEET rates by sex
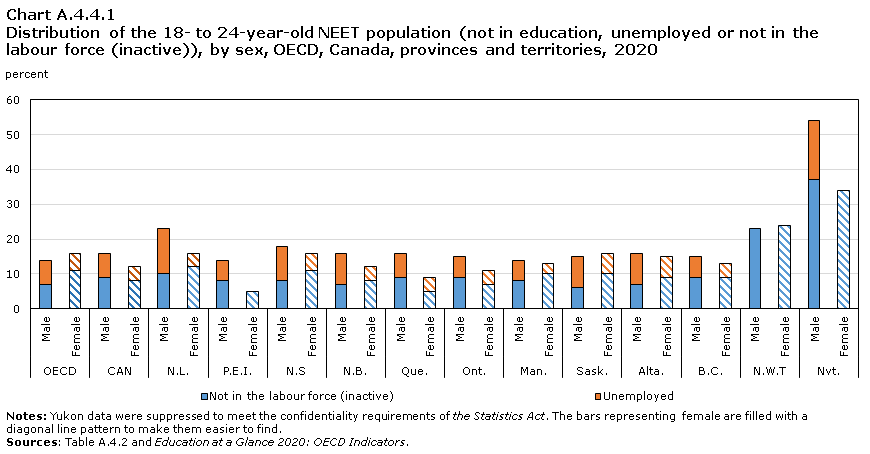
Data table for Chart A.4.4.1
| Not in the labour force (inactive) | Unemployed | ||
|---|---|---|---|
| percent | |||
| OECD | Male | 7 | 7 |
| Female | 11 | 5 | |
| CAN | Male | 9 | 7 |
| Female | 8 | 4 | |
| N.L. | Male | 10 | 13 |
| Female | 12 | 4 | |
| P.E.I. | Male | 8 | 6 |
| Female | 5 | Note F: too unreliable to be published | |
| N.S | Male | 8 | 10 |
| Female | 11 | 5 | |
| N.B. | Male | 7 | 9 |
| Female | 8 | 4 | |
| Que. | Male | 9 | 7 |
| Female | 5 | 4 | |
| Ont. | Male | 9 | 6 |
| Female | 7 | 4 | |
| Man. | Male | 8 | 6 |
| Female | 10 | 3 | |
| Sask. | Male | 6 | 9 |
| Female | 10 | 6 | |
| Alta. | Male | 7 | 9 |
| Female | 9 | 6 | |
| B.C. | Male | 9 | 6 |
| Female | 9 | 4 | |
| N.W.T | Male | 23 | X |
| Female | 24 | X | |
| Nvt. | Male | 37 | 17 |
| Female | 34 | X | |
|
F too unreliable to be published X suppressed to meet the confidentiality requirements of the Statistics Act Notes: Yukon data were suppressed to meet the confidentiality requirements of the Statistics Act. The bars representing female are filled with a diagonal line pattern to make them easier to find. Sources: Labour Force Survey and Education at a Glance 2020: OECD Indicators. |
|||
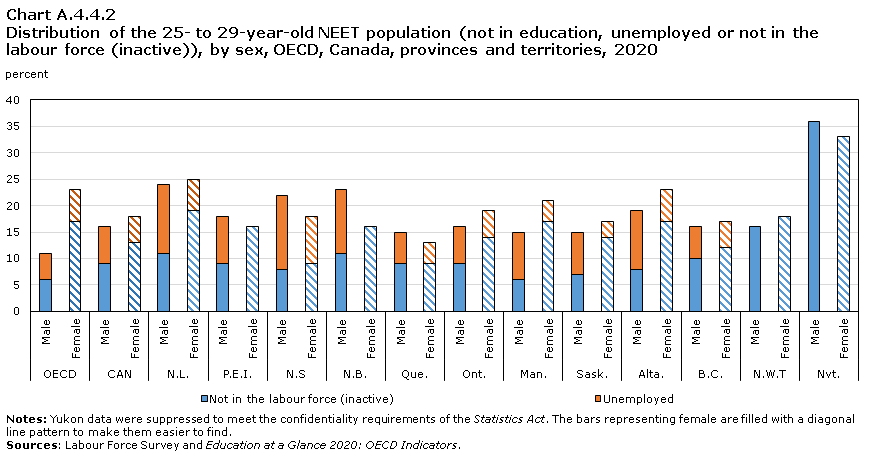
Data table for Chart A.4.4.2
| Not in the labour force (inactive) | Unemployed | ||
|---|---|---|---|
| percent | |||
| OECD | Male | 6 | 5 |
| Female | 17 | 6 | |
| CAN | Male | 9 | 7 |
| Female | 13 | 5 | |
| N.L. | Male | 11 | 13 |
| Female | 19 | 6 | |
| P.E.I. | Male | 9 | 9 |
| Female | 16 | X | |
| N.S | Male | 8 | 14 |
| Female | 9 | 9 | |
| N.B. | Male | 11 | 12 |
| Female | 16 | Note F: too unreliable to be published | |
| Que. | Male | 9 | 6 |
| Female | 9 | 4 | |
| Ont. | Male | 9 | 7 |
| Female | 14 | 5 | |
| Man. | Male | 6 | 9 |
| Female | 17 | 4 | |
| Sask. | Male | 7 | 8 |
| Female | 14 | 3 | |
| Alta. | Male | 8 | 11 |
| Female | 17 | 6 | |
| B.C. | Male | 10 | 6 |
| Female | 12 | 5 | |
| N.W.T | Male | 16 | X |
| Female | 18 | X | |
| Nvt. | Male | 36 | X |
| Female | 33 | X | |
|
F too unreliable to be published X suppressed to meet the confidentiality requirements of the Statistics Act Notes: Yukon data were suppressed to meet the confidentiality requirements of the Statistics Act. The bars representing female are filled with a diagonal line pattern to make them easier to find. Sources: Labour Force Survey and Education at a Glance 2020: OECD Indicators. |
|||
- In Canada in 2020, the NEET rates for 18-to 24- year olds were 12% for women and 16% for men. As well, a higher proportion of men (7%) than women (4%) were unemployed. This was also true in Newfoundland and Labrador (13% for men versus 4% for women) and Quebec (7% for men versus 4% for women).
- The proportion of men and women who were not in the labour force varied by province and territory, ranging from 8% in Manitoba to 37% in Nunavut for men, and from 5% in Quebec and Prince Edward Island to 34% in Nunavut for women. In Quebec, the proportion of women who were not in the labour force was lower than that for men (5% versus 9%).
- For 25- to 29- year olds, a higher proportion of women were not in the labour force (13%) compared with men (9%). This was particularly true in Ontario (14% versus 9%), Manitoba (17% versus 6%), Saskatchewan (14% versus 7%), and Alberta (17% versus 8%).
Trends in NEET rates

Data table for Chart A.4.5
| 2005 | 2010 | 2015 | 2020 | |
|---|---|---|---|---|
| percent | ||||
| Total in education | 45 | 46 | 49 | 49 |
| Not in education, employed | 41 | 39 | 38 | 38 |
| Not in education, not employed | 14 | 15 | 13 | 13 |
| Source: Table A.4.4. | ||||
- From 2005 to 2020, there has been an increase in the proportion of 18- to 24-year olds in Canada that are in school (45% in 2005, 49% in 2020).
- The NEET rate of young Canadians (13%) in 2020 was similar to that observed in 2005 (14%).
NEET rates by highest level of education
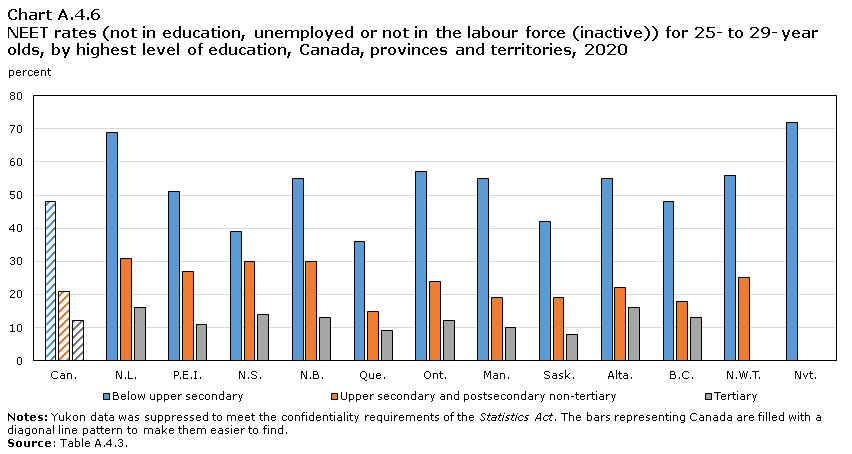
Data table for Chart A.4.6
| Below upper secondary | Upper secondary and postsecondary non-tertiary | Tertiary | |
|---|---|---|---|
| percent | |||
| Can. | 48 | 21 | 12 |
| N.L. | 69 | 31 | 16 |
| P.E.I. | 51 | 27 | 11 |
| N.S. | 39 | 30 | 14 |
| N.B. | 55 | 30 | 13 |
| Que. | 36 | 15 | 9 |
| Ont. | 57 | 24 | 12 |
| Man. | 55 | 19 | 10 |
| Sask. | 42 | 19 | 8 |
| Alta. | 55 | 22 | 16 |
| B.C. | 48 | 18 | 13 |
| N.W.T. | 56 | 25 | X |
| Nvt. | 72 | X | X |
|
X suppressed to meet the confidentiality requirements of the Statistics Act Notes: Yukon data was suppressed to meet the confidentiality requirements of the Statistics Act. The bars representing Canada are filled with a diagonal line pattern to make them easier to find. Source: Table A.4.3. |
|||
- In Canada in 2020, the NEET rate for 25- to 29-year olds was highest for individuals with below upper secondary education (48%), lower for those with upper secondary and postsecondary non-tertiary education (21%), and lowest for those with tertiary education (12%). This pattern was the same in all provinces and territories.
Definitions, sources and methodology
The indicator is calculated using cross-tabulations for the following variables: school attendance, labour force status, sex, age (15 to 29 overall; 15 to 19; 18 to 24; 20 to 24; and 25 to 29) and educational attainment (highest level of education attained). Individuals are categorized by their education status (in education or not in education) and their labour force status (employed, unemployed, or not in the labour force). Some historical data are also presented.
The “in education” group captures both full- and part-time students, while “not in education” portrays those who are no longer pursuing a formal education. As per the OECD definition, the educational institutions considered for this indicator are primary and secondary educational institutions, colleges and universities. Employment status is based on International Labour Organization (ILO) guidelines. The employed are defined as those who during the survey reference week: (i) work for pay (employees) or profit (self-employed and unpaid family workers) for at least one hour; or (ii) have a job but are temporarily not at work (through injury, illness, holiday, strike or lock-out, educational or training leave, maternity or parental leave, etc.). The unemployed are defined as individuals who are, during the survey reference week, without work, actively seeking employment and currently available to start work. And not in the labour force captures individuals who are not working and who are not unemployed; i.e., individuals who are not looking for a job.
In addition to those who are employed, the total “not in education” portion of the 15- to 29-year-old population also includes those who are neither employed nor in education (or training). Such individuals are sometimes referred to as the “NEET” population. This captures a somewhat diverse group of young people in a number of possible situations. Some may be part of this group by choice, perhaps taking time off work and/or school to travel or to start families and care for their young children. Some might prefer to be working, but have abandoned the job search temporarily. These people would be seen as “not in the labour force”Note as opposed to those who are seeking work but are unemployed. The group of people who are not in education and are either “unemployed” or “not in the labour force” is a population that could potentially be at risk for economic and social difficulties.
The data were obtained from Statistics Canada’s Labour Force Survey (LFS), and they cover the first quarter or the average of the first three months of the calendar year, which excludes summer employment. The LFS does not collect data on official work-study programmes in which students might participate; in Canada, these would be considered education in the form of a co-op or student intern programme.
Note: The corresponding OECD indicator is A2, Transition from school to work: Where are today’s youth?.
A5 Labour market outcomes
Context
This indicator examines the connection between educational attainment and the labour market by looking at employment rates among the adult population aged 25 to 64. This relationship is explored by sex and by age group (25 to 34 and 55 to 64). Trends in employment rates by educational attainment are also presented. Educational attainment reflects the highest level of education successfully completed, based on the International Standard Classification of Education (ISCED) categories.Note
One of the main objectives of education systems is to prepare individuals so they can participate in a knowledge-oriented economy and society. Job prospects and employment rates are generally better for those individuals with higher education.
Observations
Employment rates rise with higher levels of education

Data table for Chart A.5.1
| Below Upper secondary | Lower secondary | Upper secondary | Short-cycle tertiary | Bachelor's or equivalent |
Master's and Doctoral levels or equivalent | |
|---|---|---|---|---|---|---|
| percent | ||||||
| Men (OECD) | 69 | 72 | 83 | 87 | 89 | Note ..: not available for a specific reference period |
| Women (OECD) | 48 | 50 | 69 | 77 | 81 | Note ..: not available for a specific reference period |
| Men (Canada) | 65 | 67 | 78 | 86 | 87 | 87 |
| Women (Canada) | 45 | 49 | 64 | 79 | 81 | 83 |
|
.. not available for a specific reference period Note: OECD average is not available for combined master's and doctoral levels. Sources: Tables A.5.1, A.5.3.1 and Education at a Glance 2020: OECD Indicators. |
||||||
- Employment rates rose with levels of educational attainment both in Canada and at the OECD average.
- In Canada and for the OECD average, women had consistently lower employment rates than men.
- This gender gap in employment rates in Canada was largest (20 percentage points) among those with the least education and smallest (6 percentage points) among the men and women with bachelor’s or equivalent.Note This was also true at the OECD average, with a larger gap between men and women at the lower secondary level (22 percentage points) and a smaller gap at the Bachelor’s or equivalent (8 percentage points).
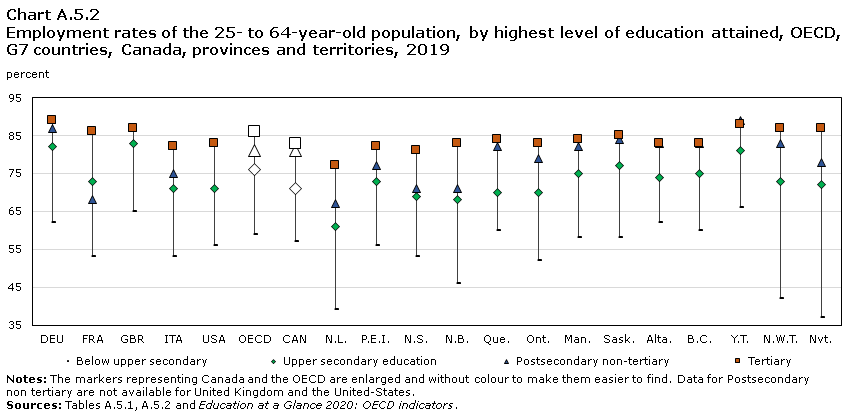
Data table for Chart A.5.2
| Below upper secondary | Upper secondary education | Postsecondary non-tertiary | Tertiary | |
|---|---|---|---|---|
| percent | ||||
| DEU | 62 | 82 | 87 | 89 |
| FRA | 53 | 73 | 68 | 86 |
| GBR | 65 | 83 | Note ..: not available for a specific reference period | 87 |
| ITA | 53 | 71 | 75 | 82 |
| USA | 56 | 71 | Note ..: not available for a specific reference period | 83 |
| OECD | 59 | 76 | 81 | 86 |
| CAN | 57 | 71 | 81 | 83 |
| N.L. | 39 | 61 | 67 | 77 |
| P.E.I. | 56 | 73 | 77 | 82 |
| N.S. | 53 | 69 | 71 | 81 |
| N.B. | 46 | 68 | 71 | 83 |
| Que. | 60 | 70 | 82 | 84 |
| Ont. | 52 | 70 | 79 | 83 |
| Man. | 58 | 75 | 82 | 84 |
| Sask. | 58 | 77 | 84 | 85 |
| Alta. | 62 | 74 | 83 | 83 |
| B.C. | 60 | 75 | 83 | 83 |
| Y.T. | 66 | 81 | 89 | 88 |
| N.W.T. | 42 | 73 | 83 | 87 |
| Nvt. | 37 | 72 | 78 | 87 |
|
.. not available for a specific reference period Notes: The markers representing Canada and the OECD are enlarged and without colour to make them easier to find. Data for Postsecondary non tertiary are not available for United Kingdom and the United-States. Sources: Table A.5.1, Table A.5.2 and Education at a Glance 2019: OECD Indicators. |
||||
- Employment rates also rose with levels of educational attainment across all provinces, territories, G7 countries and at the OECD average. However, the magnitude and the nature of the educational advantage varied among the provinces and territories.
- Tertiary graduates generally had the highest employment rate (83%) in 2019, but this differed across the country. From Ontario eastward, tertiary graduates had the highest employment rates. In the rest of the country (i.e. from Manitoba west, and the territories) differences were negligible between tertiary graduates’ employment rates and adults with postsecondary non-tertiary as their highest educational attainment.
- Employment rates for Canadians with tertiary education were comparable to those of G7 countries. Canada’s employment rate was the same than that of the United States, higher than that of Italy but lower than that of France, Germany and the United Kingdom.
- Employment rates for Canadians with less than upper secondary education ranged widely across the country, from 37% in Nunavut to 66% in the Yukon.
Employment rates by attainment and age group

Data table for Chart A.5.3.1
| Total | Men | Women | |
|---|---|---|---|
| percent | |||
| DEU | 88 | 92 | 85 |
| FRA | 87 | 89 | 86 |
| GBR | 90 | 93 | 89 |
| ITA | 68 | 69 | 67 |
| JPN | 88 | 94 | 82 |
| USA | 85 | 89 | 83 |
| OECD | 85 | 89 | 81 |
| CAN | 86 | 89 | 84 |
| N.L. | 82 | 87 | 79 |
| P.E.I. | 87 | 87 | 86 |
| N.S. | 86 | 88 | 85 |
| N.B. | 87 | 88 | 86 |
| Que. | 86 | 87 | 86 |
| Ont. | 86 | 89 | 83 |
| Man. | 86 | 89 | 83 |
| Sask. | 87 | 93 | 84 |
| Alta. | 84 | 87 | 81 |
| B.C. | 87 | 90 | 85 |
| Y.T. | 94 | 94 | 94 |
| N.W.T. | 87 | 90 | 86 |
| Nvt. | 84 | 94 | 77 |
|
Note: The bars representing Canada and the OECD are filled with a diagonal line pattern to make them easier to find. Sources: Table A.5.3.2 and and Education at a Glance 2020: OECD Indicators. |
|||
- The difference in employment rates between young tertiary-educated men and women in Canada was smaller than that observed at the OECD average (5 percentage points versus 8 percentage points), but similar to that observed in the United Kingdom. The largest gap in employment rates for this age group was observed in Japan (12 percentage points).
- In 2019, the employment rate was high among young adults with tertiary education in Canada (86%). The employment rate for this age group was highest in Yukon (94%).
- At the national level, the employment rate was higher for all 25- to 34-year-old men (85%, all levels of education) than it was for women in the same age group (79%). However, this difference was only significant in Ontario, Manitoba, Saskatchewan, Alberta and British Columbia.
Data table for Chart A.5.3.2
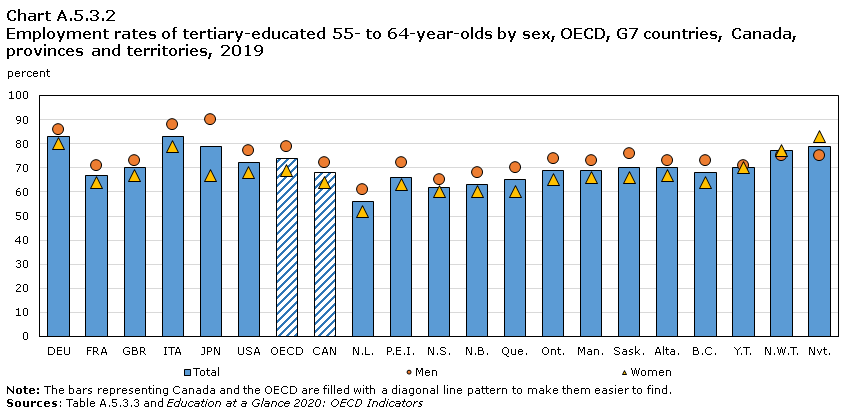
| Total | Men | Women | |
|---|---|---|---|
| percent | |||
| DEU | 83 | 86 | 80 |
| FRA | 67 | 71 | 64 |
| GBR | 70 | 73 | 67 |
| ITA | 83 | 88 | 79 |
| JPN | 79 | 90 | 67 |
| USA | 72 | 77 | 68 |
| OECD | 74 | 79 | 69 |
| CAN | 68 | 72 | 64 |
| N.L. | 56 | 61 | 52 |
| P.E.I. | 66 | 72 | 63 |
| N.S. | 62 | 65 | 60 |
| N.B. | 63 | 68 | 60 |
| Que. | 65 | 70 | 60 |
| Ont. | 69 | 74 | 65 |
| Man. | 69 | 73 | 66 |
| Sask. | 70 | 76 | 66 |
| Alta. | 70 | 73 | 67 |
| B.C. | 68 | 73 | 64 |
| Y.T. | 70 | 71 | 70 |
| N.W.T. | 77 | 75 | 77 |
| Nvt. | 79 | 75 | 83 |
|
Note: The bars representing Canada and the OECD are filled with a diagonal line pattern to make them easier to find. Sources: Table A.5.3.3 and Education at a Glance 2020: OECD Indicators. |
|||
- For the tertiary-educated population aged 55 to 64, the employment rate for men (72%) was higher than that for women (64%) in Canada, and at the OECD average. The gap between employment rates of men and women in Canada (8 percentage points) was smaller than it was at the OECD average (10 percentage points), but higher than that of Germany and the United Kingdom (6 percentage points each) and France (7 percentage points). The largest difference between employment rates was observed in Japan (23 percentage points).
- In 2019, the employment rates of the 55- to 64-year old population with tertiary education ranged from 56% (Newfoundland and Labrador) to 79% (Nunavut) among the provinces and territories.

Data table for Chart A.5.3.3
| Below upper secondary | Upper secondary | Postsecondary non-tertiary | Tertiary | |
|---|---|---|---|---|
| percent | ||||
| OECD | 60 | Note ..: not available for a specific reference period | Note ..: not available for a specific reference period | 85 |
| CAN | 57 | 74 | 88 | 86 |
| N.L. | 40 | 61 | 73 | 82 |
| P.E.I. | 48 | 75 | 84 | 87 |
| N.S. | 58 | 72 | 79 | 86 |
| N.B. | 51 | 67 | 81 | 87 |
| Que. | 64 | 76 | 88 | 86 |
| Ont. | 51 | 70 | 89 | 86 |
| Man. | 51 | 76 | 88 | 86 |
| Sask. | 52 | 77 | 86 | 87 |
| Alta. | 60 | 77 | 89 | 84 |
| B.C. | 62 | 79 | 90 | 87 |
| Y.T. | Note ..: not available for a specific reference period | 79 | 99 | 94 |
| N.W.T. | 35 | 68 | 88 | 87 |
| Nvt. | 35 | 68 | 71 | 84 |
|
.. not available for a specific reference period Notes: The bars representing Canada and the OECD are filled with a diagonal line pattern to make them easier to find. Data for below upper secondary are not available for Yukon. Data for upper secondary and postsecondary non-tertiary are not available for the OECD. Sources: Table A.5.3.2 and Education at a Glance 2020: OECD indicators. |
||||
- In 2019, the employment rate for young adults was higher in Canada than in OECD countries for all levels of education (82% versus 79%).
- The lowest employment rate was observed among youth with less than a high school education as their highest level of educational attainment. These rates ranged from 35% (Nunavut, Northwest Territories) to 64% (Quebec). At the national level and in Alberta and Yukon, post-secondary non-tertiary graduates had a higher employment rate than tertiary graduates.

Data table for Chart A.5.3.4
| Below upper secondary | Upper secondary | Postsecondary non-tertiary | Tertiary | |
|---|---|---|---|---|
| percent | ||||
| OECD | 48 | Note ..: not available for a specific reference period | Note ..: not available for a specific reference period | 74 |
| CAN | 50 | 60 | 66 | 68 |
| N.L. | 34 | 52 | 53 | 56 |
| P.E.I. | 53 | 66 | 64 | 66 |
| N.S. | 47 | 57 | 58 | 62 |
| N.B. | 41 | 59 | 61 | 63 |
| Que. | 53 | 57 | 64 | 65 |
| Ont. | 47 | 60 | 69 | 69 |
| Man. | 55 | 62 | 71 | 69 |
| Sask. | 57 | 68 | 72 | 70 |
| Alta. | 55 | 62 | 69 | 70 |
| B.C. | 51 | 61 | 69 | 68 |
| Y.T. | 51 | 70 | 74 | 70 |
| N.W.T. | 44 | 70 | 78 | 77 |
| Nvt. | 44 | 80 | Note ..: not available for a specific reference period | 79 |
|
.. not available for a specific reference period Notes: The bars representing Canada and the OECD are filled with a diagonal line pattern to make them easier to find. Data are unavailable for postsecondary non-tertiary for Nunavut. Sources: Table A.5.3.3 and Education at a Glance 2020: OECD indicators. |
||||
- In contrast to young adults, there was no significant difference between the employment rate of 55 to 64 year old postsecondary non-tertiary graduates versus similarly aged tertiary graduates in 2019.
Definitions, sources and methodology
This indicator, labour market outcomes, examines the relationship between educational attainment and the employment rates of 25-to 64-year-olds, overall, by sex, and by age group. It also provides insight into how this relationship has evolved over time.
The employment rate represents the percentage of employed people in this population. To calculate the employment rate for a group with a particular level of educational attainment, the number of employed persons with the particular level of educational attainment is divided by the total number of persons in the population aged 25 to 64 who have attained that education level and then multiplying this quotient by 100.
The concepts and definitions of “employment” and “unemployment” adopted by the Labour Force Survey (LFS) are based on those endorsed by the International Labour Organisation (ILO). Employed persons are those who, during the reference week: (1) did any work at all at a job or business, that is, paid work in the context of an employer-employee relationship, or self-employment. It also includes unpaid family work, which is defined as unpaid work contributing directly to the operation of a farm, business or professional practice owned and operated by a related member of the same household; or (2) had a job but were not at work due to factors such as own illness or disability, personal or family responsibilities, vacation, labour dispute or other reasons (excluding persons on layoff, between casual jobs, and those with a job to start at a future date). The education level is measured according to the highest level of schooling completed.
The data for Canada and its provinces and territories were drawn from the Labour Force Survey (LFS), which surveys approximately 56,000 households every month.Note The LFS excludes the following from the scope of the survey: individuals who live on reserves or in other Aboriginal settlements in the provinces, full-time members of the Canadian Forces and institutional residents. The LFS employment rate is based on a monthly average from January to December. Figures from the Organisation for Economic Co-operation and Development (OECD) are those reported by the OECD, and they are extracted from the OECD and Eurostat databases compiled from national labour force surveys for the OECD member countries.
Note: The corresponding OECD indicator is A3, How does educational attainment affect participation in the labour market?.
- Date modified: