
Chapter E
Skills proficiencies of adults

Archived Content
Information identified as archived is provided for reference, research or recordkeeping purposes. It is not subject to the Government of Canada Web Standards and has not been altered or updated since it was archived. Please "contact us" to request a format other than those available.
E1 Insights from the Programme for the International Assessment of Adult Competencies (PIAAC)
Context
This indicator is based on data from the Program for the International Assessment of Adult Competencies (PIAAC), a household study conducted under the auspices of the Organisation for Economic Co-operation and Development (OECD). In Education at a Glance 2014: OECD Indicators and other OECD publications, PIAAC is referred to as the “Survey of Adult Skills”.
PIAAC’s aim was to assess key cognitive and workplace skills needed for successful participation in 21st-century society and the global economy. The study measured cognitive skills in the areas of literacy, numeracy, and problem-solving in technology rich environments. It also included an extensive background questionnaire that provides information about a number of other skills and personal traits that are important for success.
Observations
Literacy, numeracy and educational attainment

- Canadians with higher levels of educational attainment performed better than their less educated counterparts in literacy and numeracy. Among those who had not received a high school diploma, almost none performed at the highest level of these competencies.
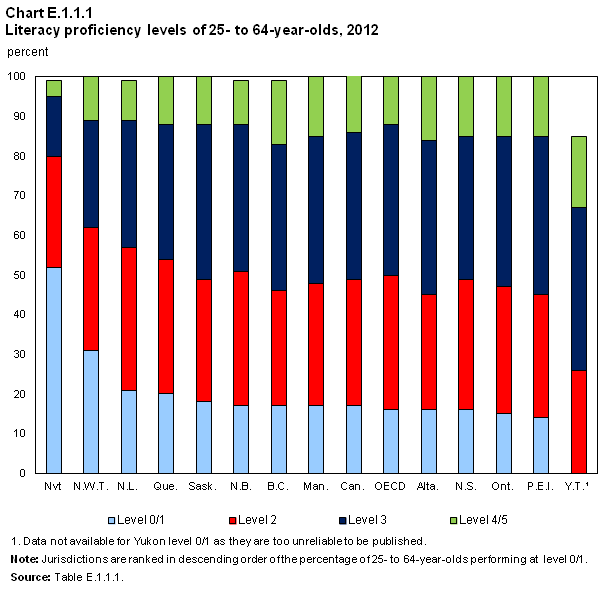

- The proportions of Canadians performing at each literacy level were similar to the OECD averages. For numeracy, the distribution for Canada was similar to that for the OECD overall, although Canada had a slightly higher proportion of adults at the lowest numeracy level.
- In Canada and most of the provinces and territories the percentage of those who performed at Levels 4 or 5 in literacy is at or above the OECD average. In numeracy, the percentage of Canadians performing at Levels 4 or 5 is at or above the OECD average in roughly half of the jurisdictions and in Canada overall.
Employment, literacy and numeracy

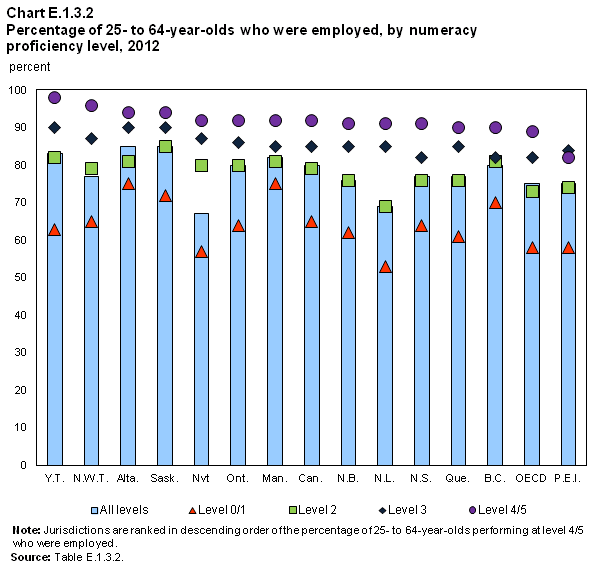
- In Canada and across jurisdictions, those who had higher proficiency levels in literacy and numeracy were more likely to be employed.
- While this pattern held for all jurisdictions, there was less variability in employment outcomes by level of literacy and numeracy in the western provinces where employment rates for those at the lowest level of literacy and numeracy were high relative to their counterparts in other provinces.
Social outcomes
- The proportions of Canadians who reported positive social outcomes were higher among those with literacy level 4/5: 95% of those performing at Levels 4 or 5 reported having good health, 36% said they had trust in others, 35% reported volunteering at least once a month, and 49% thought they had an influence on government (Table E.1.4.1).
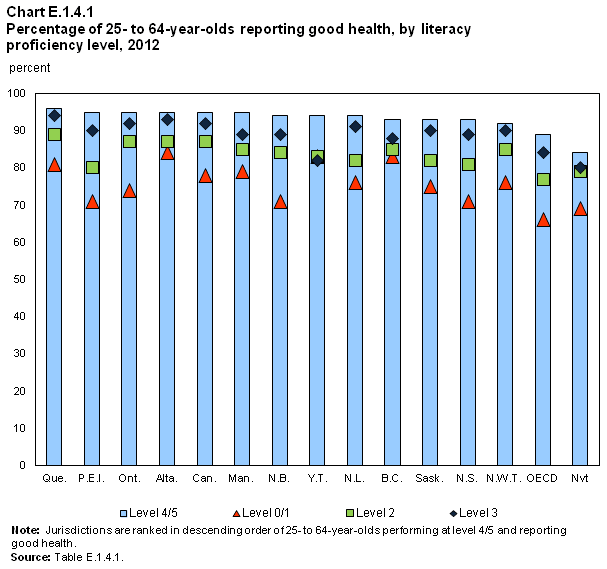
- In the majority of provinces and territories, the percentages of adults reporting the positive social outcome of good health were highest for those who performed at the highest levels of literacy (4 or 5). At each level of literacy proficiency, the figures for Canada were above those reported by the OECD.
Formal and non-formal learning
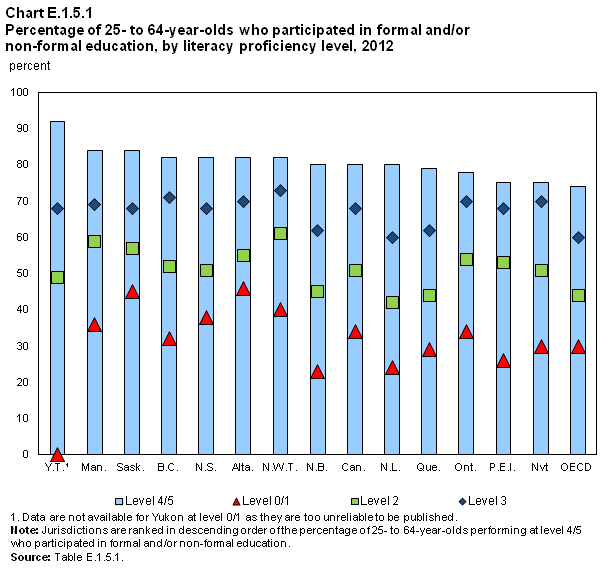
- Canadian adults with higher levels of literacy proficiency had higher rates of participation in formal and non-formal learning activities.
- In all of the provinces and territories and at the Canada level, the rates of participation in formal and non-formal learning activities among those who performed at Levels 3, 4 and 5 were higher compared with the OECD averages.
Definitions, sources and methodology
Programme for the International Assessment of Adult Competencies (PIAAC)
In Canada, PIAAC was conducted by Statistics Canada and made possible by the joint effort of the ministers of education of the provinces and territories, through the Council of Ministers of Education (Canada), and the Government of Canada, led by Employment and Skills Development Canada. The data collection took place from November 2011 to June 2012. The sample size for Canada was exceptionally large, at 27,285 individuals. This size was necessary to permit statistically reliable results at the provincial and territorial levels, as well as for certain populations within these jurisdictions.
For this report, tables based on PIAAC data have been organized into a single indicator, E1. The tables and charts represent a selection of results from PIAAC that are included in Education at a Glance 2014: OECD Indicators. Not all EAG tables have been reproduced, and some have been modified due to the prevalence of low-quality estimates at the provincial/territorial level.
For definitions and background information about PIAAC in Canada, please refer to Skills in Canada: First Results from the Program for the International Assessment of Adult Competencies (PIAAC) or visit the PIAAC Web site @ www.piaac.ca.
This indicator measures proficiency of the adult population aged 25 to 64 in both literacy and numeracy against a series of factors: educational attainment, age, and gender; employment status and gender; self-reported social indicators (health, trust in others, volunteering, and political efficacy); and participation in formal and/or non-formal education and gender.
Proficiency
Proficiency is measured on a continuous scale that is divided into five levels (with an additional category, “below Level 1”), defined by a particular score-point range, where each level corresponds to a description of what adults with particular scores can do in concrete terms.
When possible, the OECD average is included. For this indicator, the OECD averages were derived from the results of 22 OECD member countries: Australia, Austria, Belgium (Flanders), Canada, the Czech Republic, Denmark, Estonia, Finland, France, Germany, Ireland, Italy, Japan, Korea, the Netherlands, Norway, Poland, the Slovak Republic, Spain, Sweden, the United Kingdom (England and Northern Ireland), and the United States.
Educational attainment
Educational attainment is categorized by completion of educational programs defined by International Standard Classification of Education (ISCED) levels, which are grouped as follows:
- below upper secondary corresponds to ISCED levels 0, 1, 2, and 3C short programmes;
- upper secondary or postsecondary non-tertiary corresponds to ISCED level 3C long programmes, and levels 3B, 3A, and 4;
- tertiary education corresponds to ISCED levels 5B, 5A, and 6.
An individual who has not successfully completed a programme is assigned the preceding education level.
Employment status
Employment status is defined by classifying individuals as employed, unemployed, or inactive.
- Employed individuals are those who, during the survey reference week, work for pay (employees) or profit (self-employed and unpaid family workers) for at least one hour; or have a job but are temporarily not at work (through injury, illness, holiday, strike or lock-out, educational or training leave, maternity or parental leave, etc.).
- Unemployed individuals are those who, during the survey reference week, are without work (i.e., neither had a job nor were at work for one hour or more in paid employment or self-employment), are actively seeking employment (i.e., had taken specific steps during the four weeks prior to the reference week to seek paid employment or self-employment), and are currently available to start work (i.e., are available for paid employment or self-employment before the end of the two weeks following the reference week).
- Inactive individuals are those who, during the survey reference week, are neither employed nor unemployed (i.e., not looking for a job). The number of inactive individuals is calculated by subtracting the number of active people (labour force) from the number of all working-age people.
The population identified by employment status is further divided into male and female.
Self-reported indicators
Self-reported social indicators comprise four categories:
- Health, which is measured by a respondent reporting that they are in excellent, very good, or good health
- Volunteering, which is measured by the engagement in a volunteer activity at least once a month
- Interpersonal trust, which is measured by strongly disagreeing or disagreeing that there are few people you can trust completely
- Political efficacy, which is a feeling that one has a say in government, as measured by strongly agreeing or agreeing with the statement: “People like me don't have any say about what the government does.”
Participation
Participation in formal and/or non-formal education is measured by an individual’s engagement with educational activity that falls into one of two categories:
- Formal education, which consists of institutionalised and planned education provided in schools, colleges, universities and other formal educational institutions, and which normally constitutes a continuous “ladder” of full-time education for children and young people. The providers may be public or private.
- Non-formal education, which consists of institutionalised and sustained educational activity that does not correspond exactly to the above definition of formal education. Non-formal education may therefore take place both within and outside educational institutions and cater to individuals of all ages. Depending on country contexts, it may cover education programmes in adult literacy, basic education for out-of-school children, life skills, work skills, and general culture. PIAAC uses a list of possible non-formal education activities to prompt respondents to list all of their learning activities during the previous 12 months. These include open or distant-learning courses, private lessons, organised sessions for on-the-job training, and workshops or seminars. Some of these activities might be of short duration.
The population identified by participation in formal and/or non-formal education is further divided into male and female.
- Date modified: