
First Nations youth: Experiences and outcomes in secondary and postsecondary learning
Skip to text
Text begins
Quality, culturally appropriate, and accessible education is essential to the preservation and prosperity of First Nations communities.Note However, as reported by the Truth and Reconciliation Commission (TRC), the legacy of residential schools, inadequate funding, and the absence of culturally relevant curricula has had a profound impact on the educational success of First Nations youth, particularly those living on reserve.Note Accordingly, First Nations peopleNote have strongly advocated for an equitable education system that provides adequate support throughout all stages of lifelong learning.
First Nations youth often take different educational pathways than non-Indigenous youth, as they are more likely to be young parents, live in low-income households, and live in rural areas than their non-Indigenous counterparts.Note As a result, First Nations youth may face additional challenges to acquiring further education, such as poorer access to educational institutions on reserve.Note
This fact sheet presents 2016 Census data on the educational participation of First Nations youth aged 19 to 30,Note in conjunction with characteristics that may affect their educational experience.Note This study is guided by the Truth and Reconciliation Commission’s Calls to Action, which recognizes the importance of equitable education in the success of Indigenous peoples and has called for regular reporting on the educational attainment of Indigenous peoples in Canada compared with non-Indigenous people.Note
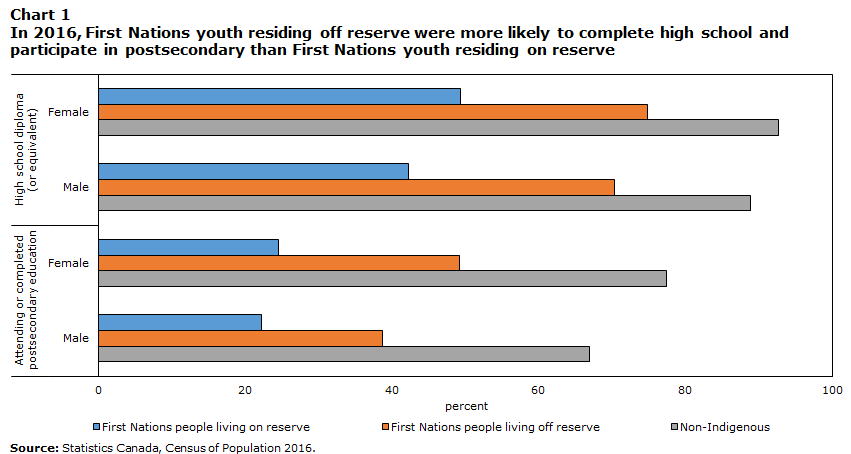
Non-Indigenous youth aged 19 to 30 were much more likely to graduate high school than First Nations youth
Overall educational engagement was higher for non-Indigenous youth than for First Nations youth, in terms of both high school completion and postsecondary participation (i.e., having either completed a postsecondary credential, or having attended postsecondary school in the 2015/2016 school year).
Just under two-thirds (63%) of all First Nations youth had completed high school, compared with 91% of the non-Indigenous population. First Nations youth living off reserve were more likely to obtain their high school diploma (73%) than First Nations youth living on reserve (46%). The latter result is likely linked to access, as nearly half of First Nations students do not have access to a high school on reserve, requiring them to leave their community to pursue education.Note Note
This pattern continued into postsecondary education, as non-Indigenous youth were nearly twice as likely (72%) to have completed or recently attended a postsecondary program as First Nations youth (37%). Moreover, among First Nations youth, those living off-reserve were nearly twice as likely to have participated in postsecondary education (44%) as those living on reserve (23%). Both First Nations and non-Indigenous women were more likely to have attained their high school diploma and participated in postsecondary education than their male counterparts, with the exception of postsecondary participation for those living on reserve.
Data table for Chart 1
| Attending or completed postsecondary education | High school diploma (or equivalent) |
|||
|---|---|---|---|---|
| Male | Female | Male | Female | |
| percent | ||||
| First Nations people living on reserve | 22.21 | 24.62 | 42.30 | 49.31 |
| First Nations people living off reserve | 38.77 | 49.19 | 70.35 | 74.85 |
| Non-Indigenous | 66.94 | 77.34 | 88.82 | 92.62 |
| Source: Statistics Canada, Census of Population 2016. | ||||
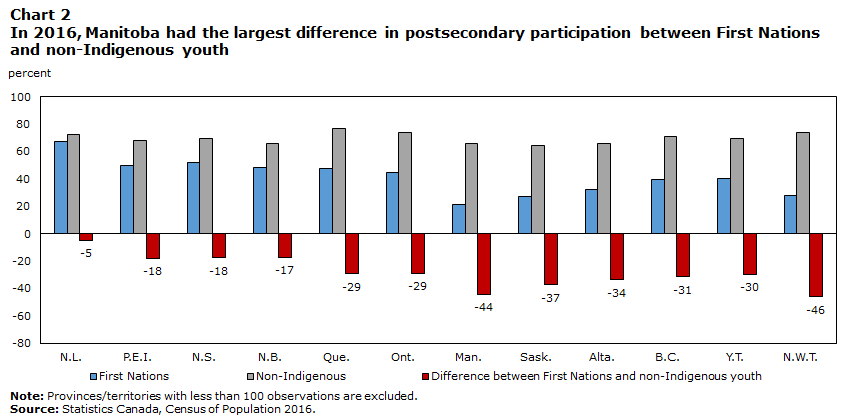
Differences in high school completion between First Nations and non-Indigenous people were smallest in the Atlantic provinces and largest in the Prairies
In terms of both high school completion and postsecondary participation, differences in educational attainment between First Nations and non-Indigenous youth were largest in the Prairie provinces and smallest in the Atlantic provinces. First Nations postsecondary participation, for instance, is three times higher in Newfoundland and Labrador (67%) than in Manitoba (21%).
However, this result is likely due to the relatively large proportion of First Nations youth residing on reserve in Manitoba (48%), Saskatchewan (46%), and Alberta (34%) relative to the Canadian average (33%). These provinces are characterized by the largest difference in postsecondary participation between First Nations and non-Indigenous youth (44-percentage points, 37-percentage-poinst, and 33-percentage-points, respectively).
Conversely, First Nations youth make up a small share of the young population in Newfoundland and Labrador (7%) and Prince Edward Island (2%) where an even smaller share of First Nations people lived on reserve (11% and 28%, respectively). The overall gap in postsecondary participation between First Nations and non-Indigenous youth in these provinces are also smaller (5-percentage-points and 18-percentage-points, respectively).
Data table for Chart 2
| Postsecondary participation | First Nations | Non-Indigenous | Difference between First Nations and non-Indigenous youth |
|---|---|---|---|
| percent | |||
| N.L. | 67.45 | 72.26 | -5 |
| P.E.I. | 50.00 | 68.01 | -18 |
| N.S. | 51.52 | 69.35 | -18 |
| N.B. | 48.53 | 65.74 | -17 |
| Que. | 47.19 | 76.41 | -29 |
| Ont. | 44.59 | 73.46 | -29 |
| Man. | 21.05 | 65.42 | -44 |
| Sask. | 27.07 | 64.49 | -37 |
| Alta. | 32.35 | 66.08 | -34 |
| B.C. | 39.17 | 70.64 | -31 |
| Y.T. | 40.09 | 69.64 | -30 |
| N.W.T. | 27.95 | 73.99 | -46 |
|
Note: Provinces/territories with less than 100 observations are excluded. Source: Statistics Canada, Census of Population 2016. |
|||
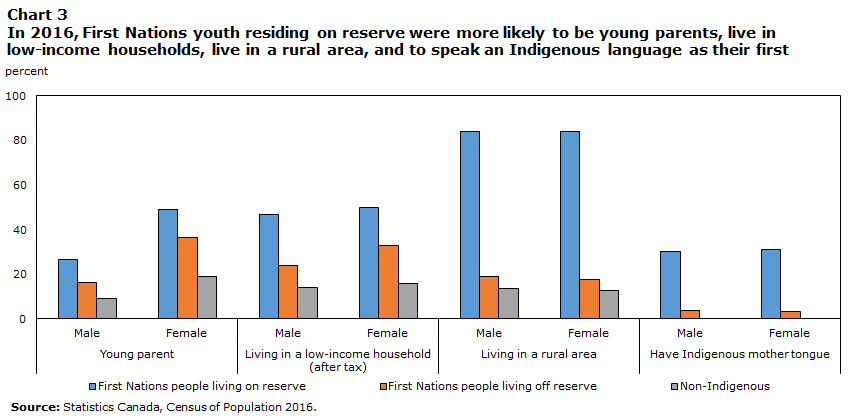
Financial and geographical challenges were negatively associated with high school completion and postsecondary participation
First Nations youth differ in many ways from other youth in Canada: as of 2016, they were more likely to be young parents, live in low-income households, and live in rural areas than their non-Indigenous counterparts (Chart 5). Additionally, First Nations youth are likely to speak an Indigenous language as their first language. This may contribute to cultural connectedness which can be a protective factor for First Nations youth, as they may benefit from a stronger link to their culture, tradition, language, and land.Note These characteristics are factors in the high school and postsecondary education experiences and outcomes of First Nations youth.Note
One-third (33%) of First Nations youth lived on reserveNote , where these characteristics are more pronounced. On reserve, nearly half (48%) of First Nations women aged 19 to 30 were parents, as were one quarter (26%) of men. Young men and women with children face additional costs and responsibilities of raising children, potentially impacting their decision to attend school or join the labour market. Additionally, half (48%) of First Nations youth living on reserve were living in low-income households (after tax). Previous studies have established that youth from low-income households tend to have lower levels of educational attainment, as they face additional constraints to participating in education.Note For example, youth from low-income households tend to have less access to high-quality schools and extra-curricular programs, which positively impact educational outcomes.Note
More than eight in ten (83%) of First Nations youth who lived on reserve were in rural areas, while 18% of First Nations youth who lived off reserve were in rural areas. In comparison, just over 1 in 10 (13%) non-Indigenous youth live in rural areas. Those residing in rural areas tend to have access to fewer essential services, including health care and educational facilities.Note This is the case for many First Nations youth, as 70% of First Nations communities had fewer than 500 inhabitants.Note Due to their relatively low population density, smaller communities may have to rely on larger urban centres to access education. This commute can be distant and costly, impacting participation in education.Note
Although the remoteness of living on reserve poses challenges in accessing services, it does afford opportunities to connect with community and culture through language. Overall, just over one in ten (12%) of First Nations youth spoke an Indigenous language as their first language.Note Approximately one third (30%) of First Nations people living on reserve spoke an Indigenous language as their first, a much larger proportion than those residing off reserve (3%).
These characteristics intersect with one another – ultimately influencing the context of learning and, subsequently, the educational outcomes of First Nations youth.
Data table for Chart 3
| First Nations people living on reserve | First Nations people living off reserve | Non-Indigenous | ||||
|---|---|---|---|---|---|---|
| Male | Female | Male | Female | Male | Female | |
| percent | ||||||
| Young parent | 26.51 | 48.91 | 16.26 | 36.33 | 9.16 | 19.00 |
| Living in a low income household (after tax) | 46.68 | 49.70 | 23.88 | 32.70 | 13.92 | 15.59 |
| Living in a rural area | 83.98 | 83.82 | 18.93 | 17.69 | 13.32 | 12.60 |
| Have Indigenous mother tongue | 30.07 | 30.92 | 3.47 | 3.43 | Note ...: not applicable | Note ...: not applicable |
|
... not applicable Source: Statistics Canada, Census of Population 2016. |
||||||
Generally, high school completion and postsecondary participation are lower for those who face these additional challenges in accessing education (e.g., financial, familial, or geographical). A larger share of First Nations youth, relative to non-Indigenous youth, faced these challenges, which are negatively associated with high school completion and postsecondary participation. Nonetheless, First Nations women consistently had higher educational participation than First Nations men, despite being more likely than men to be young parents and living in low-income.
| High school diploma (or equivalent) | Attending or completed postsecondary education | |||
|---|---|---|---|---|
| Male | Female | Male | Female | |
| percent | ||||
| Young parents | 49.08 | 57.18 | 29.84 | 32.62 |
| Non-parents | 63.45 | 73.36 | 33.80 | 47.46 |
| Living in low-income households | 44.09 | 52.26 | 21.87 | 27.40 |
| Not living in low-income households | 68.21 | 75.67 | 38.15 | 50.02 |
| Living in a rural area | 50.39 | 57.59 | 27.01 | 31.48 |
| Not living in a rural area | 67.86 | 72.62 | 37.28 | 47.73 |
| Source: Statistics Canada, Census of Population 2016 | ||||
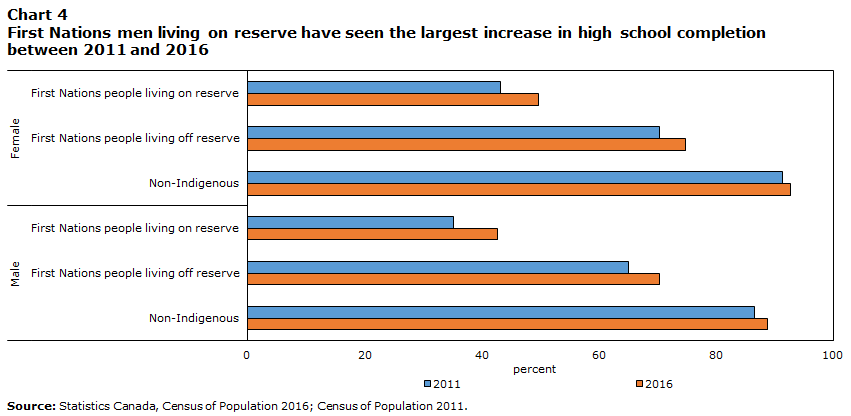
High school completion and postsecondary participation for First Nations youth are increasing over timeNote
First Nations youth have similar hopes and aspirations for formal education as non-Indigenous youth.Note Over time, overall high school completion has increased, more so for First Nations youth than for non-Indigenous youth. For example, while First Nation men had the lowest level of high school completion in 2011 (35%), they saw the greatest increases between 2011 and 2016 (+8-percentage-points). First Nations youth living on reserve have also seen the greatest increase in postsecondary participation, compared with 2011 (+3-percentage-points).
Data table for Chart 4
| High school diploma (or equivalent) | 2011 | 2016 | ||
|---|---|---|---|---|
| Male | Female | Male | Female | |
| percent | ||||
| First Nations people living on reserve | 35.23 | 43.22 | 42.59 | 49.64 |
| First Nations people living off reserve | 65.12 | 70.26 | 70.35 | 74.85 |
| Non-Indigenous | 86.63 | 91.29 | 88.82 | 92.62 |
| Source: Statistics Canada, Census of Population 2016; Census of Population 2011. | ||||
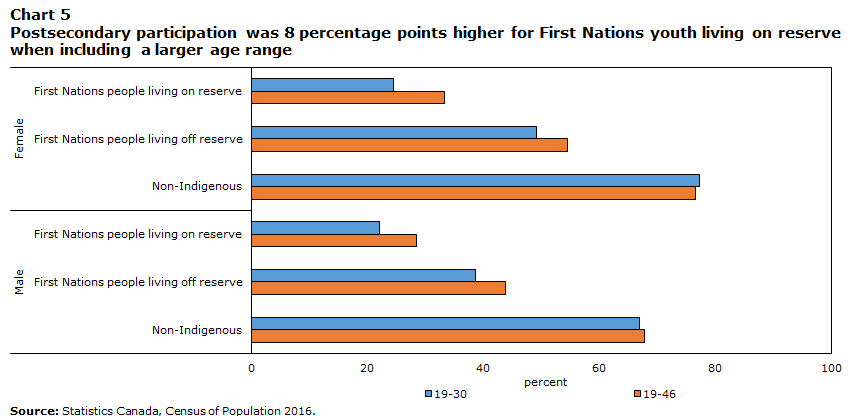
Postsecondary participation for First Nations people increased by 8-percentage-points when including individuals aged up to 46
First Nations people participate in a practice of lifelong learning, and as a result, may take alternative pathways to education.Note Accordingly, the age of thirty may be too early to determine if an individual will finish high school or participate in postsecondary education. When expanding the analysis to include a larger age range of First Nations individuals (i.e., aged 19 to 46), high school completion rates and postsecondary participation rates increased for First Nations people, particularly those living on reserve. This was not observed for non-Indigenous people in this age range.
Notably, overall postsecondary participation for First Nations people on reserve was 8-percentage-points higher when considering individuals aged 19 to 46, versus 19 to 30 years. Conversely, postsecondary participation for non-Indigenous individuals remained within 1 percentage point of the narrower age range.
Data table for Chart 5
| 19-30 | 19-46 | Difference between cycles | Cycle-over-cycle percent change | |||||
|---|---|---|---|---|---|---|---|---|
| Male | Female | Male | Female | Male | Female | Male | Female | |
| percent | ||||||||
| First Nations people living on reserve | 22.21 | 24.62 | 28.54 | 33.43 | 6.33 | 8.81 | 28.50 | 35.81 |
| First Nations people living off reserve | 38.77 | 49.19 | 43.94 | 54.59 | 5.18 | 5.40 | 13.36 | 10.98 |
| Non-Indigenous | 66.94 | 77.34 | 67.77 | 76.56 | 0.83 | -0.78 | 1.24 | -1.01 |
| Source: Statistics Canada, Census of Population 2016. | ||||||||
Conclusion
There are many factors that affect an individual’s ability to pursue their education. First Nations youth are more likely than non-Indigenous youth to be young parents, live in low-income (after-tax) households, and live in rural areas. A greater proportion of First Nations youth living on reserve face financial and geographical challenges, resulting in a larger disparity in educational attainment relative to non-Indigenous youth. Additionally, the legacy of colonialism, inadequate funding, lack of access to educational facilities on reserve, culturally irrelevant curricula and the impact of intergenerational trauma are determinants of education that cannot be ignored,Note although their direct effect is beyond the scope of this analysis.
In 2016, consistently, First Nations women engaged in education at higher levels than First Nations men, despite representing a larger share of those who were young parents and lived in low-income households. Further examination of the experiences of First Nations men is necessary to understand their relatively lower levels of educational engagement and to provide subsequent solutions. However, both First Nations men and women were found to pursue education later into life compared with non-Indigenous people. This information can inform the supports offered to First Nations youth to be inclusive of lifelong learners.
This study provides a profile of characteristics that are relevant to the learning context of First Nations youth. However, other research questions remain, including: do students have access to education in their community? Do student parents have support for childcare while completing their studies? Do students have adequate funding from their bands? These questions are relevant for policy makers, particularly in attempting to identify persistent barriers and offer support for First Nations students living on reserve. Finally, measures of success as defined by First Nations, such as ancestral language efficacy and cultural connectedness could be explored and reported on.
With the release of the 2021 Census of Population, these indicators can be replicated to assess how First Nations educational engagement has evolved over the past five years. The ongoing reporting of these education indicators is paramount in ensuring First Nations youth have adequate supports in their educational endeavours.
Start of text boxThe future of First Nations education
First Nations students have the inherent and Treaty right to receive education that is in accordance with their culture, values, traditions, and languages and that is free of prejudice and discrimination. Quality and culturally appropriate education are a cornerstone to the preservation and vitality of First Nations societies and to the realization of other fundamental human rights of First Nations students.
First Nations organizations have identified the following measures to facilitate improved education outcomes for youth: funding targeted to First Nations needs and circumstances, consideration of First Nations children’s cultural, linguistic, and geographical needs and historical realities; providing agency for First Nations in the education system in all stages of lifelong learning to foster increased First Nations enrollment, retention, and graduation rates.
In 2019, the federal government replaced its proposal-based education programs with regional education approaches and funding models. First Nations are now able to develop their own local, regional and/or Treaty based education agreements that enable the implementation of their vision for First Nations education. In 2021, seven Regional Education Agreements (REA) have been signed and concluded, three are near completion, and 46 REAs are underway.
Source: Assembly of First Nations, 2022.
Acknowledgements
We acknowledge the contribution of the Assembly of First Nations (AFN) to this paper. Their knowledge, guidance and feedback are greatly appreciated.
Appendix
| High school diploma (or equivalent) | Attending or completed postsecondary education | |||||
|---|---|---|---|---|---|---|
| Male | Female | Total | Male | Female | Total | |
| percent | ||||||
| First Nations people living on reserve | 42.30 | 49.31 | 45.72 | 22.21 | 24.62 | 23.37 |
| First Nations people living off reserve | 70.35 | 74.85 | 72.72 | 38.77 | 49.19 | 44.26 |
| Non-Indigenous | 88.82 | 92.62 | 90.70 | 66.94 | 77.34 | 72.08 |
| Source: Statistics Canada, Census of Population 2016. | ||||||
| Population of First Nations Peoples | Total population | Proportion of First Nations Peoples | |
|---|---|---|---|
| number | percent | ||
| Newfoundland and Labrador | 4,655 | 67,060 | 7 |
| Prince Edward Island | 410 | 19,365 | 2 |
| Nova Scotia | 5,115 | 129,665 | 4 |
| New Brunswick | 3,225 | 95,390 | 3 |
| Quebec | 16,040 | 1,177,820 | 1 |
| Ontario | 45,075 | 2,101,065 | 2 |
| Manitoba | 24,795 | 202,660 | 12 |
| Saskatchewan | 22,385 | 173,440 | 13 |
| Alberta | 27,855 | 677,215 | 4 |
| British Columbia | 32,170 | 701,360 | 5 |
| Yukon | 1,160 | 5,330 | 22 |
| Northwest Territories | 2,630 | 7,630 | 34 |
| Nunavut | 50 | 7,370 | 1 |
| Total | 185,575 | 5,365,375 | 3 |
| Source: Statistics Canada, Census of Population 2016. | |||
| First Nations | Non-Indigenous | |
|---|---|---|
| percent | ||
| High school diploma or equivalent | ||
| Newfoundland and Labrador | 85.61 | 91.50 |
| Prince Edward Island | 87.80 | 94.23 |
| Nova Scotia | 79.77 | 92.26 |
| New Brunswick | 82.95 | 92.87 |
| Quebec | 54.77 | 85.13 |
| Ontario | 70.27 | 92.48 |
| Manitoba | 49.67 | 92.35 |
| Saskatchewan | 58.25 | 92.45 |
| Alberta | 56.58 | 90.52 |
| British Columbia | 72.88 | 93.58 |
| Yukon | 67.67 | 92.47 |
| Northwest Territories | 55.89 | 92.96 |
| Attending or completed postsecondary education | ||
| Newfoundland and Labrador | 67.45 | 72.26 |
| Prince Edward Island | 50.00 | 68.01 |
| Nova Scotia | 51.52 | 69.35 |
| New Brunswick | 48.53 | 65.74 |
| Quebec | 47.19 | 76.41 |
| Ontario | 44.59 | 73.46 |
| Manitoba | 21.05 | 65.42 |
| Saskatchewan | 27.07 | 64.49 |
| Alberta | 32.35 | 66.08 |
| British Columbia | 39.17 | 70.64 |
| Yukon | 40.09 | 69.64 |
| Northwest Territories | 27.95 | 73.99 |
|
Note: Provinces/territories with less than 100 observations are excluded. Source: Statistics Canada, Census of Population 2016. |
||
| First Nations people living on reserve | First Nations people living off reserve | Non-Indigenous | ||||
|---|---|---|---|---|---|---|
| Male | Female | Male | Female | Male | Female | |
| percent | ||||||
| Young parent | 26.51 | 48.91 | 16.26 | 36.33 | 9.16 | 19.00 |
| Living in a low-income household (after tax) | 46.68 | 49.70 | 23.88 | 32.70 | 13.92 | 15.59 |
| Living in a rural area | 83.98 | 83.82 | 18.93 | 17.69 | 13.32 | 12.60 |
| Living in a population centre | 16.02 | 16.18 | 81.07 | 82.31 | 86.68 | 87.40 |
| Have Indigenous mother tongue | 30.07 | 30.92 | 3.47 | 3.43 | Note ...: not applicable | Note ...: not applicable |
|
... not applicable Source: Statistics Canada, Census of Population 2016. |
||||||
| 2011 | 2016 | Difference between cycles | Cycle-over-cycle percent change | |||||
|---|---|---|---|---|---|---|---|---|
| Male | Female | Male | Female | Male | Female | Male | Female | |
| percent | ||||||||
| High school diploma (or equivalent) | ||||||||
| First Nations people living on reserve | 35.23 | 43.22 | 42.59 | 49.64 | 7.36 | 6.41 | 20.88 | 14.84 |
| First Nations people living off reserve | 65.12 | 70.26 | 70.35 | 74.85 | 5.23 | 4.59 | 8.04 | 6.53 |
| Non-Indigenous | 86.63 | 91.29 | 88.82 | 92.62 | 2.20 | 1.34 | 2.53 | 1.46 |
| Attending or completed postsecondary education | ||||||||
| First Nations people living on reserve | 19.31 | 21.50 | 22.24 | 24.60 | 2.93 | 3.09 | 15.19 | 14.38 |
| First Nations people living off reserve | 38.23 | 47.66 | 38.77 | 49.19 | 0.54 | 1.53 | 1.40 | 3.21 |
| Non-Indigenous | 65.93 | 75.96 | 66.94 | 77.34 | 1.01 | 1.39 | 1.53 | 1.82 |
| Source: Statistics Canada, Census of Population 2016; Census of Population 2011. | ||||||||
| 19-30 | 19-46 | Difference between cycles | Cycle-over-cycle percent change | |||||
|---|---|---|---|---|---|---|---|---|
| Male | Female | Male | Female | Male | Female | Male | Female | |
| percent | ||||||||
| High school diploma (or equivalent) | ||||||||
| First Nations people living on reserve | 42.30 | 49.31 | 43.09 | 53.43 | 0.79 | 4.12 | 1.87 | 8.35 |
| First Nations people living off reserve | 70.35 | 74.85 | 69.91 | 76.46 | -0.44 | 1.61 | -0.63 | 2.16 |
| Non-Indigenous | 88.82 | 92.62 | 88.33 | 92.18 | -0.49 | -0.44 | -0.56 | -0.47 |
| Attending or completed postsecondary education | ||||||||
| First Nations people living on reserve | 22.21 | 24.62 | 28.54 | 33.43 | 6.33 | 8.81 | 28.50 | 35.81 |
| First Nations people living off reserve | 38.77 | 49.19 | 43.94 | 54.59 | 5.18 | 5.40 | 13.36 | 10.98 |
| Non-Indigenous | 66.94 | 77.34 | 67.77 | 76.56 | 0.83 | -0.78 | 1.24 | -1.01 |
| Source: Statistics Canada, Census of Population 2016. | ||||||||
- Date modified: