
The impact of the COVID-19 pandemic on the proportion of youth not in employment, education or training: A regional analysis and international perspective
Skip to text
Text begins
Introduction
The proportion of youth not in employment, education or training (NEET) is an indicator that is used worldwide to identify youth at risk of social disconnection and exclusion during their transition from education to employment.
Over the course of the pandemic, measures put in place to prevent the spread of COVID-19 posed unprecedented disruptions for youth aged 15 to 29 with the shift to virtual learning, loss of employment opportunities and the decline of mental health and wellbeing.Note NEET rates for youth aged 15 to 29 increased in response to these changing economic and social conditions.Note While the economic fallout that resulted from the global health crisis has reached far and wide – the international, regional, and individual impacts on NEET rates are varied.
This fact sheet presents data from the Labour Force Survey (LFS) and the Organisation for Economic Co-operation and Development (OECD) between 2019 and 2021. The data is presented by age group, selected OECD member country, province/territory and individual characteristics to better understand youth transitions between education and the labour market in Canada before and during the first two years of the pandemic.
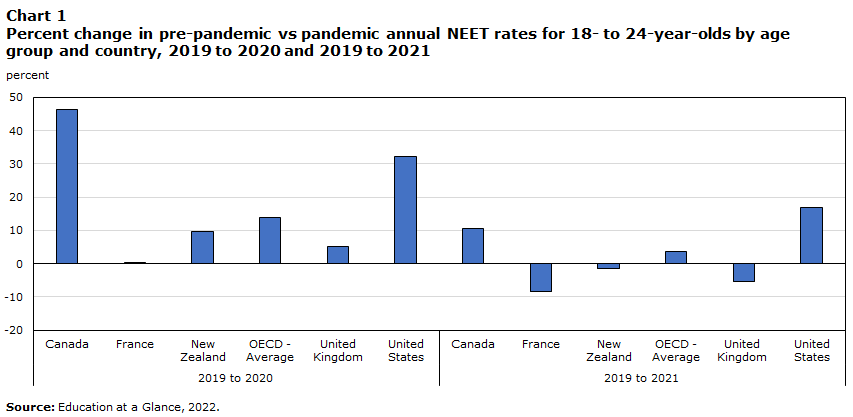
The increase in NEET rates was greater in Canada and the United States during the first year of the pandemic, relative to other OECD member countries
Prior to the pandemic, Canada’s NEET rate was 13 percent, compared with the OECD average of 14 percent in 2019.Note Across OECD member countries, the annual NEET rate increased by 14 percent for youth aged 18 to 24 from 2019 to 2020.Note The largest increases in youth NEET among the selected OECD countries were seen in Canada and the United States, where the NEET rates increased by 46 and 33 percent respectively, over the first year of the pandemic.
Data table for Chart 1
| 18 to 24 | |
|---|---|
| percent | |
| 2019 to 2020 | |
| Canada | 46.47 |
| France | 0.00 |
| New Zealand | 9.55 |
| OECD - Average | 13.81 |
| United Kingdom | 5.22 |
| United States | 32.30 |
| 2019 to 2021 | |
| Canada | 10.45 |
| France | -8.44 |
| New Zealand | -1.62 |
| OECD - Average | 3.71 |
| United Kingdom | -5.36 |
| United States | 16.74 |
| Source: Education at a Glance, 2022. | |
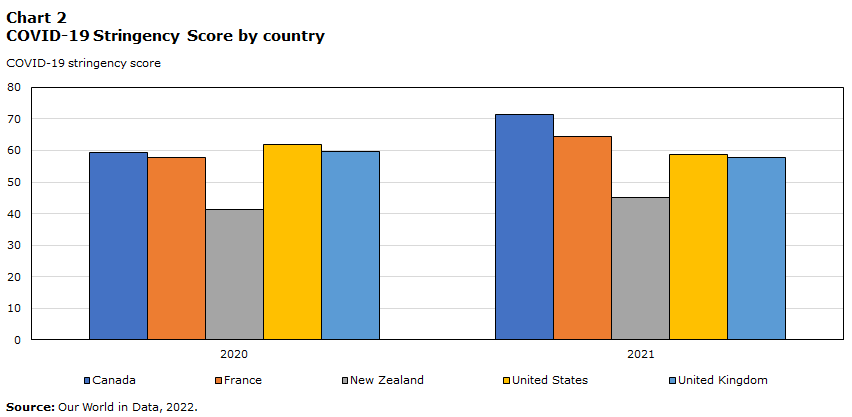
Canada experienced stricter health measures in 2021, affecting youth in jobs impacted by these restrictions
Around the globe, countries enacted public health measures that could potentially affect NEET rates, either through the transition to remote learning or restrictions that affected employment. The stringency of public health measures among the selected countries was relatively similar in 2020, but in 2021 Canada recorded higher stringency scores (71.2 compared with an average of 59.4 in the selected countries) according to the international COVID-19 stringency index.Note
Data table for Chart 2
| 2020 | 2021 | |
|---|---|---|
| COVID-19 stringency score | ||
| Canada | 59.36 | 71.28 |
| France | 57.92 | 64.55 |
| New Zealand | 41.36 | 45.16 |
| United States | 61.81 | 58.61 |
| United Kingdom | 59.58 | 57.72 |
| Source: Our World in Data, 2022. | ||
The effects of these restrictions may differ because of the types of jobs typically held by youth in a given country. Canada, the United Kingdom and the United States are largely characterized by a deregulated labour market, with many entry-level jobs.Note Youth in these countries were employed in industries that may have been more affected by measures implemented to prevent the spread of COVID-19.Note Therefore, in Canada, youth may have been comparatively worse off due to their relatively high concentration in industries that were hit hard by public health measures.
By 2021, the NEET rate had returned to levels comparable to before the pandemic for all the selected OECD countries.Note This result followed the implementation of various government measures to support young people back into education and the labour market, the easing of pandemic-related restrictions, and broader economic recovery.Note
Ontario and Quebec had the highest stringency scores during the COVID-19 pandemic, impacting economic and education opportunities for youth
Within Canada, the impact of the COVID-19 pandemic on NEET rates varied among the provinces and territories and across age groups. One of the reasons for this variation is that public health measures are applied at the provincial/territorial level and differed in terms of stringency, timing and duration. Ontario and Quebec consistently had the highest stringency scores among the provinces, indicating more severe measures were in place.Note The prairies, alternatively, scored the lowest. In addition to posing disruptions to learning, recent research found that tighter public health restrictions on business and personal activity were associated with a slowing of economic activity in Canada, impacting youth employment.Note Note

Data table for Chart 3
| 2020 | 2021 | |
|---|---|---|
| COVID-19 stringency score | ||
| Newfoundland and Labrador | 37.58 | 39.42 |
| Prince Edward Island | 40.67 | 34.52 |
| Nova Scotia | 38.82 | 39.56 |
| New Brunswick | 40.27 | 35.34 |
| Quebec | 44.20 | 48.67 |
| Ontario | 46.37 | 52.53 |
| Manitoba | 43.18 | 46.83 |
| Saskatchewan | 37.04 | 29.04 |
| Alberta | 33.85 | 34.72 |
| British Columbia | 31.71 | 34.34 |
| Yukon | 34.74 | 30.96 |
| Northwest Territories | 37.75 | 35.94 |
| Nunuvat | 39.66 | 37.62 |
| Source: Clarke et al., Statistics Canada, 2020 and 2021. | ||
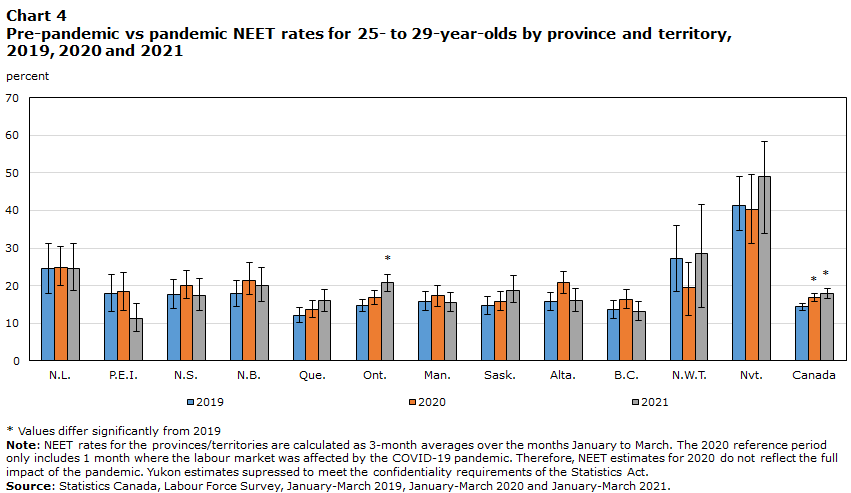
Atlantic “bubble” provided labour market protection for 25- to 29-year-olds, while those in Quebec, Ontario experience extended lockdowns and unfavourable labour market conditions
There is evidence that the so-called Atlantic “bubble” experienced less of an economic impact since the onset of the pandemic.Note The public health measures in place resulted in fewer restrictions for businesses and schools, which is reflected in the relatively low stringency scores of the Atlantic provinces (39.3 in 2020 and 37.2 in 2021). Youth employment in New Brunswick and Newfoundland and Labrador exceeded pre-pandemic levels in 2021 and NEET rates were stable.
Similarly, British Columbia had a relatively low stringency score in 2020 (31.7) and 2021 (34.3) and experienced the strongest employment recovery in Canada between 2020 and 2021, where the number of operational businesses has surpassed pre-pandemic levels.Note Consequently, the NEET rate for 25- to 29-year-olds in British Columbia remained stable from 2019 to 2021.
Higher stringency scores in Ontario (46.3 in 2020 and 52.5 in 2021) and Quebec (44.2 in 2020 and 48.6 in 2021), conversely, were linked to lower employment levels than in 2019.Note In Quebec, the NEET rate for youth aged 25 to 29 increased from 12 to 16 percent between 2019 and 2021. In Ontario, youth aged 25 to 29 also felt the repercussions of pandemic conditions into 2021 with one in five (20.7%) Ontario youth in NEET in 2021, compared with one in seven (14.6%) in 2019.
Data table for Chart 4
| NEET rate | 95% confidence interval down | 95% confidence interval up | |
|---|---|---|---|
| percent | |||
| 2019 | |||
| Newfoundland and Labrador | 24.55 | 6.59 | 6.72 |
| Prince Edward Island | 17.90 | 4.71 | 4.92 |
| Nova Scotia | 17.63 | 3.66 | 3.98 |
| New Brunswick | 17.81 | 3.47 | 3.64 |
| Quebec | 12.02 | 1.89 | 2.04 |
| Ontario | 14.64 | 1.64 | 1.72 |
| Manitoba | 15.86 | 2.48 | 2.56 |
| Saskatchewan | 14.67 | 2.38 | 2.40 |
| Alberta | 15.63 | 2.22 | 2.43 |
| British Columbia | 13.67 | 2.52 | 2.38 |
| Northwest Territories | 27.32 | 9.00 | 8.64 |
| Nunavut | 41.40 | 6.64 | 7.61 |
| Canada | 14.39 | 0.91 | 0.91 |
| 2020 | |||
| Newfoundland and Labrador | 24.91 | 5.00 | 5.49 |
| Prince Edward Island | 18.37 | 4.94 | 5.08 |
| Nova Scotia | 20.02 | 3.56 | 3.96 |
| New Brunswick | 21.46 | 3.95 | 4.74 |
| Quebec | 13.72 | 2.12 | 2.31 |
| Ontario | 16.80 | 1.72 | 1.76 |
| Manitoba | 17.26 | 2.85 | 2.82 |
| Saskatchewan | 15.88 | 2.48 | 2.65 |
| Alberta | 20.79 | 2.82 | 2.86 |
| British Columbia | 16.21 | 2.38 | 2.77 |
| Northwest Territories | 19.42 | 7.51 | 6.77 |
| Nunavut | 40.35 | 9.10 | 9.15 |
| Canada | 16.81Note * | 0.95 | 1.00 |
| 2021 | |||
| Newfoundland and Labrador | 24.51 | 5.95 | 6.70 |
| Prince Edward Island | 11.26 | 3.57 | 4.01 |
| Nova Scotia | 17.40 | 4.14 | 4.35 |
| New Brunswick | 19.95 | 4.32 | 4.80 |
| Quebec | 16.11 | 3.05 | 2.83 |
| Ontario | 20.78Note * | 2.29 | 2.15 |
| Manitoba | 15.58 | 2.55 | 2.55 |
| Saskatchewan | 18.74 | 3.20 | 3.83 |
| Alberta | 16.15 | 3.01 | 3.14 |
| British Columbia | 13.14 | 2.55 | 2.72 |
| Northwest Territories | 28.46 | 14.27 | 13.17 |
| Nunavut | 49.08 | 15.29 | 9.27 |
| Canada | 17.91Note * | 1.32 | 1.24 |
Source: Statistics Canada, Labour Force Survey, January-March 2019, January-March 2020 and January-March 2021. |
|||
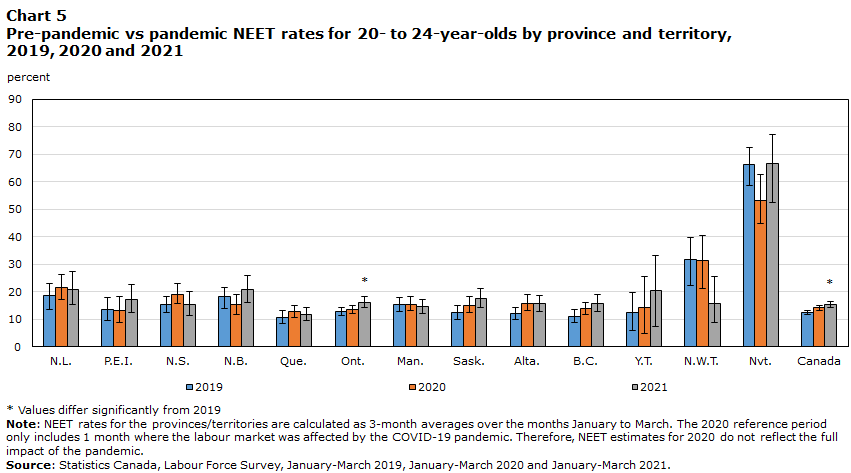
Prairie provinces saw the greatest sustained increase in NEET for youth aged 20 to 24
For youth aged 20 to 24, changes in the labour market were also a factor that affected the NEET rate. For example, Alberta’s economy was the hardest hit over the pandemic due to the economic downturn in the energy sector, which resulted in lower levels of employment for youth.Note In this province, youth aged 20 to 24 experienced a sustained increase in the NEET rates relative to 2019 (four percentage points higher in both 2020 and 2021). Economic disruptions had a similar impact in Saskatchewan where the NEET rate increased by six percentage points in 2021, relative to pre-pandemic levels.Note
Data table for Chart 5
| NEET rate | 95% confidence interval down | 95% confidence interval up | |
|---|---|---|---|
| percent | |||
| 2019 | |||
| Newfoundland and Labrador | 18.62 | 5.06 | 4.53 |
| Prince Edward Island | 13.56 | 4.07 | 4.30 |
| Nova Scotia | 15.27 | 2.99 | 3.07 |
| New Brunswick | 18.07 | 4.32 | 3.61 |
| Quebec | 10.53 | 2.04 | 2.47 |
| Ontario | 12.73 | 1.48 | 1.60 |
| Manitoba | 15.37 | 2.63 | 2.66 |
| Saskatchewan | 12.30 | 2.61 | 2.50 |
| Alberta | 11.95 | 2.08 | 2.33 |
| British Columbia | 11.13 | 2.20 | 2.37 |
| Yukon | 12.55 | 6.51 | 7.31 |
| Northwest Territories | 31.56 | 9.35 | 8.23 |
| Nunavut | 66.16 | 7.59 | 6.39 |
| Canada | 12.36 | 0.83 | 0.94 |
| 2020 | |||
| Newfoundland and Labrador | 21.53 | 4.47 | 4.56 |
| Prince Edward Island | 13.24 | 4.33 | 4.96 |
| Nova Scotia | 19.14 | 3.62 | 3.86 |
| New Brunswick | 15.17 | 3.30 | 3.73 |
| Quebec | 12.71 | 2.05 | 2.18 |
| Ontario | 13.56 | 1.44 | 1.46 |
| Manitoba | 15.48 | 2.50 | 2.91 |
| Saskatchewan | 15.13 | 2.63 | 2.95 |
| Alberta | 15.80 | 2.78 | 3.15 |
| British Columbia | 13.85 | 2.27 | 2.29 |
| Yukon | 14.12 | 9.20 | 11.39 |
| Northwest Territories | 31.35 | 10.21 | 9.16 |
| Nunavut | 53.23 | 8.58 | 9.38 |
| Canada | 14.11 | 0.89 | 0.94 |
| 2021 | |||
| Newfoundland and Labrador | 20.64 | 5.46 | 6.83 |
| Prince Edward Island | 17.32 | 5.01 | 5.25 |
| Nova Scotia | 15.31 | 3.93 | 4.62 |
| New Brunswick | 20.72 | 4.67 | 5.11 |
| Quebec | 11.81 | 2.23 | 2.52 |
| Ontario | 16.15Note * | 1.78 | 1.92 |
| Manitoba | 14.58 | 2.64 | 2.67 |
| Saskatchewan | 17.57 | 3.42 | 3.76 |
| Alberta | 15.76 | 2.80 | 2.89 |
| British Columbia | 15.84 | 3.12 | 3.00 |
| Yukon | 20.31 | 12.85 | 13.01 |
| Northwest Territories | 15.83 | 7.12 | 9.74 |
| Nunavut | 66.68 | 14.14 | 10.71 |
| Canada | 15.36Note * | 1.00 | 1.08 |
Source: Statistics Canada, Labour Force Survey, January-March 2019, January-March 2020 and January-March 2021. |
|||
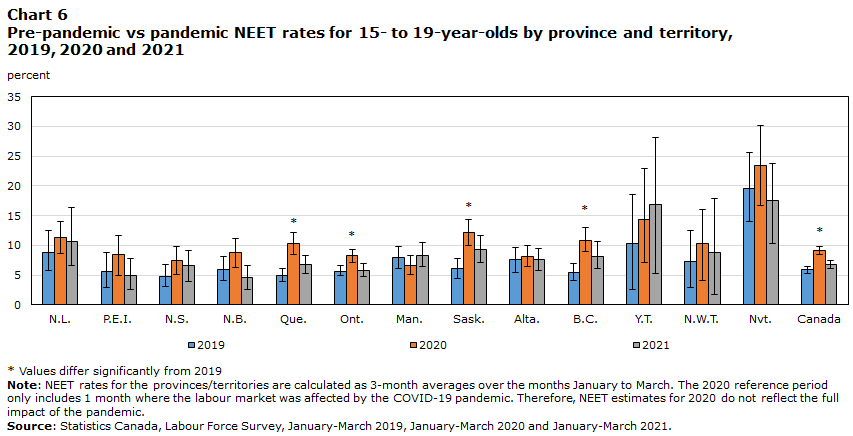
Youth aged 15 to 19 in Quebec, Saskatchewan and British Columbia most impacted by school closures
The youngest age group of 15- to 19-year-olds were most likely to be in school, and thus were likely the most affected by the school closures that occurred at the outset of the COVID-19 pandemic. Relative to pre-pandemic NEET rates in 2019, the largest increases in 2020 were observed in Quebec (4.9 to 10.3%), Saskatchewan (6.0 to 12.0%) and British Columbia (5.4 to 10.7%). The increase in the NEET rate was primarily due to a decline in youth participating in education across Canada between 2019 and 2020 (-3.8 percentage points), likely due to changes in the delivery of education rather than youth leaving school entirely.Note By 2021, however, those aged 15 to 19 generally returned to education.
Data table for Chart 6
| NEET rate | 95% confidence interval down | 95% confidence interval up | |
|---|---|---|---|
| percent | |||
| 2019 | |||
| Newfoundland and Labrador | 8.87 | 3.02 | 3.55 |
| Prince Edward Island | 5.63 | 2.73 | 3.15 |
| Nova Scotia | 4.79 | 1.77 | 1.93 |
| New Brunswick | 6.00 | 1.89 | 2.10 |
| Quebec | 4.96 | 1.12 | 1.06 |
| Ontario | 5.68 | 0.80 | 1.00 |
| Manitoba | 7.94 | 1.79 | 1.91 |
| Saskatchewan | 6.08 | 1.68 | 1.71 |
| Alberta | 7.62 | 2.20 | 2.08 |
| British Columbia | 5.44 | 1.36 | 1.56 |
| Yukon | 10.23 | 7.62 | 8.33 |
| Northwest Territories | 7.30 | 4.38 | 5.17 |
| Nunavut | 19.59 | 5.52 | 6.03 |
| Canada | 5.89 | 0.56 | 0.52 |
| 2020 | |||
| Newfoundland and Labrador | 11.38 | 2.81 | 2.60 |
| Prince Edward Island | 8.54 | 3.53 | 3.14 |
| Nova Scotia | 7.46 | 2.31 | 2.33 |
| New Brunswick | 8.78 | 2.49 | 2.35 |
| Quebec | 10.33Note * | 1.82 | 1.83 |
| Ontario | 8.25Note * | 1.11 | 1.07 |
| Manitoba | 6.58 | 1.51 | 1.65 |
| Saskatchewan | 12.08Note * | 2.04 | 2.22 |
| Alberta | 8.12 | 1.74 | 1.80 |
| British Columbia | 10.78Note * | 1.75 | 2.26 |
| Yukon | 14.36 | 7.33 | 8.60 |
| Northwest Territories | 10.31 | 6.20 | 5.76 |
| Nunavut | 23.35 | 6.58 | 6.82 |
| Canada | 9.11Note * | 0.64 | 0.68 |
| 2021 | |||
| Newfoundland and Labrador | 10.72 | 4.06 | 5.58 |
| Prince Edward Island | 4.89 | 2.36 | 2.82 |
| Nova Scotia | 6.54 | 2.56 | 2.63 |
| New Brunswick | 4.55 | 2.05 | 2.09 |
| Quebec | 6.74 | 1.52 | 1.62 |
| Ontario | 5.83 | 1.01 | 1.10 |
| Manitoba | 8.36 | 1.91 | 2.14 |
| Saskatchewan | 9.37 | 2.23 | 2.34 |
| Alberta | 7.54 | 1.79 | 2.00 |
| British Columbia | 8.17 | 2.06 | 2.49 |
| Yukon | 16.80 | 11.49 | 11.25 |
| Northwest Territories | 8.73 | 7.00 | 9.12 |
| Nunavut | 17.47 | 7.17 | 6.37 |
| Canada | 6.82 | 0.66 | 0.71 |
Source: Statistics Canada, Labour Force Survey, January-March 2019, January-March 2020 and January-March 2021. |
|||
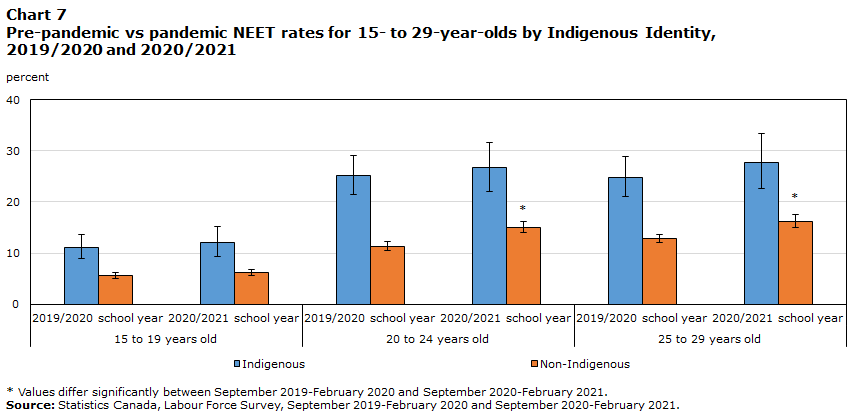
NEET rates for Indigenous youth did not increase significantly during the COVID-19 pandemic
Even prior to the pandemic, the proportion of youth not in employment, education or training varied among different groups of youth across the country. For example, NEET rates have historically been higher for Indigenous youth than non-Indigenous youthNote as Indigenous youth face additional barriers such as accessing quality education that is culturally sensitive. In addition, some Indigenous youth must leave their communities in pursuit of education and employment opportunities, that may cause cultural dislocation and exposure to discrimination.Note
While the proportion of youth not in employment, education or training is significantly different between Indigenous and non-Indigenous youth, the pandemic NEET rates for Indigenous youth residing off reserve did not increase to the same degree as they did for non-Indigenous youth during the pandemic.Note
Data table for Chart 7
| 15 to 19 years old | 20 to 24 years old | 25 to 29 years old | ||||
|---|---|---|---|---|---|---|
| 2019/2020 school year | 2020/2021 school year | 2019/2020 school year | 2020/2021 school year | 2019/2020 school year | 2020/2021 school year | |
| percent | ||||||
| Indigenous | 11.11 | 12.00 | 25.09 | 26.73 | 24.84 | 27.64 |
| 95% confidence interval down | 2.25 | 2.63 | 3.66 | 4.75 | 3.83 | 5.08 |
| 95% confidence interval up | 2.50 | 3.15 | 3.90 | 4.80 | 3.95 | 5.75 |
| Non-Indigenous | 5.63 | 6.17 | 11.35 | 14.97Note * | 12.86 | 16.11Note * |
| 95% confidence interval down | 0.55 | 0.59 | 0.86 | 1.02 | 0.80 | 1.16 |
| 95% confidence interval up | 0.58 | 0.59 | 0.83 | 1.15 | 0.85 | 1.34 |
|
||||||
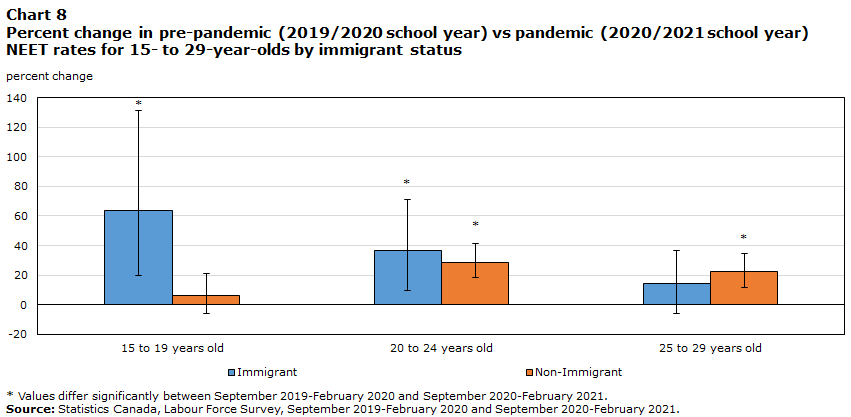
Additional impacts of public health measures included safety concerns and adverse effects on mental health
Women with lower levels of education, immigrants and individuals with mental or physical health concerns faced additional challenges, putting them at greater risk of falling into the NEET category.
Women aged 25 to 29 with an education level lower than high school completion had one of the largest increases (+37.2%) in the proportion of NEET in 2021, relative to 2019, compared with an increase of 25.0% for men in the same category. This finding fits into a larger body of research that suggests women of all ages have been disproportionately impacted by the pandemic due to their concentration in the services sector, which is relatively sensitive to public health measures.Note
Additionally, immigrant youth experienced a larger increase in NEET rates relative to non-immigrant youth, particularly for those aged 15 to 19 (63% higher than 2019 NEET levels). For this age group, the proportion of immigrant youth NEET increased from 4 to 7 percent from 2019/2020 to 2020/2021, while the NEET rate for non-immigrant youth remained stable at 6 percent. For those aged 15 to 19, this increase in NEET was primarily due to a decrease in the number of those attending school, which was not observed for Canadian-born students.Note This finding is consistent with recent work indicating that immigrants disproportionately felt the effects of COVID-19. For example, immigrants have faced greater health risks and poorer perceived safety during the pandemic.Note Note
Data table for Chart 8
| 15 to 19 years old | 20 to 24 years old | 25 to 29 years old | |
|---|---|---|---|
| percent change | |||
| Immigrant | 63.71Note * | 36.64Note * | 14.01 |
| 95% confidence interval down | 44.24 | 27.13 | 20.10 |
| 95% confidence interval up | 67.40 | 34.28 | 22.77 |
| Non-Immigrant | 6.22 | 28.76Note * | 22.57Note * |
| 95% confidence interval down | 12.08 | 10.48 | 10.88 |
| 95% confidence interval up | 14.92 | 12.53 | 11.75 |
|
|||
The mental health of youth in Canada was particularly affected by the pandemic, which can contribute to whether an individual is able to participate in employment, education or training.Note More Canadian youth reported that they did not look for a job due to their own illness or disability in 2020/2021, relative to pre-pandemic levels.Note
The mental health impact of the COVID-19 pandemic also affected those who were employed. Recent data from the LFS indicates that the prevalence of mental health-related disability among employed youth increased from 2019 to 2021, particularly for women (9.6 to 17.2%), which is consistent with other studies that have examined the challenges faced by Canadians over the course of the pandemic.Note
Conclusion
On an international scale, youth aged 18 to 24 in Canada and the United States experienced the largest increases in NEET rates – while youth in the United Kingdom faced subtler effects relative to the OECD average. Many factors likely play into the international experience of COVID-19, including the strength of public health measures applied across regions and the prevalence of youth employed in industries that are sensitive to those measures. While the stringency of public health measures among the selected countries was relatively similar in 2020, Canada had more restrictive measures in 2021.
In Canada, differences in the stringency of public health measures applied at the provincial/territorial level may have impacted NEET youth, through both school closures and persistent lockdowns affecting economic activity. The former is more likely to have played a role in the experience of youth aged 15 to 19 in Quebec and Saskatchewan, where the largest increase in NEET rates was observed. Economic contractions are more likely to have affected youth aged 20 to 24 and 25 to 29 in the prairies and Ontario, as labour market opportunities responded to declines in the energy, manufacturing and hospitality sectors.
Additionally, certain population groups were disproportionately affected by COVID-19. For example, women aged 25 to 29 who did not have a high school diploma experienced a particularly large increase (+37.2%) in the proportion of youth NEET in 2021. Immigrant youth aged 15 to 19 also experienced an increase in the NEET rate primarily due to a decrease in those attending school, which was not observed for Canadian-born youth.
This study has provided a high-level analysis of the impacts of the pandemic on NEET rates, and how they varied between countries and between regions within Canada. Future work might focus on the progress of groups vulnerable to falling into the NEET category, including Indigenous people, students, young women and immigrant youth. Additionally, analysis of the international response to COVID-19 may shed light on the best policy practices to support youth recovery around the globe.
| Age group and country | NEET (not in employment, education or training) | ||||
|---|---|---|---|---|---|
| 2019 | 2020 | 2021 | Difference in NEET from 2019 to 2020 | Difference in NEET from 2019 to 2021 | |
| percent | |||||
| 18 to 24 years old | |||||
| Canada | 13.48 | 19.74 | 14.89 | 46.47 | 10.45 |
| France | 17.48 | 17.48 | 16.00 | 0.00 | -8.44 |
| New Zealand | 12.97 | 14.21 | 12.76 | 9.55 | -1.62 |
| OECD - Average | 14.56 | 16.58 | 15.10 | 13.81 | 3.71 |
| United Kingdom | 14.47 | 15.23 | 13.70 | 5.22 | -5.36 |
| United States | 14.58 | 19.28 | 17.02 | 32.30 | 16.74 |
| Source: Education at a Glance, 2022. | |||||
| Country | 2020 | 2021 |
|---|---|---|
| COVID-19 stringency scoreTable 2 Note 1 | ||
| Canada | 59.36 | 71.28 |
| France | 57.92 | 64.55 |
| New Zealand | 41.36 | 45.16 |
| United States | 61.81 | 58.61 |
| United Kingdom | 59.58 | 57.72 |
|
||
| Province/territory | 2020 | 2021 |
|---|---|---|
| COVID-19 stringency scoreTable 3 Note 1 | ||
| Newfoundland and Labrador | 37.58 | 39.42 |
| Prince Edward Island | 40.67 | 34.52 |
| Nova Scotia | 38.82 | 39.56 |
| New Brunswick | 40.27 | 35.34 |
| Quebec | 44.20 | 48.67 |
| Ontario | 46.37 | 52.53 |
| Manitoba | 43.18 | 46.83 |
| Saskatchewan | 37.04 | 29.04 |
| Alberta | 33.85 | 34.72 |
| British Columbia | 31.71 | 34.34 |
| Yukon | 34.74 | 30.96 |
| Northwest Territories | 37.75 | 35.94 |
| Nunuvat | 39.66 | 37.62 |
|
||
| Age group and province/territory | NEET (not in employment, education or training) | ||
|---|---|---|---|
| Jan-Mar 2019 | Jan-Mar 2020 | Jan-Mar 2021 | |
| percent | |||
| 15 to 19 years old | |||
| Canada | 5.89 | 9.11Note * | 6.82 |
| Newfoundland and Labrador | 8.87 | 11.38 | 10.72 |
| Prince Edward Island | 5.63 | 8.54 | 4.89 |
| Nova Scotia | 4.79 | 7.46 | 6.54 |
| New Brunswick | 6.00 | 8.78 | 4.55 |
| Quebec | 4.96 | 10.33Note * | 6.74 |
| Ontario | 5.68 | 8.25Note * | 5.83 |
| Manitoba | 7.94 | 6.58 | 8.36 |
| Saskatchewan | 6.08 | 12.08Note * | 9.37 |
| Alberta | 7.62 | 8.12 | 7.54 |
| British Columbia | 5.44 | 10.78Note * | 8.17 |
| Yukon | 10.23 | 14.36 | 16.80 |
| Northwest Territories | 7.30 | 10.31 | 8.73 |
| Nunavut | 19.59 | 23.35 | 17.47 |
| 20 to 24 years old | |||
| Canada | 12.36 | 14.11 | 15.36Note * |
| Newfoundland and Labrador | 18.62 | 21.53 | 20.64 |
| Prince Edward Island | 13.56 | 13.24 | 17.32 |
| Nova Scotia | 15.27 | 19.14 | 15.31 |
| New Brunswick | 18.07 | 15.17 | 20.72 |
| Quebec | 10.53 | 12.71 | 11.81 |
| Ontario | 12.73 | 13.56 | 16.15Note * |
| Manitoba | 15.37 | 15.48 | 14.58 |
| Saskatchewan | 12.30 | 15.13 | 17.57 |
| Alberta | 11.95 | 15.80 | 15.76 |
| British Columbia | 11.13 | 13.85 | 15.84 |
| Yukon | 12.55 | 14.12 | 20.31 |
| Northwest Territories | 31.56 | 31.35 | 15.83 |
| Nunavut | 66.16 | 53.23 | 66.68 |
| 25 to 29 years old | |||
| Canada | 14.39 | 16.81Note * | 17.91Note * |
| Newfoundland and Labrador | 24.55 | 24.91 | 24.51 |
| Prince Edward Island | 17.90 | 18.37 | 11.26 |
| Nova Scotia | 17.63 | 20.02 | 17.40 |
| New Brunswick | 17.81 | 21.46 | 19.95 |
| Quebec | 12.02 | 13.72 | 16.11 |
| Ontario | 14.64 | 16.80 | 20.78Note * |
| Manitoba | 15.86 | 17.26 | 15.58 |
| Saskatchewan | 14.67 | 15.88 | 18.74 |
| Alberta | 15.63 | 20.79 | 16.15 |
| British Columbia | 13.67 | 16.21 | 13.14 |
| Yukon | Note x: suppressed to meet the confidentiality requirements of the Statistics Act | Note x: suppressed to meet the confidentiality requirements of the Statistics Act | Note x: suppressed to meet the confidentiality requirements of the Statistics Act |
| Northwest Territories | 27.32 | 19.42 | 28.46 |
| Nunavut | 41.40 | 40.35 | 49.08 |
x suppressed to meet the confidentiality requirements of the Statistics Act
|
|||
| Age group and Indigenous identity | NEET (not in employment, education or training) | |
|---|---|---|
| Sept 2019-Feb 2020 | Sept 2020-Feb 2021 | |
| percent | ||
| 15 to 19 years old | ||
| Indigenous identity | 11.11 | 12.00 |
| Non-Indigenous identity | 5.63 | 6.17 |
| 20 to 24 years old | ||
| Indigenous identity | 25.09 | 26.73 |
| Non-Indigenous identity | 11.35 | 14.97Note * |
| 25 to 29 years old | ||
| Indigenous identity | 24.84 | 27.64 |
| Non-Indigenous identity | 12.86 | 16.11Note * |
|
||
| Age group and immigrant status | NEET (not in employment, education or training) | ||
|---|---|---|---|
| Sept 2019-Feb 2020 | Sept 2020-Feb 2021 | Difference in NEET from 2019 to 2020 | |
| percent | |||
| 15 to 19 years old | |||
| Immigrant | 4.65 | 7.59 | 63.47Note * |
| Non-Immigrant | 6.08 | 6.45 | 6.06 |
| 20 to 24 years old | |||
| Immigrant | 12.08 | 16.51 | 36.66Note * |
| Non-Immigrant | 11.90 | 15.32 | 28.73Note * |
| 25 to 29 years old | |||
| Immigrant | 16.58 | 18.90 | 13.99 |
| Non-Immigrant | 13.45 | 16.49 | 22.59Note * |
|
|||
| Age group | Proportion unable to look for work due to illness or disability | ||
|---|---|---|---|
| Sept 2019-Feb 2020 | Sept 2020-Feb 2021 | Difference in NEET from 2019 to 2020 | |
| percent | |||
| 15 to 19 years old | 0.23 | 0.25 | 7.43 |
| 20 to 24 years old | 1.36 | 0.73 | -45.96Note * |
| 25 to 29 years old | 2.60 | 3.25 | 25.18 |
|
|||
| Sex | NEET (not in employment, education or training) | ||||
|---|---|---|---|---|---|
| Jan-Mar 2019 | Jan-Mar 2020 | Jan-Mar 2021 | Difference in NEET from 2019 to 2020 | Difference in NEET from 2019 to 2021 | |
| percent | |||||
| Both sexes | 37.00 | 48.00 | 47.00 | 29.73 | 27.03 |
| Females | 43.00 | 55.00 | 59.00 | 27.91 | 37.21 |
| Males | 32.00 | 43.00 | 40.00 | 34.38 | 25.00 |
| Source: Labour Force Survey, January-March 2019, January-March 2020 and January-March 2021. | |||||
Data sources, Methods and Definitions
The data used in this fact sheet are from the Labour Force Survey (LFS). The sample is representative of Canada's population aged 15 years and older, and each respondent aged 15 and over is classified as employed, unemployed or not in the labour force (inactive).
In international comparisons, NEET rates are calculated using only the first three months of the reference year, in accordance with OECD methodology. For national and interprovincial comparisons, the OECD methodology is employed. For certain population groups (i.e., immigrants, Indigenous youth and those with mental or physical illness) NEET rates are calculated using the months from September to February in order to maximize the sample size.
The bootstrap method is employed to calculate standard error and includes sampling uncertainties. Confidence intervals on the percentages in this analysis correspond to the 95% confidence interval. The increase or decrease is deemed significant if the confidence interval does not include zero.
An immigrant refers to a person who is or has ever been a landed immigrant or permanent resident in Canada. This person has been granted the right to live in Canada permanently by immigration authorities. Some immigrants are Canadian citizens, while others are not.Note
The Indigenous population is composed of persons who reported being an Aboriginal person, that is, First Nations (North American Indian), Métis or Inuk (Inuit). Excluded from the survey’s coverage are persons living on reserves and other Aboriginal settlements in the provinces, as well as those living in the territories.Note
Both reported stringency measures are based on the methodology of the Oxford COVID-19 Government Response Tracker (OxCGRT) developed by the University of Oxford’s Blavatnik School of Government. The index on any given day is calculated as the mean score of the metrics, each taking a value between 0 and 100, with a higher score indicating a higher level of stringency. The annual COVID-19 Stringency measure reported is calculated as an average of the daily scores each year.
The international COVID-19 Stringency Index is calculated as a composite measure of nine of the response metrics including: school closures, workplace closures, cancellation of public events, restrictions on public gatherings, closures of public transport, stay-at-home requirements, public information campaigns, restrictions on internal movements, and international travel controls.
The provincial/territorial COVID-19 Stringency Index measures the severity of containment policies related to COVID-19. For each province or territory, the restrictions index is the average of 15 policy-specific indexes where the policy-specific indexes are normalized values of corresponding policy indicators. Eight of the indexes are derived (with some modifications) from the variables in the Oxford COVID-19 Stringency Index. Seven additional variables are added to the index to better reflect the policy stance of Canadian jurisdictions.Note
References
Arriagada, P. 2021. “The achievements, experiences and labour market outcomes of First Nations, Métis and Inuit women with bachelor’s degrees or higher.” Insights on Canadian Society. Statistics Canada Catalogue no. 75-006-x.
Bank of Canada. 2022. “The Bank of Canada COVID-19 stringency index: measuring policy response across provinces.” COVID-19: Actions to Support the Economy and Financial System.
Barford, A., Coutts, A. and Garima, S. (2021). “Youth employment in times of COVID.” International Labour Organization.
Bourbeau, E. and Pelletier, R. 2019. “Young people not in employment, education or training: What did they do in the past 12 months?” Labour Statistics at a Glance. Statistics Canada Catalogue no. 71-222-X.
Brunet, S. 2018. “The transition from school to work: The NEET (not in employment, education or training) indicator for 25- to 29-year-old women and men in Canada.” Education Indicators in Canada: Fact Sheet, no. 13. Statistics Canada Catalogue no. 81-599-X.
Clarke, S., Dekker, J., Habli, N., Macdonald, R., and McCormack, C. 2022. “Measuring the Correlation Between COVID-19 Restrictions and Economic Activity.” Analytical Studies: Methods and References. Statistics Canada Catalogue no. 11-633-X.
Deng, Z., Arim, R., Henseke, G., Schoon, I., Dietrich, H., Murray, A., Smyth, E. and Dupéré, V. 2022. “Youth unemployment in Canada, Germany, Ireland, and the United Kingdom in times of COVID-19.” Economic and Social Reports. Statistics Canada Catalogue no. 36-28-0001.
Dinkes, R. 2021. “Education at a glance 2021: putting U.S. data in a global context.” NCES Blog. National Center for Education Statistics.
Grekou, D. and Lu, Y. 2021. “Gender differences in employment one year into the COVID-19 pandemic: An analysis by industrial sector and firm size.” Economic and Social Reports. Statistics Canada Catalogue no. 36-28-0001.
Hango, D., Zarifa, D. and Seward, B. 2021. “Are some canadian youth NEETer than others? Examining North–South and rural–urban inequalities in education, employment, and training.” The Northern Review 52: 61–89.
LaRochelle-Côté, S. and Uppal, S. (2020). “The social and economic concerns of immigrants during the COVID-19 pandemic.” StatCan COVID-19: Data to Insights for a Better Canada. Statistics Canada Catalogue no. 45-28-0001.
Leclerc, K. 2020. “Caring for their children: Impacts of COVID-19 on parents.” StatCan COVID-19: Data to Insights for a Better Canada. Statistics Canada Catalogue no. 45-28-0001.
Morissette, R. 2021. “Chapter 2: Youth Employment in Canada.” Portrait of Youth in Canada: Data Report. Statistics Canada, Catalogue no. 42-28-0001.
Ng, E. 2021. “COVID-19 deaths among immigrants: Evidence from the early months of the pandemic.” StatCan COVID-19: Data to Insights for a Better Canada. Statistics Canada Catalogue no. 45-28-0001.
Organisation for Economic Co-operation and Development. 2020. “Job retention schemes during the COVID-19 lockdown and beyond.” Tackling Coronavirus (COVID-19).
Organisation for Economic Co-operation and Development. 2022a. “Education at a glance 2021: OECD indicators.” OECD Publishing.
Organisation for Economic Co-operation and Development. 2022b. “First lessons from government evaluations of COVID-19 responses: A synthesis.” Tackling Coronavirus (COVID-19).
Ritchie, H., Mathieu, E., Rodés-Guirao, L., Appel, C., Giattino, C., Ortiz-Ospina, E., Hasell, J., Macdonald, B., BeltekianM D. and Roser M. 2020. "Coronavirus pandemic (COVID-19)". Published online at OurWorldInData.org. Retrieved from: https://ourworldindata.org/coronavirus
Sandner, M., Patzina, A., Anger, S., Bernhard, S. and Dietrich, H. 2021. “The COVID-19 pandemic, well-being, and transitions to post-secondary education.” Discussion Paper Series. IZA Institute of Labour Economics No. 14797.
Schoon, I. and Bynner, J. 2019. “Young people and the Great Recession: Variations in the school-to-work transition in Europe and the United States.” Longitudinal and Life Course Studies 10: 153–173.
Statistics Canada. 2020. Labour Force Survey questionnaire, Guide to the Labour Force Survey, Appendix C. Statistics Canada Catalogue no. 71-543-G.
Statistics Canada. 2021a. “Economic impacts of COVID-19 in the provinces and territories.” A Presentation Series from Statistics Canada About the Economy, Environment and Society. Statistics Canada Catalogue no. 11-631-X.
Statistics Canada. 2021b. “Self-perceived mental health and mental health care needs during the COVID-19 pandemic.” StatCan COVID-19: Data to Insights for a Better Canada. Statistics Canada Catalogue no. 45-28-0001.
Statistics Canada. 2021c. “Working from home during the COVID-19 pandemic, April 2020 to June 2021.” The Daily.
Statistics Canada. 2022. “Mental health-related disability rises among employed Canadians during pandemic, 2021.” The Daily.
U.S. Bureau of Labor Statistics. 2021. “Employment and unemployment among youth summary.” Summer Youth Labor Force. Economic News Release.
Wall, K. 2021. “Gendered impacts of the COVID-19 pandemic on the proportion of youth neither in employment nor education at the start of the school year.” Insights on Canadian Society. Statistics Canada Catalogue no. 75-006-X.
Zeman, K. and Frenette, M. 2021. “Chapter 3: youth and education in Canada.” Portrait of Youth in Canada: Data Report. Statistics Canada Catalogue no. 42-28-0001.
- Date modified: