
Overqualification among 2012 and 2013 bachelor’s graduates
Skip to text
Text begins
Highlights
- The proportion of bachelor’s degree graduates under the age of 35 who obtained their degree in 2012 and 2013 and had an occupation in 2016 that required at most a high school diploma was 16.7%. This rate for new entrants to the labour market is similar to what other studies have shown for all salaried workers of the same age who hold a bachelor’s degree. This proportion has been relatively stable in recent decades.
- Among these 2012 and 2013 bachelor’s degree graduates, belonging to a group designated as a visible minority (GDVM) was associated with a higher risk of overqualification among women, particularly for Black women (their rate was close to 23%, versus 14.8% for Canadian-born women who were not members of a GDVM) and for female South Asian immigrants (17.2%). This was also the case for Canadian-born Black men (26.5%), while Chinese immigrant men had a lower rate than Canadian-born men not belonging to a visible minority group (14.8% versus 17.6%).
- Women were slightly less likely than men to hold a low-skill job (high school level and lower). After taking into account differences in demographic characteristics and the field of study of 2012 and 2013 graduates, women had an overqualification rate of 15.2%, compared with 17.7% for men. This advantage for women is relatively new, as there has been a reversal of the gap since 2001.
- For these 2012 and 2013 bachelor’s degree graduates and for all salaried workers under the age of 35 with a bachelor’s degree, some fields of study are associated with lower overqualification rates. Among men, these fields were architecture, engineering, and related technologies, and mathematics, computer and information sciences, while among women, the fields were health and related fields and education.
- Master’s degree graduates were two-and-a-half times less likely to hold a low-skill position. Overqualification rates were comparable for men and women (around 6%). As with the bachelor’s degree level, the fields of architecture, engineering, and related technologies; health and related fields; and education had the lowest rates.
- The rate of overqualification appears to decrease as graduates gain experience in the labour market. Women who graduated in 2012 had an overqualification rate of 13.9%, or 2.7 percentage points lower than 2013 graduates (16.6%). Among men, the gap was 1.8 percentage points (16.5% versus 18.3%).
Introduction
For the past few decades, the proportion of individuals with a university degree and a job requiring at most a high school diploma has ranged from 18% to 21%.Note This form of overqualificationNote usually leads to lower wages for the affected persons and can also have an impact on their motivation. It could also pose a cost to employers, as overqualified workers may be encouraged to look for another job, resulting in hiring and training costs. At the level of the economy as a whole, overqualification is a form of underemployment and involves costs related to the misallocation of resources (Boudarbat and Montmarquette 2017). Overqualification is more likely to affect certain subgroups of graduates, including immigrants and members of groups designated as visible minorities, as well as graduates of certain fields of study, such as the humanities or arts, as opposed to education, health, and applied sciences (Cornelissen and Turcotte 2020; Uppal and LaRochelle-Côté 2014; Galarneau and Morissette 2008). Overqualification could also be transitory, affecting new graduates more at the beginning of their career and decreasing as they gain labour market experience, as with many working conditions that improve with experience.
Using a new database created by integrating information from the Postsecondary Student Information System (PSIS) with 2016 Census dataNote (see the “Data sources, definitions and modelling” section), this article examines the extent to which 2012 and 2013 graduates with a bachelor’s degreeNote who did not go back to school full time afterward held a job requiring a high school diploma at most when they entered the labour market in 2016. Strictly speaking, these graduates represent the population of the 2016 Census who obtained a bachelor’s degree in 2012 or 2013. The overqualification rate, thus defined, is examined according to several characteristics, such as sex, field of study, province, graduation year, belonging to a group designated as a visible minority and immigration status.
This unique database is used to provide a glimpse into the situation of new graduates of Canadian postsecondary institutions and is the key topic of interest of this article. Studies on overqualification based on census data usually focus on individuals in the same age group, but do not identify new graduates (Galarneau and Morissette 2008; Uppal and LaRochelle-Côté 2014). These studies combine graduates who have potentially acquired a different number of years of experience in the labour market. However, the sample used in this article consists of a homogeneous group of individuals who graduated in 2012 or 2013 and who are under the age of 35. This type of universe is similar to the one from the National Graduates Survey (NGS)Note but covers a larger sample, allowing for a more detailed examination of certain population groups, such as immigrants and persons from groups designated as visible minorities. These data can also be integrated with other databases, such as tax data, expanding the possibilities for analysis. This demonstrates the analytical potential of the new Education and Labour Market Longitudinal Platform (ELMLP), designed to combine the PSIS administrative file with other data sources to better understand the challenges facing new graduates in transitioning from studies to the labour market.
The 2016 Census file, which is integrated with PSIS, provides details on the occupation after graduation, with which a skill level is associated. Since this information is for 2016, only the cohorts of 2012 and 2013 were selected, because it is preferable to allow a few years after graduation before examining the characteristics of graduates in the labour market (Statistics Canada, 2020). Only graduates who did not return to school full time are included in this article to avoid including individuals with different educational attainments. In addition, this article focuses on those with a bachelor’s degree, given the large number of graduates at that level.Note
Profile of bachelor’s degree graduates of 2012 and 2013
According to the integrated PSIS–T1FF–2016 Census file, the number of bachelor’s degree graduates who had not pursued full-time studies between their graduation year and 2016 was 83,625 among 2012 graduates, and 93,135 among 2013 graduates (Table 1). The vast majority of them—nearly 97%—had a job in 2015, and 86% were salaried employees over that year.Note Graduates under the age of 35 accounted for three-quarters of all graduates. This article focuses on this group of individuals, who were part of the 2016 Canadian population, graduated with a bachelor’s degree in 2012 or 2013, were salaried employees in 2015 and were under the age of 35 at the time of the 2016 Census, in order to observe new labour market entrants.Note
| Year of graduation | ||||
|---|---|---|---|---|
| 2012 | 2013 | |||
| number | percent | number | percent | |
| Graduates who had not returned to school by 2016 | ||||
| Overall | 83,625 | 100.0 | 93,135 | 100.0 |
| Employed in 2015 | 80,845 | 96.7 | 89,975 | 96.6 |
| Salaried employees in 2015 | 71,920 | 86.0 | 80,280 | 86.2 |
| Under 35 years at the time of the 2016 Census | 62,825 | 75.1 | 71,685 | 77.0 |
| Under 30 years | 51,010 | 61.0 | 62,030 | 66.6 |
| 30 to 34 years | 11,820 | 14.1 | 9,660 | 10.4 |
|
Note: The universe is in fact the 2016 population who graduated with a bachelor’s degree in 2012 or 2013. Source: Integrated Postsecondary Student Information System – T1 Family File – 2016 Census file. |
||||
Overall, graduates of 2013 accounted for just over half of all graduates selected for this analysis (53%).Note This is in line with PSIS data, which show an upward trend in the number of university graduates in recent years.Note
The demographic characteristics of graduates are similar between the two cohorts examined (data not shown). Most are women, accounting for nearly 60% of graduates, and under the age of 30 (more than 8 in 10 graduates). Graduates who were living in Ontario in 2016 comprised more than 40% of the total, followed by those living in Quebec (19%), Alberta (14%) and British Columbia (13%) (Table 2).
A large proportion of 2012 and 2013 graduates earned their degree in business, management and public administration, and to a lesser extent, in social and behavioural sciences and law. These two fields accounted for just under 45% of both female and male bachelor’s degree graduates. There were many women who studied in the fields of health and related fields and education, which accounted for 37% of women and 13% of men. In contrast, 22% of men graduated in the field of architecture, engineering, and related technologies, compared with only 4% of their female counterparts. These proportions were comparable to those observed for most cohorts of graduates.
| Women | Men | |
|---|---|---|
| number | ||
| Overall | 80,300 | 54,210 |
| percent | ||
| Under 30 years at the time of the 2016 Census | 84.7 | 83.1 |
| Province or territory of residence in 2016 | ||
| Newfoundland and Labrador | 1.4 | 1.2 |
| Prince Edward Island | 0.4 | 0.3 |
| Nova Scotia | 2.3 | 2.1 |
| New Brunswick | 2.0 | 1.4 |
| Quebec | 19.2 | 18.9 |
| Ontario | 40.2 | 42.4 |
| Manitoba | 3.5 | 2.9 |
| Saskatchewan | 3.4 | 3.0 |
| Alberta | 14.4 | 14.8 |
| British Columbia | 12.9 | 12.8 |
| Yukon, Northwest Territories and Nunavut | 0.3 | 0.3 |
| Field of study | ||
| Education | 17.8 | 7.9 |
| Visual and performing arts, and communications technologies | 3.4 | 3.1 |
| Humanities | 6.0 | 5.4 |
| Social and behavioural sciences and law | 18.7 | 14.7 |
| Business, management and public administration | 24.0 | 29.8 |
| Physical and life sciences and technologies | 4.0 | 4.7 |
| Mathematics, computer and information sciences | 1.0 | 5.0 |
| Architecture, engineering, and related technologies | 3.7 | 21.7 |
| Agriculture, natural resources and conservation | 1.4 | 1.6 |
| Health and related fields | 18.9 | 4.9 |
| Personal, protective and transportation services and other fields | 1.2 | 1.1 |
| Immigration status and membership in a group designated as a visible minority (GDVM) | ||
| Immigrants who belong to a GDVM | 14.0 | 18.3 |
| Canadian-born who belong to a GDVM | 11.0 | 11.9 |
| Immigrants who do not belong to a GDVM | 3.8 | 4.1 |
| Canadian-born who do not belong to a GDVM | 71.2 | 65.6 |
|
Note: The universe is in fact the 2016 population who graduated with a bachelor’s degree in 2012 or 2013. Source: Integrated Postsecondary Student Information System – T1 Family File – 2016 Census file. |
||
Several studies have reported a higher likelihood of overqualification among immigrants and members of groups designated as visible minorities (GDVMs). The integrated PSIS–T1FF–2016 Census file allows the study of these relatively small groups at the bachelor’s degree level, because of its large size. For the purposes of the analysis, these two characteristics were combined to create four categories of graduates:
- Immigrants who belong to a GDVM;
- Canadian-born individuals who belong to a GDVM;
- Immigrants who do not belong to a GDVM;
- Canadian-born individuals who do not belong to a GDVM.
Canadian-born individuals who do not belong to a GDVM (group 4) accounted for the majority of graduates, representing 71% and 66% of female and male graduates with a bachelor’s degree, respectively. They are followed by immigrants who belong to a GDVM (group 1, 14% and 18%), Canadian-born individuals who belong to a GDVM (group 2, 11% and 12%), and immigrants who do not belong to GDVM (group 3, about 4% for both women and men).
Since not all individuals belonging to a GDVM are equally affected by most labour market issues, including overqualification, a more detailed breakdown is also presented, given that the integrated file provides this level of detail.
| Women | Men | |
|---|---|---|
| number | ||
| Overall | 80,300 | 54,210 |
| percent | ||
| Immigrants | ||
| South Asian | 2.8 | 4.6 |
| Chinese | 5.1 | 6.6 |
| Black | 1.5 | 1.4 |
| Other GDVM | 4.6 | 5.7 |
| Do not belong to a GDVM | 3.8 | 4.1 |
| Canadian-born | ||
| South Asian | 2.6 | 2.9 |
| Chinese | 3.4 | 4.4 |
| Black | 1.4 | 0.8 |
| Other GDVM | 3.5 | 3.7 |
| Do not belong to a GDVM | 71.2 | 65.6 |
|
Note: The universe is in fact the 2016 population who graduated with a bachelor’s degree in 2012 or 2013. GDVM means group designated as visible minorities. Source: Integrated Postsecondary Student Information System – T1 Family File – 2016 Census file. |
||
Chinese graduates are the GDVM with the largest number of individuals (between 3.4% and 6.6%, depending on whether they are immigrants or Canadian-born, Table 3), followed by South Asian graduates (between 2.6% and 4.6%) and Black graduates (between 0.8% and 1.5%). Each of the other groups represents a small proportion of graduates, so they have been combined. In total, they account for 3.5% to 5.7% of graduates. Note that whether or not they are immigrants, these individuals all graduated from a Canadian institution, which usually protects against overqualification in the Canadian labour market.
The following sections present the overqualification rate of bachelor’s degree graduates in the job held during the 2016 Census reference week (from May 1 to 7, 2016), according to various characteristics of the graduates. Multivariate models were used to account for the influence of multiple factors on overqualification rates, as described in the “Data sources, definitions and modelling” section. Although they are very useful, these models take into account only what is measurable. There are many factors that are more difficult to measure, such as the disparity in skills between individuals with the same educational attainment, individuals’ abilities, motivation, talent, ability to network, requirements to speak in a second language, job interruptions, etc. These factors may account for some of the differences in overqualification rates, but they are not included here, because they were not measured by the PSIS, T1FF or the 2016 Census.
Female bachelor’s degree graduates are less likely to be overqualified than their male counterparts
Women who graduated with a bachelor’s degree were less likely than men to hold low-skill positions, with an overqualification rate of 15.2%. When compared with their male counterparts (17.7%), the gap totalled 2.5 percentage points, after factoring in differences in the graduates’ characteristics.
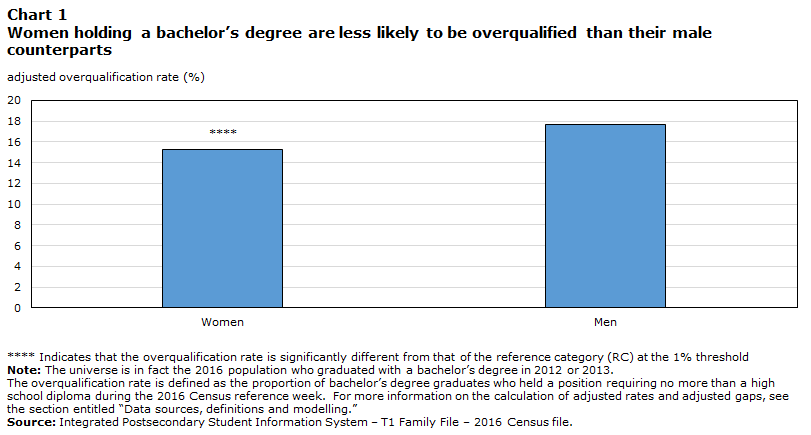
Data table for Chart 1
| adjusted overqualification rate (%) | |
|---|---|
| Women | 15.2Note **** |
| Men | 17.7 |
The overqualification rate is defined as the proportion of bachelor’s degree graduates who held a position requiring no more than a high school diploma during the 2016 Census reference week. For more information on the calculation of adjusted rates and adjusted gaps, see the section entitled “Data sources, definitions and modelling.” Source: Integrated Postsecondary Student Information System – T1 Family File – 2016 Census file. |
|
A change of the gap in the overqualification rate has been observed between male and female bachelor’s degree graduates aged 25 to 34Note who were born in CanadaNote since the early 2000s (Chart 2). According to the 2001 Census, women in this age group who were born in Canada had an overqualification rate 2.1 percentage points higher than men born in Canada. In 2011, the gap was small (-0.4 percentage points), and in 2016, it was reversed (-1.2 percentage points), with women posting a lower overqualification rate. Data on graduates of 2012 and 2013 show only a slightly larger gap (-1.6 percentage points). This reversal occurred because the rate for women decreased (from 19.2% in 2001 to 16.5% in 2016), while the rate for men remained relatively stable (17.1% in 2001 and 17.7% in 2016).

Data table for Chart 2
| 2001 Census | 2011 National Household Survey | 2016 Census | 2012 and 2013 Cohorts | |
|---|---|---|---|---|
| Percentage point difference | 2.1 | -0.4 | -1.2 | -1.6 |
|
Note: The universe is in fact the 2016 population who graduated with a bachelor’s degree in 2012 or 2013. Gaps between the overqualification rate of male and female bachelor’s degree graduates, born in Canada, who were between 25 and 34 years at the time of the 2001 and 2016 censuses and at the time of the 2011 National Household Survey. Source: 2001 and 2016 censuses, 2011 National Household Survey and the Integrated Postsecondary Student Information System – T1 Family File – 2016 Census file. |
||||
In addition, women have made up the majority of bachelor’s degree graduates for the past few years. In 2016, a large proportion of them still held positions in the fields of health and related fields and education, which generally have low rates of overqualification. Furthermore, these fields are affected by labour shortages, and the health sector also feels the effects of population aging. These combined effects may partly explain the narrowing gap in the overqualification rate between men and women.
For women holding bachelor’s degrees, belonging to a visible minority group increases the risk of overqualification
The overqualification rate of female bachelor’s degree graduates who belonged to a group designated as a visible minority (GDVM) — whether they were immigrants or Canadian-born — was significantly higher than their Canadian-born counterparts who were not members of these groups. This gap, which is relatively small overall, persisted, even after factoring in differences in graduates’ characteristics (Chart 3). For immigrants, the gap was 1.6 percentage points, compared with 2.7 percentage points for those who were born in Canada.Note For female immigrants who did not belong to a GDVM, the gap with those born in Canada who were not part of a GDVM was not significant. It therefore appears that, for women, the risk of overqualification is not increased by being an immigrant, but rather by being a member of a GDVM. Among men, these gaps were not significant except for immigrants who were members of a GDVM.

Data table for Chart 3
| Women | Men | |
|---|---|---|
| adjusted overqualification rate (%) | ||
| Members of a GDVM | ||
| Immigrants | 16.4Note **** | 16.4Note ** |
| Canadian-born | 17.5Note **** | 18.8 |
| Non member of a GDVM | ||
| Immigrants | 15.2 | 17.1 |
| Canadian-born | 14.7 | 17.6 |
The overqualification rate is defined as the proportion of bachelor’s degree graduates with a position requiring no more than a high school diploma during the 2016 Census reference week. For more information on the calculation of adjusted rates and adjusted gaps, see the section entitled “Data sources, definitions and modelling.” Source: Integrated Postsecondary Student Information System – T1 Family File – 2016 Census file. |
||
The risk of overqualification was not the same for each visible minority group (Table 4). Among women, the largest gap was for Black women, with a gap of 8.2 percentage points for Black immigrant women and 7.3 percentage points for Black Canadian-born women, compared with the reference category (Canadian-born women who do not belong to a GDVM). In addition, South Asian women had a rate 2.4 percentage points higher than the reference category, but only for those who were immigrants; South Asian Canadian-born graduates did not have a significant gap. Among Chinese graduates, only those women born in Canada had a higher overqualification rate (2.2 percentage points) than the reference group. Graduates born in Canada who belong to other GDVMs had a rate 2.9 percentage points higher.
In addition, although the overqualification rates for immigrant and non-immigrant men who may or may not belong to a GDVM showed little significant difference from their counterparts who were part of the reference group, the more detailed data reveal some differences. Among Canadian-born graduates, Black and South Asian men had rates that were 9.0 percentage points and 3.6 percentage points higher, respectively. On the contrary, Chinese immigrant men had a rate 2.7 percentage points lower than the reference group, as did Canadian-born men who belong to other GDVMs ( 2.4 percentage points). These differences were observed after considering the differences in the graduates’ characteristics.
| Women | Men | |||
|---|---|---|---|---|
| Adjusted rate | Gap | Adjusted rate | Gap | |
| percent | percentage points | percent | percentage points | |
| Immigrants | ||||
| South Asian | 17.2 | 2.4Note *** | 18.4 | 0.9 |
| Chinese | 14.5 | -0.2 | 14.8 | -2.7Note **** |
| Black | 23.0 | 8.2Note **** | 15.2 | -2.4 |
| Other GDVM | 15.6 | 0.8 | 16.9 | -0.6 |
| Does not belong to a GDVM | 15.2 | 0.4 | 17.1 | -0.5 |
| Canadian-born | ||||
| South Asian | 14.7 | 0.0 | 21.1 | 3.6Note *** |
| Chinese | 16.9 | 2.2Note *** | 18.5 | 0.9 |
| Black | 22.1 | 7.3Note **** | 26.5 | 9.0Note **** |
| Other GDVM | 17.7 | 2.9Note **** | 15.2 | -2.4Note *** |
| Does not belong to a GDVM | 14.8 | RC | 17.6 | RC |
The overqualification rate is defined as the proportion of bachelor’s degree graduates who have a position requiring no more than a high school diploma during the 2016 Census reference week. For more information on the calculation of adjusted rates and adjusted gaps, see the section entitled “Data sources, definitions and modelling.” Source: Integrated Postsecondary Student Information System – T1 Family File – 2016 Census file. |
||||
The fields of education; health and related fields; architecture, engineering, and related technologies; and mathematics, computer and information sciences have the lowest rates of overqualification
Several studies have shown that the overqualification rate varies according to the field of study, with the applied sciences generally less affected by this form of underemployment, especially for men (Cornelissen and Turcotte 2020; Census in Brief 2017; Uppal and LaRochelle 2014; Galarneau and Morissette 2008). Among women, it is mainly the fields of education and health and related fields that have relatively low rates; these fields are linked to specific occupations and are also affected by labour shortages, which also partly explains the low rates of overqualification.
| Women | Men | |||
|---|---|---|---|---|
| Adjusted rate | Gap | Adjusted rate | Gap | |
| percent | percentage points | percent | percentage points | |
| Field of study | ||||
| Education | 5.3 | -2.4Note **** | 8.5 | 2.7Note **** |
| Visual and performing arts, and communications technologies | 27.0 | 19.2Note **** | 27.8 | 22.0Note **** |
| Humanities | 30.8 | 23.1Note **** | 30.1 | 24.3Note **** |
| Social and behavioural sciences and law | 25.3 | 17.6Note **** | 29.1 | 23.3Note **** |
| Business, management and public admin. | 20.4 | 12.6Note **** | 19.5 | 13.7Note **** |
| Physical and life sciences and technologies | 19.4 | 11.6Note **** | 21.3 | 15.5Note **** |
| Mathematics, computer and information sciences | 11.2 | 3.4Note *** | 7.7 | 1.9Note *** |
| Architecture, engineering, and related technologies | 7.8 | RC | 5.8 | RC |
| Agriculture, natural resources and conservation | 25.0 | 17.3Note **** | 23.3 | 17.5Note **** |
| Health and related fields | 3.9 | -3.9Note **** | 12.2 | 6.4Note **** |
| Personal, protective and transportation services and other fields | 31.6 | 23.9Note **** | 34.3 | 28.5Note **** |
The overqualification rate is defined as the proportion of bachelor’s degree graduates of 2012 and 2013 who have a position requiring no more than a high school diploma during the 2016 Census reference week. For more information on the calculation of adjusted rates and adjusted gaps, see the section entitled “Data sources, definitions and modelling.” Source: Integrated Postsecondary Student Information System – T1 Family File – 2016 Census file. |
||||
These findings also applied to graduates of 2012 and 2013. Men who obtained a bachelor’s degree in the fields of architecture, engineering, and related technologies (5.8%), and in mathematics, computer and information sciences (7.7%) had the lowest adjusted overqualification rates (Table 5). After taking into account differences in the demographic characteristics of graduates, the differences in overqualification rates between each field of study and that of the reference category (architecture, engineering, and related technologies) were significant.
Among women, graduates from the fields of health and related fields and education had the lowest rates (3.9% and 5.3%), even after taking into account differences in demographics. The gap noted between the overqualification rate of men and women in health and related fields also persisted. Overqualification rates among men in this field of study were three times higher than that of women.
In contrast, and in line with other studies, the fields of the humanities, social and behavioural sciences and law, and visual and performing arts, and communications technologies were associated with the highest overqualification rates among graduates of 2012 and 2013 (between 25% and 31%).Note These results also persisted after taking into account differences in demographic characteristics.
Higher overqualification rates in Ontario
The overqualification rate for bachelor’s degree graduates in 2012 and 2013 tended to be higher in Ontario (Table 6). The gaps in the adjusted overqualification gaps were generally negative for most provinces, except for the Maritime provinces and Manitoba, where the gaps were negligible. Among women, the gap was highest in Quebec, where graduates had a rate 5.1 percentage points lower than their counterparts living in Ontario in 2016, followed by graduates from Alberta (-3.4 percentage points) and Saskatchewan (-3.1 percentage points). For men, the largest gaps were found among graduates from Saskatchewan (-6.2 percentage points) and Alberta (-5.2 percentage points), followed by graduates from Newfoundland and Labrador, and the Territories (-4.7 percentage points) and Quebec (-4.0 percentage points).
Differences in overqualification rates by province could be related to the unemployment rate, with provinces having an oversupply of qualified workers or higher unemployment rates also having higher overqualification rates. These gaps could also be related to an oversupply of certain types of qualified workers from specific fields of study. Provinces with a higher demand for certain types of professionals, compared with other provinces, would have a lower overall overqualification rate (Boudarbat and Montmarquette 2018). Census 2016 data for salaried employees under the age of 35 and holding a bachelor’s degree show that there is indeed a positive correlation between the overqualification rate and the unemployment rate, since each percentage point increase in the unemployment rate is associated with a 0.26 percentage point increase in the overqualification rate.Note These numbers also indicate that factors other than the unemployment rate are at play to explain the overqualification rates of graduates.
| Women | Men | |||
|---|---|---|---|---|
| Adjusted rate | Gap | Adjusted rate | Gap | |
| percent | percentage points | percent | percentage points | |
| Province of residence in 2016 | ||||
| Newfoundland and Labrador and the Territories | 14.4 | -2.6Note ** | 14.7 | -4.7Note *** |
| Maritime provinces | 18.0 | 1.0 | 19.0 | -0.4 |
| Quebec | 11.9 | -5.1Note **** | 15.4 | -4.0Note **** |
| Ontario | 17.0 | RC | 19.4 | RC |
| Manitoba | 17.3 | 0.3 | 18.7 | -0.7 |
| Saskatchewan | 14.0 | -3.1Note **** | 13.2 | -6.2Note **** |
| Alberta | 13.7 | -3.4Note **** | 14.1 | -5.2Note **** |
| British Columbia | 15.9 | -1.1Note *** | 18.2 | -1.2Note ** |
| Year of graduation | ||||
| 2012 | 13.9 | RC | 16.5 | RC |
| 2013 | 16.6 | 2.7Note **** | 18.3 | 1.8Note **** |
| Age at the time of the 2016 Census | ||||
| Under 30 years | 15.5 | 1.3Note *** | 17.5 | -0.2 |
| 30 to 34 years | 14.2 | RC | 17.7 | RC |
The overqualification rate is defined as the proportion of bachelor’s degree graduates of 2012 and 2013 holding a position requiring no more than a high school diploma during the 2016 Census reference week. For more information on the calculation of adjusted rates and adjusted gaps, see the section entitled “Data sources, definitions and modelling.” Source: Integrated Postsecondary Student Information System – T1 Family File – 2016 Census file. |
||||
There are also significant gaps in overqualification by year of graduation and age. Women and men who graduated in 2013 had an adjusted rate of overqualification 2.7 percentage points higher and 1.8 percentage points higher, respectively, compared with those who graduated in 2012. In 2016, the graduates of 2012 had completed their studies four years earlier, compared with three years for those who graduated in 2013. It is reasonable to believe that they probably gained one more year of experience.Note This suggests that, as graduates gain experience in the labour market, the probability of overqualification decreases. This result reflects the fact that employment conditions tend to improve, to some extent, as labour market experience increases.
Among women, the youngest graduates (under 30 years) also had a higher overqualification rate (1.3 percentage points) than those aged 30 to 34. This effect was not seen among men.
The overqualification rate for bachelor’s degree graduates is two-and-a-half times higher than for master’s degree graduates
Although the number of individuals who graduated with a master’s degree is lower than the number of those with a bachelor’s degree, the integrated PSIS–T1FF–2016 Census file shows a glimpse of this group and allows it to be compared with the bachelor’s degree group. This comparison shows that bachelor’s degree holders are 2.4 (women) and 2.7 (men) times more likely to be overqualified than master’s degree graduates. A gap of 9 and 11 percentage points, by sex, separates these two educational attainments. This is an adjusted gap after taking into account differences in the characteristics of graduates. Other studies (Boudarbat and Montmarquette 2018; Uppal and LaRochelle-Côté 2014) also noted a lower probability of overqualification when educational attainments increase. It therefore appears that as individuals specialize, they decrease their chances of overqualification.

Data table for Chart 4
| Women | Men | |
|---|---|---|
| adjusted overqualification rate (%) | ||
| Bachelor's degree | 15.2 | 17.1 |
| Master's degree | 6.3Note **** | 6.4Note **** |
The overqualification rate is defined as the proportion of bachelor’s or master’s degree graduates of 2012 and 2013 holding a position requiring no more than a high school diploma during the 2016 Census reference week. For more information on the calculation of adjusted rates and adjusted gaps, see the section entitled “Data sources, definitions and modelling.” Source: Integrated Postsecondary Student Information System – T1 Family File – 2016 Census file. |
||
| Adjusted rate | Adjusted gap | |
|---|---|---|
| percent | percentage points | |
| Education | 5.4 | 1.9Note ** |
| Visual and performing arts, and communications technologies | 20.5 | 17.0Note **** |
| Humanities | 22.3 | 18.8Note **** |
| Social and behavioural sciences and law | 7.2 | 3.7Note **** |
| Business, management and public administration | 5.4 | 2.0Note **** |
| Physical and life sciences and technologies | 6.2 | 2.7Note **** |
| Mathematics, computer and information sciences | 6.4 | 2.9Note **** |
| Architecture, engineering, and related technologies | 3.5 | RC |
| Agriculture, natural resources and conservation | 6.3 | 2.9Note **** |
| Health and related fields | 2.7 | -0.8 |
| Personal, protective and transportation services and other fields | 9.6 | 6.1 |
The overqualification rate is defined as the proportion of master’s degree graduates of 2012 and 2013 holding a position requiring no more than a high school diploma during the 2016 Census reference week. For more information on the calculation of adjusted rates and adjusted gaps, see the section entitled “Data sources, definitions and modelling.” Source: Integrated Postsecondary Student Information System – T1 Family File –2016 Census file. |
||
For these graduates, the overqualification rate also varied by field of study (Table 7). Due to the small sample size, the file does not allow for the calculation of the overqualification rate adjusted for sex and the field of study, so it is presented for both sexes combined. The gaps in adjusted overqualification rates were similar to those observed for bachelor’s degree graduates. There were relatively small deviations in the fields of health and related fields and education from the reference category (architecture, engineering, and related technologies), while there were larger deviations in the fields of humanities and visual and performing arts, and communications technologies (19 and 17 percentage points).
Conclusion
Overqualification of university graduates is an important issue that can have many consequences, not only for overqualified graduates, but also for the economy as a whole. The findings of this study were obtained using a new database, resulting from the combination of the Postsecondary Student Information System (PSIS) administrative file, the T1 Family File (T1FF) and the 2016 Census.Note This article is of particular interest, given that only bachelor’s degree holders who graduated in 2012 and 2013 and were under the age of 35 were examined. These graduates were therefore mostly new entrants into the labour market in 2016.
Bachelor’s degree graduates from 2012 and 2013 were similar to those of other cohorts: they were more likely to be female (60%) and under the age of 30 (at least 83%). In addition, 4 out of 10 graduates had graduated from the fields of business, management and public administration and social and behavioural sciences and law. The fields of health and related fields and education accounted for 37% of women in these cohorts, while 27% of men had a degree in architecture, engineering, and related technologies or in mathematics, computer and information sciences. The large number of observations in the new database is useful to focus on graduates belonging to groups designated as a visible minority (GDVM). Among the graduates examined, between 11% and 18% were immigrants and members of a GDVM or Canadian-born individuals who belong to a GDVM, 4% were immigrants who did not belong to a GDVM, and the remaining nearly two-thirds were Canadian-born individuals who did not belong to a GDVM.
Taking into account differences in 2012 and 2013 graduates’ demographic characteristics and fields of study, female bachelor’s degree graduates were less likely than their male counterparts to hold a low-skill job (high school level and lower). This was the case for 15.2% of women, compared with 17.7% of men, resulting in a gap of 2.5 percentage points. In recent decades, there has been a reversal of the overqualification gap between sexes. This reversal has been gradual and could be explained by a certain concentration of women in the fields of health and related fields and education, which have historically had low overqualification rates. In addition, the shortage of education and health care workers combined with an aging population that increases pressure on health care demand could also explain this reversal.
Belonging to a visible minority group is associated with a higher risk of overqualification among women. In fact, this link was observed among both immigrant and Canadian-born graduates, whose overqualification rates were 16.4% and 17.5%, respectively, compared with 14.7% for their Canadian-born counterparts who do not belong to a GDVM. The largest gaps were among Canadian-born Black women and immigrant Black women, for whom the rates were 22.1% and 23.0%, respectively, compared with 14.8% for Canadian-born women who do not belong to a GDVM. Among men, the largest gaps were also observed for Canadian-born Black men (26.5% compared with 17.6% for Canadian-born men who are not visible minorities, the reference group) and for Canadian-born South Asian men (21.1%). On the contrary, the Chinese immigrant group had a significantly lower rate (14.8%) than that of reference group.
However, as seen in several studies, some fields of study are associated with lower overqualification rates. Among women, health and related fields (3.9%) and education (5.3%) had the lowest rates, and the humanities (30.8%) and visual and performing arts, and communications technologies (27.0%) had the highest rates. Among men, the lowest overqualification rates were seen in the fields of architecture, engineering, and related technologies (5.8%) and in the field of mathematics, computer and information sciences (7.7%), while the highest rates were seen in the humanities (30.1%) and social and behavioural sciences and law (29.1%).
The overqualification rate for bachelor’s degree graduates tended to be lower in Newfoundland and Labrador and the Territories, Quebec, Saskatchewan, Alberta and British Columbia, and higher in Ontario.
The overqualification rate appears to decrease as graduates gain experience in the labour market and as employment conditions for new entrants to the labour market improve. Women who graduated in 2012 had an overqualification rate of 13.9%, which is 2.7 percentage points lower than that of graduates of 2013. Among men, the gap was 1.8 percentage points (16.5% versus 18.3%).
Increasing one’s educational attainment was associated with a lower probability of overqualification. Although there are fewer graduates with a master’s degree, the file provided a glimpse into this group’s experiences. Their adjusted overqualification rate was nearly two-and-a-half times lower than for bachelor’s degree graduates. The fields of health and related fields, education, architecture, engineering, and related technologies also stood out for these graduates, with significantly lower rates than the other fields of study.
It will be important to examine these trends with the 2021 Census. It will then be possible to examine more cohorts at different times after graduation. It may be important to complement the census data, which will focus on income earned in 2020 compared with income earned in other years using the T1 Family File, to be able to isolate the impact of COVID-19.
Start of text boxData sources
The Education and Labour Market Longitudinal Platform (ELMLP) was designed to combine the Postsecondary Student Information System (PSIS) administrative file with other data sources to expand on the PSIS information and fill some data gaps. This provides answers to several questions about students’ career paths and their labour market outcomes after graduation. The PSIS is incorporated with the T1FF file on a regular basis, starting with 2010 graduates. When this article was being written, data for 2010 to 2016 graduates had been incorporated with T1FF data up to the 2018 tax year. This provides information on the annual earnings of graduates after graduation and on their geographic mobility.
This study shows a new integration of the PSIS data and the 2016 Census data. Although it is possible to integrate the cohorts of graduates from 2009 onwards, the analysis presented here focuses only on the 2012 and 2013 cohorts to examine new entrants into the labour market. Most of the job characteristics reported in the census are those of the job held in 2016, so the 2012 and 2013 cohorts have had at least two years to find a job after graduation, which is a recommendation of the “Labour market outcomes for college and university graduates, 2010 to 2016,” which is part of the series Technical Reference Guides for the Education and Labour Market Longitudinal Platform.
The linkage rate between the PSIS–T1FF file and the 2016 Census was 21.3% for the 2012 cohort and 21.4% for the 2013 cohort, which is comparable to the proportion of the Canadian population required to complete the long-form questionnaire, which is 25%, or one in four households. An analysis of the characteristics of the graduates from the PSIS and the related file between the PSIS and the Census 2016 is available upon request. Although selection bias is always possible, this analysis shows that if there is a bias, it is weak.
The PSIS includes several variables similar to those found in the census. However, the variables of immigration status and membership in a visible minority group used in this study come from the census in order to correspond with what was observed in 2016 and because the variables in the census are considered to be of higher quality than those in the administrative data files (since they are based on self-reporting).
All the estimates in this article are weighted using the 2016 Census weights as the data set resulting from the integration of PSIS data with the 2016 Census data corresponds to the 2016 population who obtained their bachelor’s or master’s degree in 2012 or 2013 (as well as other restrictions).
Definitions
Members of groups designated as visible minorities: This refers to persons who belong to a visible minority group as defined by the Employment Equity Act, and if so, the person must identify the group to which they belong.
Immigrants and non-immigrants: The term ‘immigrant’ refers to individuals who are not Canadians by birth and who were admitted to Canada as permanent residents. The term ‘non-immigrant’ refers to individuals who are Canadian by birth.
Age group: Only graduates under the age of 35 were included in this analysis.
Full-time all year: Any person with one or more jobs in which they worked 30 hours or more per week for at least 40 weeks in 2015.
Definition of overqualification
Overqualification can be defined in several ways, and the results depend on the method used. Two main methods are used in the literature: the subjective method, in which the workers themselves assess whether they are more or less qualified than what is required by their jobs; and the statistical or objective method, in which the workers’ educational attainment is compared with the attainment required by the occupation in which they are employed. According to this latter approach, which is the one adopted in this article, overqualification is when an individual’s educational attainment is higher than the skill level required for the occupation.
There may also be a mismatch when a worker is less qualified than what is required for their occupation, but this subject is not covered in this article.
The statistical approach requires a database with information on the educational attainment and skill level of the occupation. These two pieces of information can be found in the 2016 Census. Occupational skill level is determined by a five-level scale:
Skill level required for the occupation
- Managers
- Professionals (university level)
- Technicians (college level)
- Secondary school training
- On-the-job training, less than a secondary school diploma
This article focuses on the results of bachelor’s degree graduatesNote in jobs requiring a high school education or less. This group is examined for two main reasons. First, the bachelor’s degree is the educational qualification with the most observations, which allows the results to be presented by a larger number of factors. Second, the concept of ‘overqualification’ defined by comparing educational attainment to that required for an occupation has some limitations and may sometimes be inaccurate, because there may be overlap between certain skill levels, especially if they are close together. Thus, even though, strictly speaking, a person with a bachelor’s degree who holds a position requiring a college-level certificate or diploma could be considered overqualified, some inaccuracies could lead to overestimating overqualification. Using a more conservative definition (considering bachelor’s degree graduates who have a position requiring a high school diploma or less to be ‘overqualified’) ensures that it is likely to be overqualification, since it is easy to see that a person with a bachelor’s degree who holds a position requiring a high school diploma or less (such as a taxi driver, waiter or salesperson, etc.) is overqualified for their position.
By comparison, if only bachelor’s degree graduates with a job requiring a high school diploma or less are considered to be overqualified (‘narrow’ concept), or if graduates who hold a college-level position or less (‘broad’ concept) are added, the rate increases from 18% and 21%, based on the narrow definition and the year of graduation, to 38% and 39% based on the broad definition.
Modelling
The adjusted overqualification rates and the adjusted gaps of the rates presented in Charts 1, 3 and 4 and Tables 4 to 7 are derived from the estimation of logistic regression models (logit-type).
The dependent variable of all the estimated models was the probability of overqualification, with a value of 1 when the graduate held a position requiring a high school diploma or less and 0 for others. The variance for all the following models was calculated using the 2016 Census bootstrap weights. The models included the following variables:
Chart 1: A model combining male and female bachelor’s degree graduates was estimated on the following variables: sex, province of residence in 2016, field of study, graduation year, immigration status combined with membership in a group designated as a visible minority, Aboriginal identity, age group, and whether or not they had a full-time job (30 hours or more per week) for at least 40 weeks in 2015.
Chart 3 and Tables 4 to 6: Separate models for male and female bachelor’s degree graduates were estimated on the following variables: province of residence in 2016, field of study, graduation year, immigration status combined with membership in a group designated as a visible minority, Aboriginal identity, age group, and whether or not they had a full-time job (30 hours or more per week) for at least 40 weeks in 2015.
Chart 4: A model combining bachelor’s and master’s graduates for both sexes was estimated on the following variables: educational attainment, province of residence in 2016, field of study, graduation year, immigration status combined with membership in a group designated as a visible minority, Aboriginal identity, age group, and whether or not they had a full-time job (30 hours or more per week) for at least 40 weeks in 2015.
Table 7: A model combining male and female master’s degree graduates was estimated on the following variables: sex, province of residence in 2016, field of study, graduation year, immigration status combined with membership in a group designated as a visible minority, Aboriginal identity, age group, and whether or not they had a full-time job (30 hours or more per week) for at least 40 weeks in 2015.
References
Boudarbat, B., and C. Montmarquette. 2017. “La surqualification professionnelle chez les diplômés des collèges et des universités : État de la situation au Québec.” Centre interuniversitaire de recherche en analyse des organisations (CIRANO) Project reports 2017RP-03, CIRANO, Montréal.
Cornelissen, L. and M. Turcotte, 2020. “Persistent overqualification among immigrants and non-immigrants.” Insights on Canadian Society, Catalogue no. 75-006-X, ISSN 2291-0859.
Finnie, R. 2004. “The School-to-Work Transition of Canadian Post-Secondary Graduates: a Dynamic Analysis.” Journal of Higher Education Policy and Management, Vol. 26, No. 1, p. 35-58.
Frenette, M. 2000. “Overqualified? Recent graduates and the needs of their employers.” Quarterly Education Review, Vol. 7, No. 1, pp. 7-22.
Galarneau, D. and R. Morissette, 2008. “Immigrants’ education and required job skills.” Perspectives on Labour and Income, Vol. 9, no. 12., Statistics Canada Catalogue no. 75-001-X, pp. 5-19.
Statistics Canada. 2020. “Labour market outcomes for college and university graduates, 2010 to 2016.” Technical Reference Guide for the Education and Labour Market Longitudinal Platform, November 5, 2020, Statistics Canada Catalogue no. 37-20-0001. Available at: https://www150.statcan.gc.ca/n1/pub/37-20-0001/372000012020004-eng.htm
Statistics Canada. 2017. “Are young bachelor’s degree holders finding jobs that match their studies?” Census in Brief, Statistics Canada Catalogue no. 98-200-X2016025, ISBN 978-0-660-23759-6. Available at: https://www12.statcan.gc.ca/census-recensement/2016/as-sa/98-200-x/2016025/98-200-x2016025-eng.cfm
Uppal, S. and S. LaRochelle-Côté. 2014. “Overqualification among recent university graduates in Canada,” Insights on Canadian Society, Statistics Canada Catalogue no. 75-006-X201400111916.
- Date modified: