


|
|
| |
Information identified as archived is provided for reference, research or recordkeeping purposes. It is not subject to the Government of Canada Web Standards and has not been altered or updated since it was archived. Please "contact us" to request a format other than those available.
| Analysis of income in Canada
2002 Chapter II : Market income Market income includes the earnings that Canadians receive from employment. Also included in market income is investment and private pension income. For the majority of Canadians, particularly those of "working age" (aged 16 to 64), money from employment constitutes the highest proportion of market income. In 2002, 89% of aggregate market income came from employment. Improvement in the labour market in 2002 Market income is closely linked to labour market conditions. According to data from the Labour Force Survey, there was a rise of 1.0% in the employment rate (i.e. the number of people employed compared to the working age population) from 2001 to 62% in 2002. This increase was due mainly to a 1.3% growth in the participation rate, which climbed in 2002 to 67%. In contrast, the unemployment rate rose between 2001 and 2002. It was at 7.7% in 2002 compared to a rate of 7.2% in 2001. The increase in the unemployment rate in 2002 was largely caused by more working age people looking for work. In 2002, real GDP per capita increased by 3.4%. Little change in market income in 2002 after five consecutive years of growth Average market income for Canadian families of two or more people was estimated at $65,900 in 2002, virtually unchanged from 2001 (-0.2%) after adjusting for inflation (as measured by changes in the Consumer Price Index). This represents a pause after five consecutive years of growth. Average market income has increased by over 17% (on average 2.7% per year) since the low in 1996, when it was estimated at $56,200. Average market income for persons not living in families (unattached individuals) was $25,600 in 2002 compared to $25,200 in 2001 (+1.6%). Unattached persons' average market income has not declined since 1996 and grew by 20% between 1996 and 2002. For all provinces, average market income for families of two or more people changed only slightly in 2002. Nevertheless, between 1996 and 2002, average market income increased in all provinces from a minimum of 6.9% in Prince Edward Island to a maximum of 22.8% in Nova Scotia. After increasing between 1996 and 2001, a generalized pause in market income in 2002 for the main family types Market income for two parent families was estimated at $78,100 in 2002, virtually unchanged from 2001 ($78,000). In contrast, average market income for all two parent families increased between 1996 and 2002 by 19%. This growth corresponds to an average increase in average market income of $2.9% per year. Average market income for female lone parent families rose from $18,500 to $27,300 between 1996 and 2001. In 2002, this figure was $25,600. In all cases, the average annual increase between 1996 and 2002 was 5.6%. Elderly families (in which the major income recipient is 65 or older) saw their average market income increase by 16% between 1996 and 2002. During this period, there was steady growth in the average market income, which rose from $25,500 to $29,600. Finally, the average market income of married couples without children who are not elderly persons rose from $61,500 in 1996 to $69,500 in 2002, an increase of 13%. In contrast, this income was virtually unchanged from 2001 to 2002 (-1.6%). Market income of working age unattached women had increased since 1996 Average market income for unattached working age women jumped 27% between 1996 and 2002, while that of their male counterparts rose by 19%. The gap in average market income between unattached working-age men and women fell from $5,100 in 1996 to $4,400 in 2002. Difference in market income between all men and women narrowed in 2002 The difference in average market income (for recipients of market income of all ages) between all men and women rose steadily until 2001 when it reached $15,200. In 2002, the difference narrowed slightly, as market income for men was $38,200 compared to $23,500 for women. Market income trend varied among quintiles Between 1996 to 2002, average market income for families in the lowest quintile increased by $3,200 (+35%), while the increase for families in the highest quintile was $21,100 (+17%). Chart 2.1

Chart 2.2
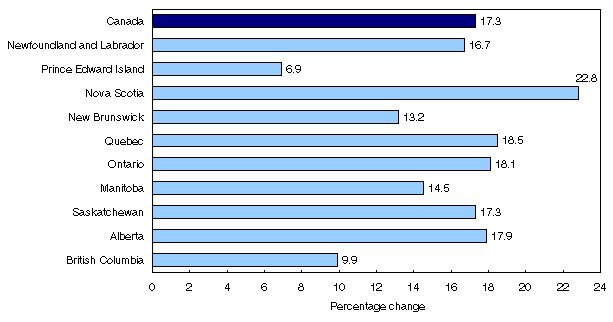
Chart 2.3

Chart 2.4

|

|
|


