
Insights on Canadian Society
Feeling the heat: More than half of Canadians are highly concerned about climate change

Text begins
Overview of the study
This study uses data from the Canadian Social Survey (2025) to explore Canadians’ beliefs about the effects of climate change, their feelings of concern and stress about climate change, and the actions they take as individuals to reduce their environmental impact.
- While 39% of Canadians believe they personally will be among those most affected by climate change, more than four in five Canadians (81%) believe future generations will be among those most affected.
- Over half of Canadians (53%) are “very” or “extremely” concerned about climate change, with Canadians aged 65 and older (59%), women (59%), and university graduates (60%) reporting higher levels of concern than their counterparts.
- Just under one-third (30%) of Canadians reported that they feel stressed about climate change at least once a month. This percentage was higher among women (34%), university graduates (35%) and people in urban areas (31%) than among their counterparts.
- Canadians who were both highly concerned about climate change and reported feeling stressed about climate change at least once a month were more likely to take actions to reduce their environmental impact—such as reducing energy consumption or reducing food waste—than Canadians who expressed lower levels of concern about climate change.
Introduction
Climate change is a global phenomenon, and each of the last three decades has been successively warmer than any previous decade since the
Along with physical changes to ecosystems, researchers have increasingly found that climate-related hazards in Canada and abroad can have a mental health impact, with some people experiencing symptoms of post-traumatic stress disorder, depression or anxiety related to ecological disasters and climate
In Canada, national-level statistics on the psychological impacts of climate change remain an important data gap. Using data from the Canadian Social Survey – Quality of Life, Climate Change and Trust, collected from April 25 to June 16, 2025, this study examines Canadians’ beliefs about the effects of climate change and their feelings of concern and frequency of stress about it. Finally, this study examines the relationship between concern, stress and actions taken to reduce individual environmental impact.
Women and university graduates were more likely to believe in the effects of climate change
To understand perceptions of the impacts of climate change, the Canadian Social Survey (CSS) asked the following question: “Who or what do you think will be most affected by climate change?” Respondents could select either “none of the above” or multiple-choice categories that ranged from immediately personal effects—“you, personally,” “your family” and “people in your community”—to more general effects—“people in Canada,” “people in lower-income countries,” “plants and animals,” and “future generations of people.”
Overall, 94% of Canadians believed climate change would affect at least one of the multiple-choice categories, while 6% believed it would affect “none of the above” (see text box Men and rural residents were more likely to select “none of the above” when asked who would be most affected by climate change). Canadians were also more likely to report belief in the more general effects from climate change than more immediately personal ones. For example, among all categories of potential impacts, the most frequently selected was “future generations of people,” at 81%, while the least frequently selected was “you, personally,” at 39%. This trend across categories was broadly consistent with results from the Program of Applied Research on Climate Action, which found that 33% of Canadians thought that climate change would harm them personally, while a higher percentage (41%) stated that their province or territory was experiencing climate
In all cases, women were more likely to think that climate change would affect any of the multiple-choice categories than men (Chart 1). This result is consistent with other research on gender differences, which has found that women are slightly but consistently more likely than men to report belief in and concern about climate
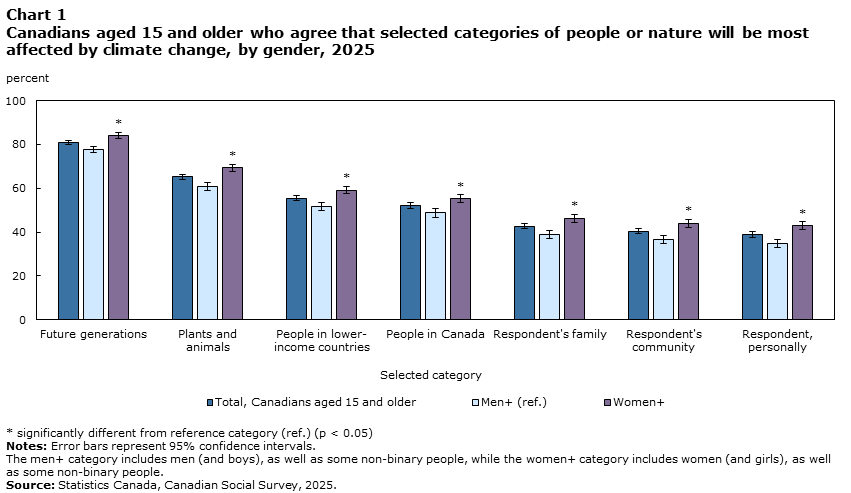
Data table for Chart 1
| Selected category | Total, Canadians aged 15 and older | Men+ (ref.) | Women+ | ||||||
|---|---|---|---|---|---|---|---|---|---|
| percentage | 95% confidence interval | percentage | 95% confidence interval | percentage | 95% confidence interval | ||||
| lower | upper | lower | upper | lower | upper | ||||
The men+ category includes men (and boys), as well as some non-binary people, while the women+ category includes women (and girls), as well as some non-binary people. Source: Statistics Canada, Canadian Social Survey, 2025. |
|||||||||
| Future generations | 80.9 | 79.9 | 81.9 | 77.8 | 76.2 | 79.3 | 84.0 Data table for Chart 1 Note * | 82.7 | 85.3 |
| Plants and animals | 65.2 | 64.0 | 66.4 | 60.9 | 59.1 | 62.8 | 69.4 Data table for Chart 1 Note * | 67.8 | 71.1 |
| People in lower-income countries | 55.5 | 54.2 | 56.7 | 51.8 | 50.0 | 53.7 | 59.1 Data table for Chart 1 Note * | 57.4 | 60.8 |
| People in Canada | 52.0 | 50.7 | 53.4 | 48.8 | 46.9 | 50.8 | 55.2 Data table for Chart 1 Note * | 53.4 | 57.0 |
| Respondent's family | 42.7 | 41.4 | 44.0 | 39.1 | 37.2 | 40.9 | 46.3 Data table for Chart 1 Note * | 44.5 | 48.1 |
| Respondent's community | 40.4 | 39.2 | 41.6 | 36.8 | 35.0 | 38.5 | 44.0 Data table for Chart 1 Note * | 42.2 | 45.8 |
| Respondent, personally | 38.9 | 37.6 | 40.2 | 34.8 | 33.0 | 36.7 | 42.9 Data table for Chart 1 Note * | 41.2 | 44.7 |
Though being personally affected was the least common response, some groups were more likely to think they would be personally affected: university graduates (43% compared with 34% of people without a high school diploma), residents of Quebec (43% compared with 39% of Ontario residents) and urban residents (40% compared with 34% of rural
When considering the effects of climate change on people in Canada, university graduates and urban residents remained more likely to believe that climate change would have an effect. People aged 65 and older were also more likely to think that climate change would affect people in Canada (58%) than younger Canadians (e.g., 50% among those aged 15 to
Education continued to have a strong association with the belief that climate change would affect future generations of people, with 85% of university graduates selecting this response, compared with 78% of people without a high school diploma. There were variations in this response between provinces as well: Albertans were the least likely to believe future generations would be affected (75% compared with 79% in Ontario), while over 85% of people in Newfoundland and Labrador, Nova Scotia, and Quebec said that climate change would affect future
Start of text box
Men and rural residents were more likely to select “none of the above” when asked who would be most affected by climate change
A relatively small percentage of respondents (6%) selected “none of the above” for the question of “Who or what do you think will be most affected by climate change?” Men were more likely to choose this response (8%) compared with women (4%), as were rural residents (9%) compared with urban residents (6%). Middle-aged Canadians (ages 35 to 54) were the age group most likely to select “none of the above.” By province, 13% of Albertans selected “none of the above,” as did 9% of Manitobans, compared with 6% of Ontarians and 3% of Quebec
People who answered “none of the above” when asked who or what would be most affected by climate change were also more likely to get their information from different sources than other Canadians. Canadians who answered “none of the above” were less likely to get their information from traditional news organizations (43%), compared with the Canadian average (66%). They were four times less likely to report high levels of trust in the Canadian media (8%) than the Canadian average (32%). They were also less likely to get information from official government communications (18%) than the Canadian average
End of text box
More than half of Canadians are highly concerned about climate change
Overall, 53% of Canadians reported being highly (either “very” or “extremely”) concerned about climate change, and another 31% reported being “somewhat” concerned. Conversely, 16% reported that they were “not very” or “not at all” concerned about climate change.
Gender and education were once again important factors related to concern, with women (59%) being more likely to report being highly concerned about climate change than men (48%) and university graduates (60%) more likely to be highly concerned than people without a high school diploma (46%) (Table 1). Further, people in urban areas were more likely to report high levels of concern (54%) than those in rural areas (45%).
| Selected socioeconomic and geographic characteristics | High level of concern about climate change | |||
|---|---|---|---|---|
| percentage | 95% confidence interval | predicted probability | ||
| lower | upper | |||
The men+ category includes men (and boys), as well as some non-binary people, while the women+ category includes women (and girls), as well as some non-binary people. Source: Statistics Canada, Canadian Social Survey, 2025. |
||||
| Gender | ||||
| Men+ (ref.) | 47.9 | 46.0 | 49.8 | 49.9 |
| Women+ | 58.6 | 56.9 | 60.4 | 60.3 Table 1 Note * |
| Age group | ||||
| 15 to 24 years (ref.) | 50.7 | 46.5 | 55.0 | 51.9 |
| 25 to 34 years | 54.2 | 50.6 | 57.8 | 55.2 |
| 35 to 44 years | 50.1 | 47.1 | 53.1 | 51.3 |
| 45 to 54 years | 50.2 | 47.2 | 53.3 | 51.1 |
| 55 to 64 years | 52.7 | 49.9 | 55.4 | 53.9 |
| 65 years and older | 59.0 | 56.8 | 61.1 | 60.7 Table 1 Note * |
| Educational attainment | ||||
| Less than high school diploma (ref.) | 45.7 | 41.6 | 49.8 | 46.5 |
| High school diploma or equivalent | 51.2 | 48.4 | 54.0 | 52.3 |
| Postsecondary certificate or diploma below bachelor's level | 51.8 | 49.8 | 53.9 | 53.7 |
| University - bachelor's degree or higher | 60.1 | 58.0 | 62.2 | 61.2 Table 1 Note * |
| Marital status | ||||
| Married (ref.) | 53.9 | 52.2 | 55.6 | 55.7 |
| Living common law | 52.5 | 48.7 | 56.3 | 54.8 |
| Never married | 52.1 | 49.4 | 54.8 | 54.1 |
| Separated | 51.9 | 45.2 | 58.5 | 54.0 |
| Divorced | 59.6 | 54.7 | 64.5 | 61.9 |
| Widowed | 50.5 | 45.7 | 55.3 | 52.4 |
| Immigrant status | ||||
| Non-immigrant (ref.) | 51.3 | 49.9 | 52.7 | 54.0 |
| Immigrant | 57.7 | 55.0 | 60.3 | 59.8 |
| Non-permanent resident | 61.1 | 49.5 | 72.8 | 61.7 |
| Province | ||||
| Newfoundland and Labrador | 53.4 | 47.8 | 58.9 | 55.4 |
| Prince Edward Island | 55.9 | 49.1 | 62.7 | 58.4 |
| Nova Scotia | 61.2 | 56.1 | 66.4 | 63.3 |
| New Brunswick | 48.6 | 43.4 | 53.8 | 51.0 |
| Quebec | 52.1 | 49.3 | 54.8 | 54.6 |
| Ontario (ref.) | 57.0 | 54.9 | 59.2 | 59.0 |
| Manitoba | 52.5 | 47.4 | 57.6 | 54.3 |
| Saskatchewan | 44.4 | 39.0 | 49.7 | 46.4 Table 1 Note * |
| Alberta | 41.8 | 37.8 | 45.8 | 44.1 Table 1 Note * |
| British Columbia | 55.2 | 52.0 | 58.4 | 57.4 |
| Area type | ||||
| Rural | 45.5 | 42.1 | 48.9 | 48.7 Table 1 Note * |
| Urban (ref.) | 54.4 | 53.0 | 55.8 | 56.6 |
Journalism and policy discussions on climate change often focus on youth, especially because younger people will face the long-term impacts of climate
Examining the intersection of education and gender, university-educated women were more likely to express high levels of concern about climate change than their male counterparts who were not university graduates, both at ages 25 to 34 and after age 55 (Chart 2).
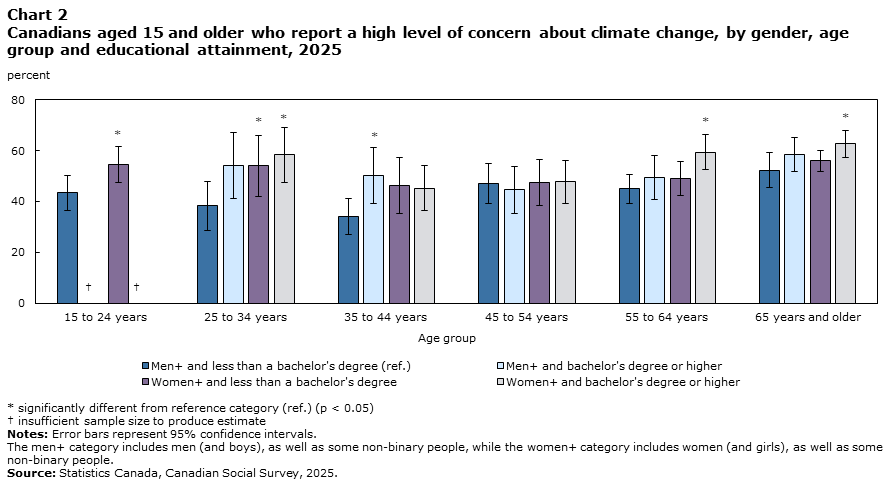
Data table for Chart 2
| Age group | Gender and educational attainment | |||||||||||
|---|---|---|---|---|---|---|---|---|---|---|---|---|
| Men+ | Women+ | |||||||||||
| Less than a bachelor's degree (ref.) | Bachelor's degree or higher | Less than a bachelor's degree | Bachelor's degree or higher | |||||||||
| percentage | 95% confidence interval | percentage | 95% confidence interval | percentage | 95% confidence interval | percentage | 95% confidence interval | |||||
| lower | upper | lower | upper | lower | upper | lower | upper | |||||
The men+ category includes men (and boys), as well as some non-binary people, while the women+ category includes women (and girls), as well as some non-binary people. Source: Statistics Canada, Canadian Social Survey, 2025. |
||||||||||||
| 15 to 24 years | 43.4 | 36.4 | 50.4 | Data table for Chart 2 Note † | Data table for Chart 2 Note † | Data table for Chart 2 Note † | 54.5 Data table for Chart 2 Note * | 47.5 | 61.5 | Data table for Chart 2 Note † | Data table for Chart 2 Note † | Data table for Chart 2 Note † |
| 25 to 34 years | 38.2 | 28.6 | 47.9 | 54.2 | 41.3 | 67.2 | 54.1 Data table for Chart 2 Note * | 42.1 | 66.1 | 58.4 Data table for Chart 2 Note * | 47.6 | 69.2 |
| 35 to 44 years | 34.0 | 26.9 | 41.1 | 50.3 Data table for Chart 2 Note * | 39.2 | 61.3 | 46.4 | 35.3 | 57.4 | 45.1 | 36.3 | 54.0 |
| 45 to 54 years | 47.1 | 39.1 | 55.0 | 44.6 | 35.4 | 53.8 | 47.4 | 38.3 | 56.5 | 47.8 | 39.4 | 56.2 |
| 55 to 64 years | 45.0 | 39.3 | 50.6 | 49.3 | 40.7 | 57.9 | 49.1 | 42.3 | 55.9 | 59.5 Data table for Chart 2 Note * | 52.5 | 66.5 |
| 65 years and older | 52.4 | 45.4 | 59.4 | 58.5 | 51.7 | 65.3 | 56.1 | 51.9 | 60.2 | 62.7 Data table for Chart 2 Note * | 57.4 | 68.1 |
Nearly one-third of Canadians report being stressed about climate change at least once a month
In 2025, almost one-third of Canadians (30%) reported that they felt stressed about climate change at least once a month in the previous
| Selected socioeconomic and geographic characteristics | At least monthly stress about climate change | |||
|---|---|---|---|---|
| percentage | 95% confidence interval | predicted probability | ||
| lower | upper | |||
The men+ category includes men (and boys), as well as some non-binary people, while the women+ category includes women (and girls), as well as some non-binary people. Source: Statistics Canada, Canadian Social Survey, 2025. |
||||
| Gender | ||||
| Men+ (ref.) | 25.2 | 23.5 | 26.9 | 25.0 |
| Women+ | 34.4 | 32.7 | 36.1 | 34.2 Table 2 Note * |
| Age group | ||||
| 15 to 24 years (ref.) | 32.5 | 28.7 | 36.3 | 33.2 |
| 25 to 34 years | 34.1 | 30.5 | 37.6 | 34.7 |
| 35 to 44 years | 29.4 | 26.6 | 32.2 | 30.1 |
| 45 to 54 years | 24.3 | 21.7 | 26.9 | 24.7 Table 2 Note * |
| 55 to 64 years | 27.0 | 24.5 | 29.5 | 27.5 |
| 65 years and older | 30.4 | 28.5 | 32.3 | 31.3 |
| Educational attainment | ||||
| Less than high school diploma (ref.) | 25.6 | 22.0 | 29.3 | 24.8 |
| High school diploma or equivalent | 28.9 | 26.2 | 31.6 | 28.4 |
| Postsecondary certificate or diploma below bachelor's level | 27.8 | 25.9 | 29.7 | 27.7 |
| University - bachelor's degree or higher | 34.6 | 32.6 | 36.7 | 34.2 Table 2 Note * |
| Marital status | ||||
| Married (ref.) | 28.1 | 26.4 | 29.7 | 28.2 |
| Living common law | 30.1 | 26.8 | 33.4 | 30.2 |
| Never married | 31.6 | 29.0 | 34.3 | 31.7 |
| Separated | 35.3 | 29.1 | 41.5 | 36.2 |
| Divorced | 32.2 | 27.8 | 36.6 | 33.5 |
| Widowed | 28.3 | 23.4 | 33.2 | 29.1 |
| Immigrant status | ||||
| Non-immigrant (ref.) | 29.2 | 27.9 | 30.6 | 29.4 |
| Immigrant | 30.7 | 28.1 | 33.2 | 31.0 |
| Non-permanent resident | 37.5 | 25.8 | 49.2 | 37.1 |
| Province | ||||
| Newfoundland and Labrador | 26.0 | 20.9 | 31.1 | 26.5 |
| Prince Edward Island | 31.8 | 25.4 | 38.2 | 31.9 |
| Nova Scotia | 33.4 | 28.2 | 38.5 | 33.7 |
| New Brunswick | 22.7 | 18.4 | 27.0 | 22.9 |
| Quebec | 29.7 | 27.2 | 32.2 | 30.5 |
| Ontario (ref.) | 31.9 | 29.7 | 34.1 | 32.1 |
| Manitoba | 27.5 | 23.0 | 32.0 | 27.5 |
| Saskatchewan | 25.2 | 20.7 | 29.7 | 25.4 |
| Alberta | 22.5 | 19.2 | 25.7 | 22.9 Table 2 Note * |
| British Columbia | 32.5 | 29.3 | 35.6 | 32.8 |
| Area type | ||||
| Rural | 24.3 | 21.3 | 27.3 | 24.9 Table 2 Note * |
| Urban (ref.) | 30.6 | 29.2 | 31.9 | 30.7 |
However, unlike the pattern observed among people reporting high concern, young Canadians aged 15 to 34 were slightly more likely to report at least monthly stress (e.g., 33% among ages 15 to 24, and 34% among ages 25 to 34), compared with people aged 45 to 54, at 24%. The finding that about one-third of younger people reported monthly climate stress was consistent with another study, where 37% of Canadian youth aged 13 to 18 responded that climate change was impacting their mental health “a little” or
In comparing the percentage of Canadians who reported at least monthly climate-related stress across the intersections of age group, gender and education, certain groups emerged as being more likely to report such stress (Chart 3). Regardless of educational attainment, women aged 25 to 34 were more likely to report at least monthly stress about climate change than boys and men. However, among Canadians aged 65 and older, about one-third of male and female university graduates (34% of men and 35% of women) reported at least monthly climate stress—a higher percentage than their counterparts without a university degree (27% of women and 25% of men).
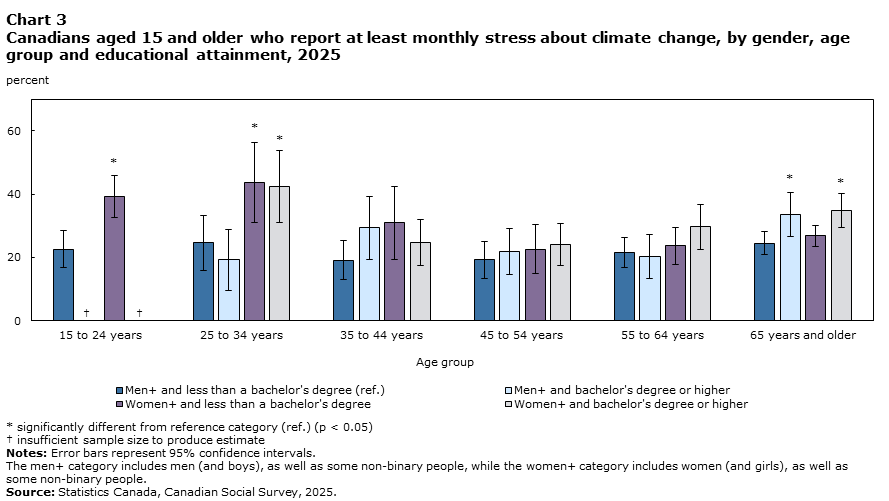
Data table for Chart 3
| Age group | Gender and educational attaintment | |||||||||||
|---|---|---|---|---|---|---|---|---|---|---|---|---|
| Men+ | Women+ | |||||||||||
| Less than a bachelor's degree (ref.) | Bachelor's degree or higher | Less than a bachelor's degree | Bachelor's degree or higher | |||||||||
| percentage | 95% confidence interval | percentage | 95% confidence interval | percentage | 95% confidence interval | percentage | 95% confidence interval | |||||
| lower | upper | lower | upper | lower | upper | lower | upper | |||||
The men+ category includes men (and boys), as well as some non-binary people, while the women+ category includes women (and girls), as well as some non-binary people. Source: Statistics Canada, Canadian Social Survey, 2025. |
||||||||||||
| 15 to 24 years | 22.6 | 16.8 | 28.4 | Data table for Chart 3 Note † | Data table for Chart 3 Note † | Data table for Chart 3 Note † | 39.3 Data table for Chart 3 Note * | 32.7 | 45.8 | Data table for Chart 3 Note † | Data table for Chart 3 Note † | Data table for Chart 3 Note † |
| 25 to 34 years | 24.6 | 15.9 | 33.4 | 19.2 | 9.5 | 28.9 | 43.6 Data table for Chart 3 Note * | 31.0 | 56.2 | 42.4 Data table for Chart 3 Note * | 31.1 | 53.8 |
| 35 to 44 years | 19.1 | 13.0 | 25.3 | 29.3 | 19.3 | 39.4 | 30.9 | 19.4 | 42.4 | 24.8 | 17.5 | 32.1 |
| 45 to 54 years | 19.3 | 13.5 | 25.1 | 21.8 | 14.5 | 29.1 | 22.6 | 14.8 | 30.3 | 24.1 | 17.3 | 30.9 |
| 55 to 64 years | 21.5 | 16.7 | 26.3 | 20.2 | 13.2 | 27.1 | 23.7 | 17.8 | 29.6 | 29.7 | 22.5 | 36.9 |
| 65 years and older | 24.5 | 20.8 | 28.3 | 33.6 Data table for Chart 3 Note * | 26.6 | 40.6 | 26.8 | 23.4 | 30.2 | 34.8 Data table for Chart 3 Note * | 29.4 | 40.3 |
Concern and stress about climate change were both linked to environmental action
To understand how Canadians are taking individual action in the face of climate change and other environmental issues, the CSS asked about actions respondents had taken to “reduce their impact on the environment” in the previous 12 months. Among the actions related to climate change, those most commonly reported were reducing food waste (65%) and reducing energy consumption (57%). Almost one-third (32%) had used public transit, carpooled, biked or walked to work, and 14% had avoided air travel by using other transportation.
Gender and education continued to be relevant when examining environmental actions. Women were more likely than men to reduce their energy consumption (60% compared with 55%, respectively) and their food waste (68% compared with 62%,
Overall, people who reported high concern and high stress were consistently more likely to report taking these environmental actions than people with lower concern about climate change (Chart 4). Even when examining people who were highly concerned about climate change while reporting lower levels of stress, the results showed that they were more likely to reduce their energy consumption (64%) and food waste (72%) than people who expressed low concern about climate change (44% for reducing energy consumption and 53% for reducing food waste).
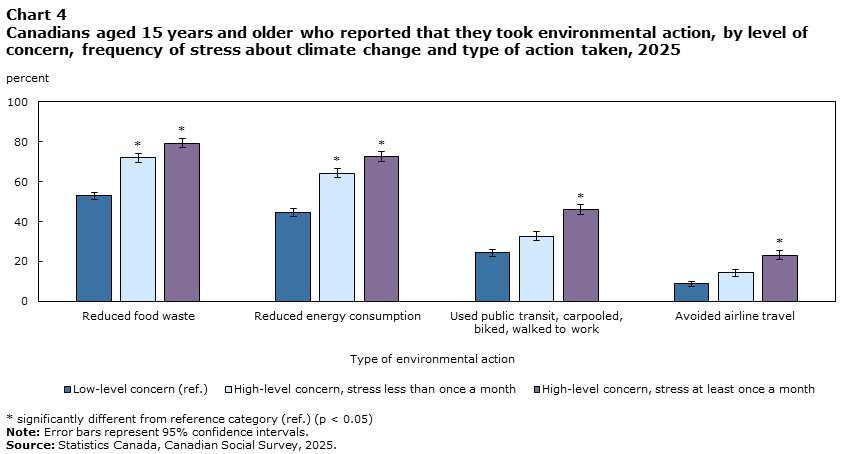
Data table for Chart 4
| Type of environmental action | Level of concern and frequency of stress | ||||||||
|---|---|---|---|---|---|---|---|---|---|
| Low-level concern (ref.) | High-level concern, stress less than once a month | High-level concern, stress at least once a month | |||||||
| percentage | 95% confidence interval | percentage | 95% confidence interval | percentage | 95% confidence interval | ||||
| lower | upper | lower | upper | lower | upper | ||||
Source: Statistics Canada, Canadian Social Survey, 2025. |
|||||||||
| Reduced food waste | 52.9 | 51.1 | 54.8 | 71.9 Data table for Chart 4 Note * | 69.7 | 74.2 | 79.3 Data table for Chart 4 Note * | 77.2 | 81.5 |
| Reduced energy consumption | 44.5 | 42.6 | 46.4 | 64.4 Data table for Chart 4 Note * | 61.9 | 66.8 | 72.6 Data table for Chart 4 Note * | 70.3 | 74.9 |
| Used public transit, carpooled, biked, walked to work | 24.3 | 22.5 | 26.0 | 32.8 | 30.4 | 35.1 | 46.1 Data table for Chart 4 Note * | 43.7 | 48.5 |
| Avoided airline travel | 8.8 | 7.5 | 10.0 | 14.3 | 12.5 | 16.2 | 23.3 Data table for Chart 4 Note * | 21.1 | 25.4 |
Conclusion
This article examined Canadians’ beliefs about who or what would be affected by climate change, their feelings of concern or stress about climate change, and the individual actions that they have taken to reduce their environmental impact. The findings revealed that women and university graduates were more likely to believe climate change would affect various groups of people, as well as plants or animals, and to express high levels of concern about climate change. Despite assumptions that climate change has stronger psychosocial effects on youth, seniors were the most likely age group to report high levels of concern about climate change in Canada. Finally, this article found that higher levels of concern and stress about climate change were associated with a greater likelihood of taking environmental action.
Data sources, methods and definitions
Data for this study are drawn from the Canadian Social Survey – Quality of Life, Climate Change and Trust, collected across the 10 provinces from April 25 to June 16, 2025. The CSS is a cross-sectional survey that collects information on various social topics, including quality of life, energy use and emerging issues, such as climate change. The target population of the CSS includes non-institutionalized people aged 15 or older living off reserve, and excludes the territories, with exclusions representing less than 2% of the Canadian population. The response rate for this wave of the CSS was 40.3%.
The study focused on a CSS module, “Climate Change,” which asked the following questions:
- Who or what do you think will be most affected by climate change? (allowing multiple selections)
- How concerned are you about climate change? (on a scale of “extremely concerned” to “not at all concerned”)
- In the past 12 months, how often did you feel stressed because of climate change? (on a scale of “every day in the last 12 months” to “never”)
- In the past 12 months, which of the following actions have you taken to reduce your impact on the environment? (allowing multiple selections)
In producing survey estimates, survey weights were used to adjust for non-response and to calibrate for population characteristics (age, sex, geography and educational attainment). Bootstrap weights were used to account for sampling error.
Logistic regression models were used to model the association between climate change variables and gender, age group, educational attainment, marital status, immigration status, province, and rural or urban residence. An important limitation of this paper is that household income was not measured by the survey, therefore, regression analyses were limited to the covariates measured on the survey.
References
Ballew, Matthew, Jennifer Marlon, Anthony Leiserowitz and Edward Maibach. 2018. “Gender differences in public understanding of climate change.” Climate Note, Yale University.
Cunsolo, Ashlee, Sherilee L. Harper, Kelton Minor, Katie Hayes, Kimberly G. Williams and Courtney Howard. 2020. “Ecological grief and anxiety: the start of a healthy response to climate change?” The Lancet Planetary Health. Vol. 4, no. 7, pp. e261-e263.
Environment and Climate Change Canada. 2015. The science of climate change.
Galway, Lindsay P. and Ellen Field. 2023. “Climate emotions and anxiety among young people in Canada: A national survey and call to action.” The Journal of Climate Change and Health. Vol. 9.
Hickman, Caroline, Elizabeth Marks, Panu Pihkala, Susan Clayton, R. Eric Lewandowski, Elouise E. Mayall, Britt Wray, Catriona Mellor and Lise van Susteran. 2021. “Climate anxiety in children and young people and their beliefs about government responses to climate change: a global survey.” The Lancet Planetary Health. Vol. 5, no. 12, pp. e863-e873.
Impact Canada. 2023. Report: PARCA Longitudinal Study Wave 6. Program of Applied Research on Climate Action, Environment and Climate Change Canada and Natural Resources Canada and Impact Canada, Impact & Innovation Unit, Privy Council Office.
Intergovernmental Panel on Climate Change. 2023. Climate Change 2023: Synthesis Report. Contribution of Working Groups I, II and III to the Sixth Assessment Report of the Intergovernmental Panel on Climate Change. IPCC, Geneva, Switzerland.
Mendy, Laila, Mikael Karlsson and Daniel Lindvall. 2024. “Counteracting climate denial: a systematic review.” Public Understanding of Science. Vol. 33, no. 4, pp. 504-520.
Natural Resources Canada. 2026. Canadian National Fire Database.
Pihkala, Panu. 2022. “Toward a taxonomy of climate emotions.” Frontiers in Climate. Vol. 3.
Statistics Canada. 2022. “Accounting for ecosystem change, 2021.” Environmental Thematic Maps and Graphics. Statistics Canada Catalogue no. 38-20-0001.
Tiwari, Ishwar, Rebekah Alice McKinnon, Azeezah Jafry, Ekroop Grewal, Jason Gilliland, Kendra Nelson Ferguson, Kiffer G. Card, Maya Gislason, Alina Paula Cosma and Gina Martin. 2025. “Canadian adolescents’ perceptions of how climate change is impacting their mental health: A qualitative analysis of open-ended survey responses.” PLOS Mental Health. Vol. 2, no. 9.
Wu, Judy, Gaelen Snell and Hasina Samji. 2020. “Climate anxiety in young people: a call to action.” The Lancet Planetary Health. Vol. 4, no. 10, pp. e435-e436.
- Date modified: