
Research to Insights: Social, Economic, and Health Perspectives on Climate Change
Skip to text
Text begins
About Research to Insights
The Research to Insights series of presentations features a broad range of findings on selected research topics. Each presentation draws from and integrates evidence from various studies that use innovative and high-quality data and methods to better understand relevant and complex policy issues.
Based on applied research of valuable data, the series is intended to provide decision makers, and Canadians more broadly, a comprehensive and horizontal view of the current economic, social and health issues we face in a changing world.
Background
- Climate change is a long-term shift in weather conditions. It involves changes in both average weather conditions and variability, including extreme weather events. This increases the frequency and severity of precipitation events, flooding, droughts, extreme heat, wildfires and storms.
- There is scientific consensus that human activity is the main cause of climate change, primarily through the burning of fossil fuels. The burning of fossil fuels produces carbon dioxide, which stays in the earth’s atmosphere and causes the earth’s temperature to rise. Other greenhouse gases (GHGs) include nitrous oxide and methane.
- Many aspects of Canadian society affect and are affected by climate change, including nature and biodiversity, infrastructure, the economy, workers, and the health and well-being of Canadians.
- Tackling the causes of climate change and reducing its impact on people, society and the economy is a Canadian priority. Some examples include Canada’s 2030 Emissions Reduction Plan: Canada’s Next Steps for Clean Air and a Strong Economy; Canada’s National Adaptation Strategy; the Federal Sustainable Development Strategy; the Clean Technology and Climate Innovation Strategy; Indigenous-led Natural Climate Solutions; and Climate Science 2050: Advancing Science and Knowledge on Climate Change.
References: Climate change statistics, Causes of climate change and AR6 Synthesis Report: Climate Change 2023.

Description for Figure 1
- June 25 to July 1, 2021—Heat dome over British Columbia and Alberta. Many regions experienced record temperatures over several days.
- November 13 to 15, 2021—Extreme flooding in southwestern British Columbia. More than 200 mm of rain recorded in some areas.
- May 21, 2022—A derecho across Ontario and Quebec brought torrential rains, large hail and downburst winds, resulting in widespread damage.
- September 24, 2022—Fiona made landfall in eastern Nova Scotia with sustained winds of 165 km/h, the force of a category 2 hurricane.
- April 5, 2023—Widespread freezing rain in the Great Lakes and St. Lawrence region caused havoc on roads and public transit systems.
- 2023—Canada experienced the worst wildfire season on record, with more than 15 million hectares burned, causing poor air quality across many regions of Canada and evacuations of towns and cities, including Yellowknife.
Sources: Canada’s top 10 weather stories of 2023 - Canada.ca, Canada’s top 10 weather stories of 2022 - Canada.ca, Canada’s top 10 weather stories of 2021 - Canada.ca.
Economic impacts: Up to 15% of the regional economies in British Columbia were affected by the 2021 flood events
- Fine-grain economic measures are often needed to measure the economic activity at risk from natural disasters.
- Parts of British Columbia were affected by flooding caused by heavy rains from November 13 to 15, 2021.
- While the impacted areas account for a small share of the British Columbia economy, on a regional basis they account for 15.5% of the economy of Fraser River Valley, 4.6% of the economy of Thompson–Nicola and 6.2% of the economy of Okanagan–Similkameen.

Description for Map 1
This is a map showing the intensity of gross domestic product (GDP) creation within 1 square kilometre grid squares by quintile for the Abbotsford and Chilliwack area. Grid squares are shaded based on the value of GDP created by firm locations within the grid squares.
The legend is titled “GDP quintile,” and colours are associated with the quintiles as follows:
- the top quintile in dark maroon (100)
- the second-highest quintile in maroon (80)
- the middle quintile in light maroon (60)
- the second-lowest quintile in dark peach (40)
- the bottom quintile in light peach (20).
The map consists of two parts.
The first part is a wider view of the Abbotsford and Chilliwack area. It includes major roads and has labels for Abbotsford, the Sumas Prairie, Chilliwack, the Trans-Canada Highway, Fraser Valley, British Columbia and the United States. The shaded grid squares show a concentration of dark grid squares over urban areas of Abbotsford and Chilliwack and lighter grid squares around the Sumas Prairie.
The second part is an inset of the Sumas Prairie. It includes a second legend indicating that the extent of flooding is shown with cross hatching.
The inset map shows the flooded areas using cross hatching, as well as the grid squares shaded by quintile. The inset map includes rail lines, roads and highways. It includes labels for
- Abbotsford
- Sahhacum
- Clayburn
- Vye
- Poignant Creek
- McKee Peak
- Straiton
- Kilgard
- Upper Sumas
- Norton
- Marshall Creek
- Arnold Slough
- Arnold
- Sumas Mountain
- Sumas Prairie
- Taggart Peak
- Chadsey Lake
- Barrowtown
- the United States.
The grid squares that correspond to the flooded areas are mostly shaded to show they are in the bottom quintile of GDP values. Some grid squares around the northern part of Abbotsford and around Arnold indicate higher GDP values. About half of the grid squares that are flooded do not show GDP values.
Source: Statistics Canada, authors’ calculations.
Health impacts: Long-term wildfire exposure is associated with increased risk of lung cancer and brain tumours
- The number of wildfires and areas burned has increased in Canada, affecting air quality.
- Wildfires emit carcinogenic pollutants that contaminate air, water, land and indoor environments.
- There was a 4.9% higher incidence of lung cancer and a 10% higher incidence of brain tumours for people living within 50 km of a wildfire in the past 10 years compared with the unexposed population (excluding the people living in large Canadian cities).
- Other cancers examined did not see a significantly increased risk.

Data table for Chart 1
| Cancer outcome | Coefficient | 2.5 percentile | 97.5 percentile |
|---|---|---|---|
| hazard ratio | |||
| Lung cancer | 1.049 | 1.028 | 1.071 |
| Brain cancer | 1.100 | 1.026 | 1.179 |
| Non-Hodgkin lymphoma |
1.002 | 0.964 | 1.042 |
| Multiple myeloma | 1.019 | 0.952 | 1.092 |
| Leukemia | 1.002 | 0.955 | 1.052 |
| Source: Korsiak J, Pinault L, Christidis T, et al., May 2022, "Long-term exposure to wildfires and cancer incidence in Canada: A population-based observational cohort study," The Lancet Planetary Health 6(5). | |||
Health impacts: More than 200 excess deaths were attributable to extreme heat events in Montréal and Toronto from 2000 to 2020
- Exposure to extreme heat is one of the most direct impacts of climate change on health. There has been, and will be, an increase in the frequency and intensity of extreme heat events.
- In 12 large Canadian cities (with population sizes of at least 500,000), daily mortality risk was 2% to 8% higher than average during extreme heat events from 2000 to 2020.
- The impacts of heat were stronger for older adults (aged 65 and older) than for younger adults.
- Approximately 295 excess deaths in Montréal and 250 excess deaths in Toronto were attributable to extreme heat events in these cities during this period.

Data table for Chart 2
| Mortality outcome | Cumulative excess deaths | |
|---|---|---|
| Montréal | ||
| 2000 | Non-accidental deaths | 0 |
| 2001 | Non-accidental deaths | 27 |
| 2002 | Non-accidental deaths | 58 |
| 2003 | Non-accidental deaths | 67 |
| 2004 | Non-accidental deaths | 70 |
| 2005 | Non-accidental deaths | 87 |
| 2006 | Non-accidental deaths | 95 |
| 2007 | Non-accidental deaths | 107 |
| 2008 | Non-accidental deaths | 107 |
| 2009 | Non-accidental deaths | 111 |
| 2010 | Non-accidental deaths | 135 |
| 2011 | Non-accidental deaths | 139 |
| 2012 | Non-accidental deaths | 148 |
| 2013 | Non-accidental deaths | 156 |
| 2014 | Non-accidental deaths | 160 |
| 2015 | Non-accidental deaths | 164 |
| 2016 | Non-accidental deaths | 197 |
| 2017 | Non-accidental deaths | 205 |
| 2018 | Non-accidental deaths | 258 |
| 2019 | Non-accidental deaths | 266 |
| 2020 | Non-accidental deaths | 295 |
| 2000 | Cardiovascular deaths | 0 |
| 2001 | Cardiovascular deaths | 14 |
| 2002 | Cardiovascular deaths | 29 |
| 2003 | Cardiovascular deaths | 33 |
| 2004 | Cardiovascular deaths | 35 |
| 2005 | Cardiovascular deaths | 43 |
| 2006 | Cardiovascular deaths | 47 |
| 2007 | Cardiovascular deaths | 52 |
| 2008 | Cardiovascular deaths | 52 |
| 2009 | Cardiovascular deaths | 54 |
| 2010 | Cardiovascular deaths | 64 |
| 2011 | Cardiovascular deaths | 65 |
| 2012 | Cardiovascular deaths | 69 |
| 2013 | Cardiovascular deaths | 72 |
| 2014 | Cardiovascular deaths | 74 |
| 2015 | Cardiovascular deaths | 75 |
| 2016 | Cardiovascular deaths | 89 |
| 2017 | Cardiovascular deaths | 93 |
| 2018 | Cardiovascular deaths | 114 |
| 2019 | Cardiovascular deaths | 117 |
| 2020 | Cardiovascular deaths | 130 |
| 2000 | Respiratory deaths | 0 |
| 2001 | Respiratory deaths | 4 |
| 2002 | Respiratory deaths | 10 |
| 2003 | Respiratory deaths | 12 |
| 2004 | Respiratory deaths | 12 |
| 2005 | Respiratory deaths | 15 |
| 2006 | Respiratory deaths | 17 |
| 2007 | Respiratory deaths | 19 |
| 2008 | Respiratory deaths | 19 |
| 2009 | Respiratory deaths | 20 |
| 2010 | Respiratory deaths | 25 |
| 2011 | Respiratory deaths | 26 |
| 2012 | Respiratory deaths | 27 |
| 2013 | Respiratory deaths | 29 |
| 2014 | Respiratory deaths | 30 |
| 2015 | Respiratory deaths | 31 |
| 2016 | Respiratory deaths | 37 |
| 2017 | Respiratory deaths | 39 |
| 2018 | Respiratory deaths | 50 |
| 2019 | Respiratory deaths | 51 |
| 2020 | Respiratory deaths | 56 |
| Toronto | ||
| 2000 | Non-accidental deaths | 0 |
| 2001 | Non-accidental deaths | 13 |
| 2002 | Non-accidental deaths | 36 |
| 2003 | Non-accidental deaths | 47 |
| 2004 | Non-accidental deaths | 50 |
| 2005 | Non-accidental deaths | 77 |
| 2006 | Non-accidental deaths | 90 |
| 2007 | Non-accidental deaths | 101 |
| 2008 | Non-accidental deaths | 107 |
| 2009 | Non-accidental deaths | 111 |
| 2010 | Non-accidental deaths | 129 |
| 2011 | Non-accidental deaths | 144 |
| 2012 | Non-accidental deaths | 159 |
| 2013 | Non-accidental deaths | 168 |
| 2014 | Non-accidental deaths | 168 |
| 2015 | Non-accidental deaths | 175 |
| 2016 | Non-accidental deaths | 198 |
| 2017 | Non-accidental deaths | 200 |
| 2018 | Non-accidental deaths | 219 |
| 2019 | Non-accidental deaths | 232 |
| 2020 | Non-accidental deaths | 249 |
| 2000 | Cardiovascular deaths | 0 |
| 2001 | Cardiovascular deaths | 2 |
| 2002 | Cardiovascular deaths | 5 |
| 2003 | Cardiovascular deaths | 6 |
| 2004 | Cardiovascular deaths | 7 |
| 2005 | Cardiovascular deaths | 10 |
| 2006 | Cardiovascular deaths | 11 |
| 2007 | Cardiovascular deaths | 13 |
| 2008 | Cardiovascular deaths | 13 |
| 2009 | Cardiovascular deaths | 14 |
| 2010 | Cardiovascular deaths | 15 |
| 2011 | Cardiovascular deaths | 16 |
| 2012 | Cardiovascular deaths | 18 |
| 2013 | Cardiovascular deaths | 18 |
| 2014 | Cardiovascular deaths | 18 |
| 2015 | Cardiovascular deaths | 19 |
| 2016 | Cardiovascular deaths | 20 |
| 2017 | Cardiovascular deaths | 21 |
| 2018 | Cardiovascular deaths | 22 |
| 2019 | Cardiovascular deaths | 23 |
| 2020 | Cardiovascular deaths | 25 |
| 2000 | Respiratory deaths | 0 |
| 2001 | Respiratory deaths | 4 |
| 2002 | Respiratory deaths | 10 |
| 2003 | Respiratory deaths | 13 |
| 2004 | Respiratory deaths | 14 |
| 2005 | Respiratory deaths | 23 |
| 2006 | Respiratory deaths | 28 |
| 2007 | Respiratory deaths | 31 |
| 2008 | Respiratory deaths | 33 |
| 2009 | Respiratory deaths | 34 |
| 2010 | Respiratory deaths | 40 |
| 2011 | Respiratory deaths | 45 |
| 2012 | Respiratory deaths | 51 |
| 2013 | Respiratory deaths | 53 |
| 2014 | Respiratory deaths | 53 |
| 2015 | Respiratory deaths | 55 |
| 2016 | Respiratory deaths | 61 |
| 2017 | Respiratory deaths | 62 |
| 2018 | Respiratory deaths | 67 |
| 2019 | Respiratory deaths | 71 |
| 2020 | Respiratory deaths | 75 |
|
Note: Non-accidental deaths do not include deaths caused by trauma or suicide. Source: Quick M, 2024 (forthcoming), "The impacts of extreme heat events on non-accidental, cardiovascular, and respiratory mortality: An analysis of 12 Canadian cities between 2000 and 2020," Health Reports, Statistics Canada Catalogue no. 36-28-0001. |
||
Dealing with climate change requires action, through either mitigation or adaptation measures
- Mitigation involves finding ways to reduce the human causes of climate change, such as reducing the emission of GHGs or removing them from the atmosphere.
- Adaptation involves finding ways to adapt to a changing climate by building resilience and reducing the adverse impacts of climate change today and in the future.
Mitigation: Carbon taxes increased manufacturers’ economic and climate change performances but had mixed results for air pollutants in British Columbia
- The carbon tax improved manufacturers’ efficiency, with real sales efficiency increasing by 11.9 percentage points.
- It also led to an 11.0 percentage point increase in efficiency for GHG emissions.
- The tax’s impact on air pollutants was mixed, enhancing carbon monoxide efficiency by 7.2 percentage points but reducing nitrogen oxide efficiency by 7.3 percentage points.
- Differences in average efficiency levels among outputs suggest producers prioritize economic over environmental efficiency to remain competitive.

Data table for Chart 3
| Efficiency | Average (2004 to 2007) | Average (2008 to 2012) | |
|---|---|---|---|
| efficiency percent | |||
| Real sales | |||
| 2004 | 82.70239 | 84.55865 | Note ...: not applicable |
| 2005 | 84.90246 | 84.55865 | Note ...: not applicable |
| 2006 | 85.44449 | 84.55865 | Note ...: not applicable |
| 2007 | 85.18526 | 84.55865 | Note ...: not applicable |
| 2008 | 93.33657 | 96.43151 | |
| 2009 | 96.77084 | Note ...: not applicable | 96.43151 |
| 2010 | 98.04051 | Note ...: not applicable | 96.43151 |
| 2011 | 96.89684 | Note ...: not applicable | 96.43151 |
| 2012 | 97.11279 | Note ...: not applicable | 96.43151 |
| Greenhouse gases | |||
| 2004 | 77.76785 | 79.18808 | Note ...: not applicable |
| 2005 | 79.39004 | 79.18808 | Note ...: not applicable |
| 2006 | 80.39382 | 79.18808 | Note ...: not applicable |
| 2007 | 79.20062 | 79.18808 | Note ...: not applicable |
| 2008 | 87.07661 | 90.14978 | |
| 2009 | 89.59044 | 90.14978 | |
| 2010 | 90.77773 | 90.14978 | |
| 2011 | 91.29239 | 90.14978 | |
| 2012 | 92.01171 | 90.14978 | |
| Carbon monoxide | |||
| 2004 | 15.77301 | 15.93609 | Note ...: not applicable |
| 2005 | 15.60800 | 15.93609 | Note ...: not applicable |
| 2006 | 15.97958 | 15.93609 | Note ...: not applicable |
| 2007 | 16.38375 | 15.93609 | Note ...: not applicable |
| 2008 | 20.96682 | Note ...: not applicable | 23.14577 |
| 2009 | 22.79108 | Note ...: not applicable | 23.14577 |
| 2010 | 24.25263 | Note ...: not applicable | 23.14577 |
| 2011 | 23.76440 | Note ...: not applicable | 23.14577 |
| 2012 | 23.95393 | Note ...: not applicable | 23.14577 |
| Nitrogen oxides | |||
| 2004 | 37.35130 | 37.57717 | Note ...: not applicable |
| 2005 | 36.43577 | 37.57717 | Note ...: not applicable |
| 2006 | 38.05888 | 37.57717 | Note ...: not applicable |
| 2007 | 38.46272 | 37.57717 | Note ...: not applicable |
| 2008 | 36.55006 | Note ...: not applicable | 30.23556 |
| 2009 | 31.74290 | Note ...: not applicable | 30.23556 |
| 2010 | 28.94096 | Note ...: not applicable | 30.23556 |
| 2011 | 28.33596 | Note ...: not applicable | 30.23556 |
| 2012 | 25.60792 | Note ...: not applicable | 30.23556 |
|
... not applicable Notes: Vertical lines indicate the year 2008. Full efficiency = 100%. Increases in desirable output (real sales) efficiency means producing more output, while increases in undesirable output (pollution) efficiency means producing less output, holding inputs and technology constant. Source: Maggi S, Benomar C, Quick M, Corvello M, Kingsbury M, Kohen D, 2023, "Climate emotions, pro-environmental behaviours, and activism among Canadian youth," Journal of Mental Health and Climate Change, 23.10.01–23.10.21, https://doi.org/10.5281/zenodo.10443325. |
|||
For more information: Do carbon taxes affect economic and environmental efficiency? The case of British Columbia’s manufacturing plants.
Mitigation: Telework has the potential to reduce transportation emissions by up to 9.5 megatons
- The increase in telework triggered by the COVID-19 pandemic will likely reduce GHG emissions by reducing commuting.
- If all Canadians who could work from home in 2015 did so exclusively, GHG annual emissions attributable to transportation could have fallen by 9.5 megatons of carbon dioxide equivalent emissions (i.e., 12.1% of households’ direct emissions attributable to transportation in 2015).
- If personal homes are less energy efficient than large office buildings, part of the reduction in GHG emissions triggered by reduced commuting could be offset by emissions associated with households’ increased energy use required for heating or providing air conditioning. The magnitude of this offsetting effect is currently unknown.

Data table for Chart 4
| Megatons of CO2 equivalent | |
|---|---|
| N.L. | 0.11 |
| P.E.I. | 0.03 |
| N.S. | 0.24 |
| N.B. | 0.20 |
| Que. | 2.15 |
| Ont. | 4.23 |
| Man. | 0.29 |
| Sask. | 0.24 |
| Alta. | 1.10 |
| B.C. | 0.92 |
| Source: Morissette R, Deng Z, Messacar D, 2021, "Working from home: Potential implications for public transit and greenhouse gas emissions," Economic and Social Reports, Statistics Canada Catalogue no. 36-28-0001" title="Catalogue: 36-28-0001">36-28-0001. | |
Adaptation: Not all workers displaced from fossil fuel industries experience similar earnings trajectories after job loss
- Transitioning to a low-carbon economy will require phasing out coal and other fossil fuels, as well as related jobs in these industries.
- Five years after job loss, one in four workers displaced from coal mining from 2004 to 2011 saw their annual wages fall by at least $19,000.
- However, one in four workers saw their annual wages increase by at least $31,000 during the same period.
- Therefore, not all workers displaced from fossil fuel industries experience similar earnings trajectories after job loss.

Data table for Chart 5
| Number of years before and after layoff | Bottom quintile | Middle quintile | Top quintile |
|---|---|---|---|
| 2016 dollars | |||
| -3 | 19,026 | 55,021 | 120,176 |
| -2 | 17,831 | 57,505 | 125,963 |
| -1 | 21,621 | 60,538 | 126,960 |
| 0 | 27,113 | 49,429 | 95,674 |
| 1 | 27,856 | 53,579 | 93,265 |
| 2 | 35,952 | 65,777 | 108,301 |
| 3 | 39,301 | 70,069 | 113,215 |
| 4 | 39,683 | 70,322 | 112,223 |
| 5 | 38,208 | 66,034 | 107,279 |
| Source: Statistics Canada, Longitudinal Worker File. | |||
Adaptation: More than 50% of the population in Montréal, Toronto and Vancouver had a cooling centre within a 15-minute walk
- Cooling centres such as libraries and community or recreation centres provide safety and social support during extreme heat events.
- More than 50% of Montréal, Toronto and Vancouver residents had access to at least one cooling centre within a 15-minute walking trip of their homes.
- Residents living in neighbourhoods characterized by high deprivation were more likely to have at least one cooling centre within a 15-minute walk than areas with low deprivation.

Description for Map 2
Map 2 shows the location of cooling centres in the Vancouver, British Columbia Census Subdivision. The census subdivision is shown as a black outline. There are no labels indicating countries, regions or other geographical features on the map.
The map shows the location of all dissemination area centroids as grey points. There are many grey points regularly spaced throughout Vancouver. Cooling centres located at libraries are shown as green points. Cooling centres located at community or recreation centres are shown as red points. Cooling centres located at pools or water features are shown as blue points. The green, red, and blue points are scattered throughout Vancouver and show no clear spatial pattern.
Below the map is the scale for the map. The scale is a horizontal thick black bar. The scale extends from 0 to 10 kilometres. The horizontal length of the map scale is about two-thirds of the width of the map.
Below the map scale is the map legend. The legend has two columns. Each column has two colored points. Each point has the name of the feature it is used to represent. The first entry on the left-hand column is a grey point and the label "Dissemination area centroid." The second entry on the left-hand column is a red point and the label "Community / recreation centre." The first entry on the right-hand column is a green point with the label "Library." The second entry on the right-hand column is a blue point with the label "Pool / water feature."
Source: Statistics Canada, City of Vancouver Open Data
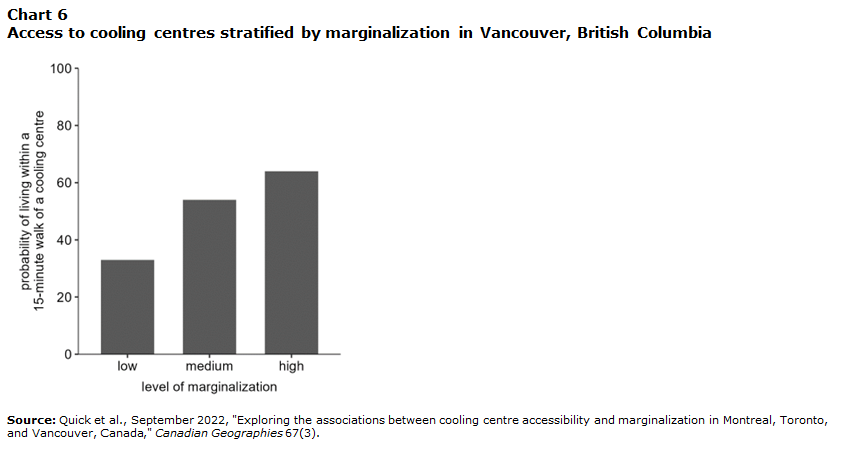
Data table for Chart 6
| City | Level of marginalization | Probability of living within a 15-minute walk of a cooling centre |
|---|---|---|
| Vancouver | High | 64 |
| Vancouver | Medium | 54 |
| Vancouver | Low | 33 |
| Source: Quick et al., September 2022, "Exploring the associations between cooling centre accessibility and marginalization in Montreal, Toronto, and Vancouver, Canada," Canadian Geographies 67(3). | ||
Adaptation: About two in three Canadians had household air conditioning
- Air conditioning is one of the most effective ways to reduce health impacts during extreme heat events.
- Access to air conditioning varied by region, ranging from 32% in British Columbia to 85% in Ontario.
- Individuals who lived alone, did not own their home and had low-income status were less likely to have air conditioning in their homes.

Data table for Chart 7
| Percent | |
|---|---|
| Canada | |
| Overall | 61.1 |
| Does not own home | 49.8 |
| Lives alone | 52.5 |
| Low-income status | 54.5 |
| Atlantic | |
| Overall | 37.5 |
| Does not own home | 33.3 |
| Lives alone | 27.8 |
| Low-income status | 28.1 |
| Quebec | |
| Overall | 57.8 |
| Does not own home | 48.6 |
| Lives alone | 49.8 |
| Low-income status | 48.0 |
| Ontario | |
| Overall | 85.3 |
| Does not own home | 71.4 |
| Lives alone | 74.3 |
| Low-income status | 77.3 |
| Prairies | |
| Overall | 48.9 |
| Does not own home | 35.5 |
| Lives alone | 46.7 |
| Low-income status | 37.5 |
| British Columbia | |
| Overall | 31.9 |
| Does not own home | 24.2 |
| Lives alone | 27.2 |
| Low-income status | 24.8 |
| Source: Quick M, Tjepkema M, 2023, "The prevalence of household air conditioning in Canada," Health Reports, Statistics Canada Catalogue no. 36-28-0001" title="Catalogue: 36-28-0001">36-28-0001. | |
Adaptation: Positive emotions and concern are determinants of climate action for youth
- Young people’s emotions in response to climate change may be important in determining their behaviour, separating activists from non-activists.
- More than 9 in 10 youth reported feeling somewhat, very or extremely concerned about climate change.
- During the last six months, about 7 in 10 youth described themselves as engaging in pro-environmental behaviours at least half of the time.
- Both concern and pleasant emotions about climate change (hope, optimism and solidarity) were found to significantly increase the frequency of climate actions.

Data table for Chart 8
| Are you concerned about climate change? | Do you engage in pro-environmental behaviours? | Percent of respondents |
|---|---|---|
| Not at all | Never | 0.7 |
| Sometimes | 1.5 | |
| About half the time | 1.1 | |
| Most of the time | 0.1 | |
| Somewhat | Never | 1.2 |
| Sometimes | 16.0 | |
| About half the time | 19.3 | |
| Most of the time | 6.7 | |
| Always | 1.5 | |
| Very | Never | 0.3 |
| Sometimes | 5.7 | |
| About half the time | 14.1 | |
| Most of the time | 11.7 | |
| Always | 3.9 | |
| Extremely | Never | 0.3 |
| Sometimes | 1.3 | |
| About half the time | 5.0 | |
| Most of the time | 6.5 | |
| Always | 2.9 | |
| Source: Maggi S, Benomar C, Quick M, Corvello M, Kingsbury M, Kohen D, 2023, "Climate emotions, pro-environmental behaviours, and activism among Canadian youth," Journal of Mental Health and Climate Change, 23.10.01–23.10.21, https://doi.org/10.5281/zenodo.10443325. | ||
Summary of key findings
- Climate change has had important economic, health and well-being impacts. For example, flooding had impacts on the economy in British Columbia, extreme heat was associated with increased risk of death, especially for the senior population, and exposure to wildfires increased the risks of cancer.
- The carbon tax in British Columbia improved manufacturers’ efficiency and environmental efficiency for GHG and carbon monoxide emissions.
- Work from home can potentially reduce GHG emissions caused by transportation by a non-negligible amount.
- Not all workers displaced from coal mining and oil and gas industries experienced wage drops in the long term.
- Access to cooling centres and household air conditioning differed by region and population group.
For more information, please contact
analyticalstudies-etudesanalytiques@statcan.gc.ca
- Date modified: