
Insights on Canadian Society
Food insecurity among Canadian families

Acknowledgements
This study was funded by the Maple Leaf Centre for Food Security - a registered charity created to reduce food insecurity in Canada.
Start of text boxOverview of the study
This study uses data from the 2021 Canadian Income Survey to gain a better understanding of food insecurity, with a focus on families both below and above the poverty line and across income quintiles. The study also uses data from the 2019 Survey of Financial Security to examine the net worth of families who are more likely to be food insecure.
- In 2022, 18% of Canadian families reported experiencing food insecurity in the past 12 months, up from 16% in 2021.
- Food insecurity was the lowest in Quebec (14%) and highest in Newfoundland and Labrador (23%), New Brunswick (22%) and Alberta (22%).
- Families with a female major income earner were more likely to be food insecure compared to those with a male major income earner – 21% versus 16%. Moreover, food insecurity was highest among female lone parent families (41%).
- Families with a racialized major income earner (23%) reported higher food insecurity compared to families with a non-racialized, non-indigenous earner (16%). This was especially true for Black Canadians (38%).
- Families with an Indigenous major income earner living in the provinces and off reserve were almost twice as likely to report food insecurity (34%), compared to those with a non-Indigenous major income earner (18%).
- More than one-third (35%) of families living below the poverty line reported food insecurity, double the proportion for families living above the poverty line (16%). Though the rate of food insecurity among families below the poverty line was higher, a higher proportion of families (78%) who were food insecure were above the poverty line.
- The risk of being food insecure was much higher among certain groups living below the poverty line. For instance, 62% of families living in subsidized housing were food insecure, over three times higher than the overall average (18%). Other vulnerable groups below the poverty line included female lone parent families (48%), families where the major income earner was unemployed all year (60%), Indigenous families living in the provinces and off reserve (48%), and Black Canadians (56%). Similar groups were at greater risk who were living above the poverty line.
- Part of the observed difference in food insecurity rates between families with a male and female major income earner; female lone parent families and other family types; and families with a Black or Filipino Canadian and non-racialized, non-Indigenous major income earner was explained by various other sociodemographic characteristics including family income.
Introduction
Food security refers to “when all people, at all times, have physical and economic access to sufficient safe and nutritious food that meets their dietary needs and food preferences for an active and healthy life”.Note There are four dimensions of food security: physical availability of food, economic and physical access to food, food utilization, and stability of the other three dimensions over time. All four dimensions must be fulfilled simultaneously for food security objectives to be met.
Food insecurity, on the other hand, is “the inability to acquire or consume an adequate diet quality or sufficient quantity of food in socially acceptable ways, or the uncertainty that one will be able to so”.Note It usually results from an inability to access adequate food due to financial constraints. Food insecurity is a serious concern as it has been found to be associated with various chronic conditions,Note mental health problemsNote and other diseases and infections.Note It has also been found to increase the likelihood of hospitalizationNote and has been linked to premature mortality,Note and as such, puts pressure on the health care system. Recent Canadian studies on food insecurity have looked at its association with various sociodemographic and economic characteristics,Note the association with mental health,Note unmet health care needsNote and changes in prevalence during the COVID-19 pandemic.Note
Now known as a key indicator in the goal of reducing poverty, monitoring the prevalence of food security was first identified in the 2018 Opportunity for All – Canada’s First Poverty Reduction Strategy. It has since been reinforced with the 2021 Government of Canada Quality of Life Framework that identifies food security as a well-being indicator, falling under the ‘prosperity’ domain. Addressing the need for data on this indicator, Statistics Canada launched the Household Food Security Survey Module (HFSSM) in the 2018 Canadian Income Survey, with a view to measure and track trends in food insecurity over time.Note The module covers a full spectrum of food insecurity, from worrying about running out of food, to children not eating for a whole day (see Data sources and definitions).
In this study, data from the 2021 Canadian Income Survey are used to examine how food insecurity (marginally, moderately and severely food insecure) varies among Canadian families (economic families and unattached individuals) living in the ten provinces.Note Included are families living below and above the poverty line, as it is recognized that income alone is not the sole driver in food insecurity.Note Other financial constraints, namely high levels of debt and/or low levels of assets (in other words, low levels of net worth), are examined based on data from the 2019 Survey of Financial Security.Note While the SFS does not include information on food insecurity, these data can be used to provide a profile of the financial situation of groups most likely to be food insecure (based on CIS findings).
The article is divided into three sections. The first section examines overall patterns in food insecurity. This is followed by a look into the relationship between income and food insecurity, exploring families most vulnerable to experiencing food insecurity below and above the poverty line. The last section takes a look at the possible role of assets and debts in food insecurity. Given the use of cross-sectional data, the results in this article should be interpreted as associations and not causal relationships.
Section 1 Food insecurity: Who is most at risk?
In 2022, 18% of families in Canada, representing 6.9 million people, reported that they experienced some level of food insecurity over the past 12 months (Table 1). More specifically, 5% of families were marginally food insecure, meaning that families worried about running out of food and/or experienced limited food selection due to a lack of money for food. Another 8% were considered moderately food insecure, where the quality and/or quantity of food was compromised due to a lack of money for food. A further 5% were severely food insecure, missing meals, reducing their food intake and, at the most extreme, going days without food.
The proportion of families experiencing some level of food insecurity has increased since 2021, increasing from 16% to 18% between 2021 and 2022. This proportion is also slightly higher than before the pandemic - in 2019 (17%).Note The relatively higher prevalence of food insecurity could be partly attributed to higher levels of inflation, which reduces the purchasing power of consumers, causing families to spend more to buy less.
The year-over-year inflation rate jumped from 1.0% in January 2021 to 4.8% in December 2021. Meanwhile, the annual rate of food inflation increased from 1.0% to 5.2% over the same time period. Prices continued to rise and in June 2022, the overall inflation rate was 8.1% and food inflation in particular was 8.8% - the largest yearly change in 40 years.
While inflation affects all areas of the country, other factors, such as cost of living and policies aimed at poverty reduction, can influence the prevalence of food security at the provincial level. In 2022, food insecurity was the lowest in Quebec, with 14% of families in this province reporting some level of food insecurity. Quebec was also the only province to not experience any change in levels of food insecurity from 2019 to 2022.
On the other end of the spectrum, food insecurity was the highest in Newfoundland and Labrador (23%), followed by New Brunswick (22%) and Alberta (22%). These were also the provinces, along with Prince Edward Island, to experience the greatest increase in food insecurity between 2019 and 2022, ranging from an increase of 3-4 percentage points.
Among larger Census Metropolitan Areas (CMAs), in 2022, food insecurity was the highest in Edmonton (21%) and the lowest in Ottawa-Gatineau (14%). Moreover, families residing in rural areas (15%) reported lower level of food insecurity compared to those living in population centres (19%).
Senior-led households have lower rates of food insecurity
The age of the major income earner played a role in the likelihood of food insecurity, with senior-led households being less likely to report food insecurity. In 2022, 10% of families with the major income earner aged 65 years and older reported food insecurity. This compares to 17% for 55- to 64-year-olds and 23% for 35- to 44 year-olds. Older age groups are likely to have a more stable source of income such as government pensions and are more likely to have accumulated assets over their lifetime. On the other hand, families with middle-aged income earners can have more financial obligations, such as mortgage debt and young children.
Food insecurity higher among families with a female major income earner
Overall, families with a female major income earner were more likely to report food insecurity, compared to those with a male major earner – 21% versus 16%.Note This may reflect gender differences in income levels. In 2021, the median annual after-tax income of families with a female major earner was $58,200, compared to $76,600 for those with a male major income earner.Note
Family structure is also related to food insecurity. Certain family types are more likely to be food insecure. This is especially true for female lone parent families. More than four in ten (41%) of these families reported being food insecure. While food insecurity was also higher than average among male lone parents, the proportion was much lower at 24%. Other families with higher-than-average food insecurity included non-elderly not in economic families (24%) and non-elderly couples with children (20%). The lowest level of food insecurity were among elderly families (8%).
Closely tied to family structure is marital status, as it can further speak to the possibility of pooled assets and financial resources, which in turn, can impact the ability to be food secure. Those who were separated (28%), divorced (22%), and unattached (23%) were more likely to report food insecurity, compared to both legally married couples (14%) and those in common-law relationships (15%). The adverse economic consequences of separation and divorce are well known.Note Widowed (12%) were less likely to be food insecure, a result largely driven by an age effect.
Food insecurity was three times higher among those who are chronically unemployed
The likelihood of being food insecure is related to both education and labour force status, as these intertwined factors are closely linked to earning potential. Holding a university degree was a protective factor to food insecurity, with 13% of families in which the major income earner had a university degree being food insecure, lower than the proportion (22%) of those with less than a high school diploma. The relationship between higher levels of education and higher earnings is well documented.Note Also, higher levels of education are associated with higher financial literacy, which in turn is associated with better financial planning.Note Higher earnings and sound financial plans are likely to be mitigating factors against food insecurity.
Looking at the labour force status, stable employment - being employed all year - was associated with a lower likelihood of food insecurity (15%). Meanwhile, those who were chronically unemployed - unemployed all year – had a food insecurity rate three times higher than their employed counterparts (45%).
That said, even among employed persons, there were differences in food insecurity based on the class of worker. Self-employed (13%) were less likely to report food insecurity, compared to paid employees (18%). While much diversity exists within the self-employed population, existing research shows that the self-employed tend to be wealthier and have higher levels of financial literacy compared to paid employees.Note
While paid employees and self-employed tend to draw their main source of income from wages/salaries and self-employment income respectively, senior-led families often rely on investment income and pensions. In 2022, families reporting their main source of income as investment income or private retirement pensions were the least likely to be food insecure (5% each).
The families most vulnerable to food insecurity were those relying on government transfers as their major income source. In 2022, 29% of those whose major source of income was government transfers, such as Employment Insurance (EI) benefits, social assistance benefits, workers’ compensation benefits, and the Canadian Pension Plan (CPP) benefits, were food insecure (see Textbox 1).
Start of text boxTextbox 1 Food insecurity among those with government transfers as the major source of income
Families that have government transfers as the major source of income are more likely to be food insecure compared to those with other major sources of income. Government transfers consist of all cash benefits received from the federal, provincial, territorial, or municipal governments during the reference period.Note
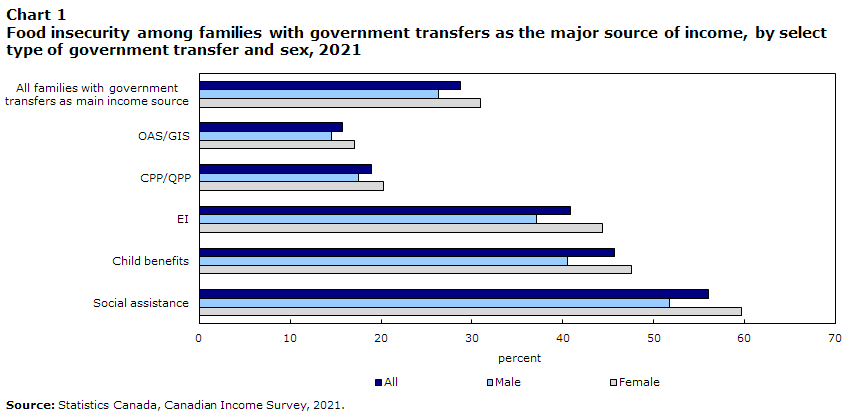
Looking at some select government transfers, among those with government transfers as the major source of income in 2021, 65% received money from Canada/Quebec Pension Plan (CPP/QPP), 59% from Old Age Security pension/Guaranteed Income Supplement (OAS/GIS), 19% from Employment Insurance Benefits, 15% from Child Benefits, and 19% from Social Assistance Benefits. Some of these were associated with higher rates of food insecurity. For example, families whose major source of income was government transfers, and who received income from social assistance benefits were more likely to report food insecurity, with more than one half (56%) being in that situation (Chart 1).
Data table for Chart 1
| Source of income | All | Male | Female |
|---|---|---|---|
| percentage | |||
| All families with government transfers as main income source | 28.8 | 26.3 | 31.0 |
| OAS/GIS | 15.8 | 14.5 | 17.1 |
| CPP/QPP | 18.9 | 17.5 | 20.3 |
| EI | 40.9 | 37.1 | 44.4 |
| Child benefits | 45.7 | 40.5 | 47.6 |
| Social assistance | 56.1 | 51.7 | 59.7 |
| Source: Statistics Canada, Canadian Income Survey, 2021. | |||
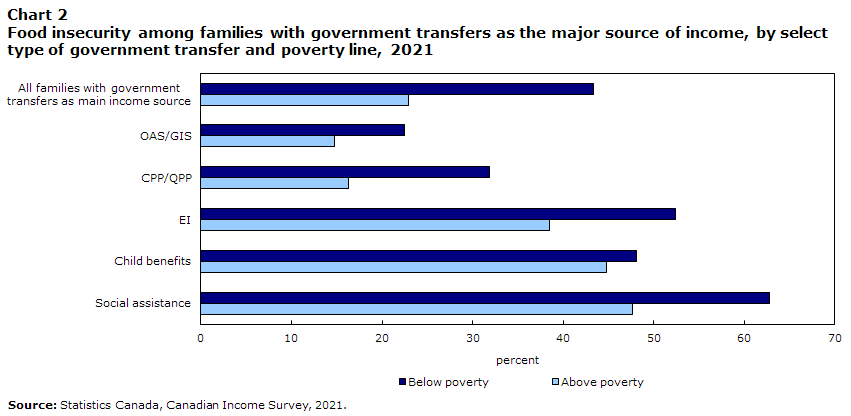
Still referring to those with government transfers as their main source of income in 2021, higher rates of food insecurity were also prevalent among those who received child benefits (46%) and employment insurance benefits (41%). On the other hand, receiving money from CPP/QPP (19%) and OAS/GIS (16%) was associated with a lower likelihood. These conclusions were similar regardless of whether a family had a male or a female major income earner or whether they were below or above the poverty line (Chart 2).
Data table for Chart 2
| Source of income | Below poverty | Above poverty |
|---|---|---|
| percentage | ||
| All families with government transfers as main income source | 43.3 | 22.9 |
| OAS/GIS | 22.5 | 14.8 |
| CPP/QPP | 31.9 | 16.3 |
| EI | 52.4 | 38.5 |
| Child benefits | 48.1 | 44.8 |
| Social assistance | 62.8 | 47.7 |
| Source: Statistics Canada, Canadian Income Survey, 2021. | ||
Owning a home provides some protection against food insecurity
Home ownership, which can be a proxy for wealth, is associated will lower levels of food insecurity. Less than one in ten (9%) of families that owned their homes mortgage-free reported food insecurity. The comparable proportion for homeowners with an outstanding mortgage was 16%.
Renters, on the other hand, were more likely to be food insecure. This was especially true for families living in subsidized housing. Around one in four (26%) of renters in non-subsidized housing and more than four in ten (42%) of those living in subsidized housing reported food insecurity.
Food insecurity was higher among Indigenous families, racialized communities and immigrant families
On average, food insecurity among Indigenous families tended to be higher. Indigenous families living in the provinces and off reserve were almost twice as likely as the non-Indigenous population to be food insecure (34% versus 18%).Note Note The rate was higher for First Nations families living off-reserve (38%) than for Métis (31%). The sample size was not large enough to report an estimate for Inuit. However, food insecurity among the Inuit population has been a subject of an earlier study.Note Given that families living in the three territories, on reserves and other Indigenous settlements in the provinces are excluded, these results do not reflect food insecurity among the overall Indigenous population.
Food insecurity was also higher among racialized families. Overall, 23% of families with a racialized major income earner reported food insecurity, compared to 16% of their non-racialized, non-Indigenous counterparts. However, the overall food insecurity rate for the racialized population masks important differences among different racial groups.
Among racialized groups, Black Canadians had the highest rate of food insecurity, with almost four in ten (38%) reporting being food insecure. This was followed by Filipino Canadians (28%), South-East Asian (23%), Arab (22%), and South Asian Canadians (19%). There was no statistically significant difference between Chinese Canadians, Latin American Canadians and the non-racialized, non-Indigenous population.
Immigrant families were more likely to report food insecurity compared to the Canadian-born. One in four (26%) of families in which the major income earner immigrated between 2013 and 2022 (recent immigrants) reported being food insecure. This proportion was 20% for established immigrants (immigrated before 2013) and 17% for Canadian-born.
Section 2 Exploring the relationship between income and food security
Food insecurity can be expected to be more prevalent in families with lower income levels, though the relationship between income and food insecurity is complex. It cannot be assumed that all people living below the poverty line are struggling with food insecurity, while at the same time, it would be incorrect to assume that those above are immune to these same difficulties. To explore this relationship between income and food insecurity, the following section examines food insecurity among families below and above the poverty line, highlighting those that are most vulnerable, as well as those that may be at lower risk.
Based on the market basket measure (MBM), 11% of families lived below the poverty line. According to the MBM a family lives in poverty if it does not have enough income to purchase a specific basket of goods and services in its community.Note Overall families below the poverty line were more than twice as likely than those above the line to report food insecurity (35% versus 16%).Note Though the rate of food insecurity among families below the poverty line was higher, a higher proportion of families (78%) who were food insecure were above the poverty line.
Among those living below the poverty line, young adults were the least vulnerable to food insecurity
Contrasting the overall age-related pattern in food insecurity, young people living below the poverty line were less likely than middle-aged adults below the poverty line to be food insecure. Around 23% of families with the major income earner aged 16 to 24 reported food insecurity, compared to 46% of those aged 35 to 44 years. The 16- to 24-year-old families, representing around 4% of all families, were mostly unattached individuals (almost 9 in 10). Lower food insecurity among this group could be a result of lower financial obligations. Also, half of them were full-time students and though living on their own, some may be receiving financial support from parents.
Indeed, being a student, either full or part-time, was related to lower levels of food insecurity among those living below the poverty line, with the rates being similar between those below and above the poverty line. For instance, 26% of full-time students below the poverty line were food insecure, compared to 24% above the poverty line.
Full-time students (and young people) above the poverty line were actually more vulnerable to food insecurity than non-students/older adults above the poverty line. This could partly be a result of differing characteristics. For example, as compared to those below the poverty line, full-time students above the poverty line were more likely to be married with children (15% versus 3%Note ) and more likely to be female lone parents (7% versus 3%), characteristics that are associated with a higher likelihood of food insecurity.
Food insecurity lowest among seniors
Across the board in terms of income levels, seniors were better off than younger adults. Seniors living below the poverty line had a rate of food insecurity of 21%, lower than the average rate for those below the poverty line (35%) but still slightly higher than the overall average (18%). Their rate of food insecurity was also double the rate of seniors living above the poverty line (21% versus 9%).
Reflecting seniors’ overall lower rate of food insecurity relative to younger adults, senior-led families, as well as seniors not in economic families fared better. For instance, among those living below the poverty line, senior-led families and unattached seniors’ rates of food insecurity (26% and 20%) were half that of female lone parent families (48%).
In fact, female lone parents were one of the most vulnerable groups across those living below and above the poverty line, with only 8 percentage points separating female lone parents below (48%) and above the poverty line (40%). This contrasts the situation for non-elderly couples with and without children, where the disparity between those below and above the poverty line was much more substantive.
Above the poverty line, female lone parents were the most likely to be food insecure, almost four times as likely as non-elderly couples without children (40% versus 11%). As a comparison, male lone-parents and non-elderly couples with children were only twice as likely (20%). Senior-led families were the least likely (8%), mirroring patterns for those below the poverty line.
Explaining the consistently higher rate of food insecurity among female lone-parents is critical. Findings suggest the importance of examining the intersectionality of lone-parent family structure and other characteristics. Almost two-thirds (65%) of families in which the lone mother had less than a high school diploma reported food insecurity (Table 2). The proportion was less than half of that among those with a university degree (31%).
Female lone-parents who were not employed all year were more at risk, especially the unemployed (71%). More than one-half (55%) of lone mother families with government transfers as the major source of income were food insecure. Moreover, 50% of those living in rental non-subsidized reported food insecurity compared to 18% of homeowners without mortgage. The rate was even higher among those living in rental subsidized housing (66%).
Six in ten (60%) families with Indigenous lone mothers reported food insecurity compared to 41% of non-Indigenous. The rate of food insecurity was particularly high among Black lone mother families (62%) compared to non-racialized, non-Indigenous (40%). Lone mother families belonging to all other racialized groups had a lower rate (28%).Note
Being employed year round reduces the risk of food insecurity among those living below and above the poverty line
Labour force status of those below and above the poverty line seemed to matter notably. Being employed year-round reduced the risk of food insecurity – even for those in working poverty. In 2022, 28% of year-round employed living below the poverty line experienced food insecurity. While higher than the proportion above the poverty line (14%), it was much lower than those living below the poverty line who were unemployed all year (60%) or unemployed part of the year (51%).
Home ownership was associated with a lower likelihood of food insecurity, regardless of whether families were below or above the poverty line. For example, 22% of families below the poverty line who owned their homes mortgage-free reported being food insecure compared to 37% of renters of non-subsidized housing and 62% of families living in subsidized rental housing.
Almost six in ten of families below the poverty line with a Black Canadian as the major income earner were food insecure
Overall, there was no difference between the racialized and the non-racialized, non-Indigenous families below the poverty line in terms of the prevalence of food insecurity. However, this overall trend masks underlying differences. Looking at racialized groups separately, Chinese (24%) and South Asian Canadians (25%) were less likely to be food insecure than the non-racialized, non-Indigenous population (36%). On the other hand, Black Canadians (56%) were notably more likely to report food insecurity.
Even above the poverty line Indigenous and racialized families were more likely to be food insecure
Indigenous families above the poverty line living off reserve (31%) were twice as likely to be food insecure compared to the non-Indigenous families (15%). The rate was somewhat higher among the off-reserve First Nations families (34%) than Métis families (28%).
Racialized families above the poverty line (21%) had a higher likelihood of reporting food insecurity compared to their non-racialized, non-Indigenous counterparts (14%). When looking at the racialized groups separately this was only true for Black (33%), Filipino (28%), Arab (21%), and South Asian (19%) Canadians. Interestingly, as noted earlier, South Asian Canadians below the poverty line were less likely to be food insecure compared to their non-racialized, non-Indigenous counterparts. Additionally, immigrant families above the poverty line were more likely to report food insecurity.
Patterns in vulnerability also seen across income quintiles
Another way to look at the relationship between income and food insecurity is to compare families across income quintiles. As expected, there is a strong association between income and food insecurity. Families in the bottom quintile of adjusted family incomeNote were more than four times as likely to be food insecure as those in the top quintile - 30% versus 7% (Table 3). The comparable proportions for those in the second, third and fourth quintiles were 23%, 17%, and 12%, respectively.
Certain family characteristics were associated with a higher or lower likelihood of food insecurity and some of these are common across income quintiles. Not surprisingly, the patterns correspond to those identified for below and above the poverty line.
Across the income quintiles, rates of food insecurity were lowest among seniors, self-employed, those employed year-round, homeowners (especially those without a mortgage), and highest among female lone parent families, Indigenous families, and racialized families.
Groups most vulnerable to food insecurity remain even after accounting for the interplay of multiple socio-economic factors
The preceding discussion explored descriptive associations. Because various family characteristics are expected to be correlated with each other, logistic regressions were estimated to calculate predicted probabilities of food insecurity. Not all characteristics could be included in the same model given that some of them were perfectly collinear. For example, the “65 years of age and above” category of age group and the “senior-led families/seniors not in economic families” categories of economic family type were perfectly collinear. Results from a model with sex, level of education, family type, class of worker, racialized population group, major source of income, home ownership, income quintile, CMA and province are presented in Table A1.
Most of the conclusions from the descriptive statistics remained similar though the magnitude of the differences changed. For example, after controlling for various characteristics, families with a female major income earner were still more likely to be food insecure compared to their male counterparts. However, the difference was smaller – a predicted probability of 0.19 for female headed families versus 0.17 for the male ones. Similarly, part of the difference between female lone parent families and other family types was accounted for by family characteristics but they were still more likely to be food insecure. Families with a Black or Filipino Canadian as the major income earner were still more likely to be food insecure compared to the non-racialized, non-Indigenous but the gap was reduced.
Controlling for various characteristics changed some of the results based on descriptive statistics. For example, now there was no statistically significant difference between non-racialized, non-Indigenous families and South Asian, Southeast Asian and Arab families.
Looking at families below the poverty line, after controlling for various characteristics, female lone parent families were no longer the most likely to be food insecure.
Among those above the poverty line, male lone parent families were not more likely to be food insecure. Also, the differences between the non-racialized, non-Indigenous families and South Asian and Arab families were accounted for by the covariates.
Start of text boxTextbox 2 Families with a disability and food insecurity
Families who had a person with a disability as the major income earner more likely to report food insecurity
Families who had a person with a disability as the major income earner were more likely to report food insecurity – 30% versus 18% for all Canadian families (Table 4). This proportion was higher when the disability was more severe or when the person had a higher number of disabilities.
Almost one-fourth (23%) of families with the major earner having a mild disability reported being food insecure. This proportion was 32% for moderate disability, 38% for severe disability, and 39% for very severe disability.
Also, the number of disabilities increased the likelihood of food insecurity. One in four (23%) with one disability reported food insecurity, increasing to 28% among those with two disabilities and to 42% with four or more disabilities.
Six in ten of female lone parents with a disability were food insecure
Looking at age groups, young people were more likely to be food insecure. Almost one-half (49%) of families with a 16- to 24-year-old major earner reported food insecurity. On the other hand, families with the major income earner aged 65 years and older were less likely to be food insecure. This may be explained by the higher likelihood of age-related disabilities among those aged 65 and older, rather than experiencing disability earlier in their lives. As a result, seniors with a disability may have been employed during their working years, which in turn, allowed them to build a strong financial base.
Similar to the overall pattern, families who had a female with a disability as the major income earner were more likely to report food insecurity compared to their male counterparts – 32% versus 27%. In addition, more than six in ten (62%) of female lone parents with a disability reported food insecurity. The rate was 45% among male lone parents. The comparable proportions for non-senior couples with and without children were 30% and 23%, respectively.
Employment served as a protective factor against food insecurity among those with a disability
Families with a major earner who was employed all year were notably less likely to be food insecure. For example, their rate of food insecurity (24%) was almost one-third that of those who were unemployed all year.
More than one-half (54%) of families living in subsidized rental housing were food insecure. This proportion was 41% for those living in non-subsidized rental housing and much lower among homeowners with (26%) and without (14%) a mortgage.
Income levels have an important role to play in food insecurity. Families with a major income earner who had a disability were more likely to be below the poverty line – 16% versus 11% for all Canadian families. Moreover, they were more likely to be in the bottom of the income distribution with 29% in the bottom income quintile and only 14% in the top quintile. Families below the poverty line were more than twice as likely to be food insecure as those above the line – 52% versus 25%. Also, those in the bottom income quintile (44%) were four times as likely to report food insecurity as those in the top quintile (11%).
Racialized persons with a disability were more often food insecure
Families with a racialized major earner (36%) who had a disability were more likely to report food insecurity compared to those with a non-racialized, non-Indigenous (27%) major income earner. Looking at specific racialized groups, Black Canadians were the most at risk with more than one-half (55%) reporting food insecurity.
Families with an off-reserve Indigenous major earner had a higher rate of food insecurity compared to non-Indigenous (52% versus 29%). The rate was even higher among First Nations people living off reserve (55%).
Section 3 The role of net worth in food insecurity
Existing research suggests that food insecurity results from an “interplay of household resources (including assets) and household expenditures, as well as household debt.”Note The Canadian Income Survey (CIS) contains information on home ownership, with or without mortgage, which serves as a proxy for debt/assets. This measure was used in the preceding discussion.
However, home ownership alone cannot provide a complete picture of a family’s financial situation. The Survey of Financial Security (SFS) has detailed information on debt, assets and net worth. While the SFS does not include information on food insecurity, these data can be used to provide a profile of the financial situation of groups most likely to be food insecure (based on CIS findings).Note
Four indicators of financial well-being are used: (i) proportion of families with consumer debt; (ii) median level of consumer debt among families with consumer debt; (iii) median level of net worth (the overall value of assets held by the family, minus the overall debt held by that family); (iv) proportion of families with zero or negative net worth. High levels of consumer debt are considered to lead to lower financial well-being, since unlike mortgage debt, it is not necessarily backed by an asset. Even more important indicators of a precarious financial situation, however, would be a low level of net worth and/or having zero or negative net worth.
Home equity and net worth inherently intertwined, meaning homeowners have higher net worth
Homeownership, which is associated with a lower rate of food insecurity, is related to a higher level of net worth. Homeowners without a mortgage tend to have greater home equity available, meaning that they can possibly draw on this equity, if required. Overall, these homeowners had an average net worth of $965,000 (Table 5). In comparison, homeowners carrying a mortgage, while perhaps having less home equity, still had a substantive net worth of $497,500. Indeed, this translated into a net worth about 20 times higher than the net worth of renters ($24,700). Also, almost no homeowners had a zero or negative net worth, whereas 14% of renters had a zero or negative net worth.
Nonetheless, it is important to contextualize the power of home equity as a driver of wealth, which in the current market, may be less attainable among younger homeowners and first-time home buyers. Recent increases in housing prices, along with higher interest rates impacting both mortgage payments (whether at renewal of a fixed rate or with variable rate) and home equity lines of credit (HELOC) means that some homeowners have less disposable income than before, and face higher disincentives to accessing home equity through a HELOC.
As seen with the 2021 Census, homeownership is connected to age. Three-quarter of seniors (75%) owned their home, compared to 36% of 25-to-29-year-olds and 52% of those aged 30 to 34 years. Reflecting this pattern in homeownership (and possibly the presence of a mortgage), the median net worth of families with the major income earner aged 65 and above was $543,200, double the amount among 35- to 44-year-olds ($234,400). Older age groups also had lower proportions with a zero or negative net worth.
Substantive disparity in net worth among pensioners and families with government transfers
Private retirement pensioners had among the highest net worth of all groups. With an average net worth of $1,089,800, their net worth was 1.6 times higher than self-employed ($672,400), nearly 3.8 times higher than paid employees ($288,900), and 10 times higher than those receiving government transfers as the major source of income ($109,700). This pattern in declining net worth mirrors the pattern of increasing food insecurity.
Those relying on investment income, such as interest, dividends, and capital gains, had the highest overall net worth of $1,297,700. And, along with private retirement pensioners (0.1%), they were less likely to have zero or negative net worth (2%). In comparison, 8% of those with major source of income as government transfer had a zero or negative net worth.
Lower net worth is more common among female lone parents and unattached individuals
Families with female as the major income earner are more likely to be food insecure. The median net worth of families with a female major earner was $278,000, 28% lower than the net worth of families with a male major earner ($384,900). Also, 7% of the female major income earners had zero or negative net worth, compared to 5% of their male counterparts. A lower level of net worth and a higher likelihood of having zero or negative net worth represent a more financially vulnerable position, which in turn can be associated with a higher likelihood of food insecurity.
In some cases, the female as a major income earner can also be a female lone parent, a group that is vulnerable to higher rates of food insecurity. The net worth of female lone parents ($64,500), however, was much lower than the overall net worth of families with female as a major income earner ($278,000), and notably lower than non-senior couples with children ($435,700). Also, they were the most likely to have zero or negative net worth, with 16% in this situation.
Looking at the marital status, separated, divorced and single (never married) were the most likely to report food insecurity. The net worth of the divorced ($116,300) and single ($54,200) was relatively lower and their proportions with zero or negative net worth were relatively higher. However, this was not true for the separated. They have a relatively high net worth ($418,200) and a low proportion with zero or negative net worth (1%).
Lower net worth among Indigenous families and recent immigrants
The net worth of Indigenous families living off reserve ($102,000), especially off reserve First Nations families ($56,000) was lower than that of non-Indigenous families ($341,000). For Métis families, the net worth was $168,000. Indigenous families were also more likely to have a zero or negative net worth.
Lastly recent immigrants (year of immigration: 2010 to 2019) had a notably lower net worth and a higher proportion with zero or negative net worth compared to the Canadian-born.
Much variations in net worth exists among those living above the low-income cutoff
Despite being above the poverty line, certain types of families were more likely to report food insecurity. These included families in which the major income earner was female, younger, less educated, recent immigrant, or Indigenous. All these characteristics were also associated with a more financially vulnerable position, due to either a lower net worth and/or a higher likelihood of having a zero or negative net worth.
Among families living above the low-income cutoff,Note families living in rental accommodation had a much lower net worth and a much higher likelihood of a zero or negative net worth (Table 6). Their net worth was $41,700 compared to that of homeowners with ($499,400) and without ($1,009,300) a mortgage.
Families with government transfers as the major source of income had a net worth almost one-half of those with wages and salaries as the major source and much lower than those with investment income, private retirement pensions and self-employment income as the major source. The net worth of paid employees was less than half that of self-employed.
Female lone parent families above the poverty line were at least twice as likely as other family types to report food insecurity. Their net worth ($104,200) was the lowest among all family types – it was less than one-fourth of all family types other than the non-elderly not in economic families. They were also the most likely to have a zero or negative net worth.
Indigenous families above the low-income cutoff living off reserve had a net worth of $153,400 compared to $427,500 for non-Indigenous families. The net worth for First Nations families living off reserve was even lower - $89,800. It was $225,700 for Métis families. Indigenous families were also more likely to have a zero or negative net worth.
Compared to Canadian-born and established immigrants, recent immigrants had a lower net worth and one-tenth had a zero or negative net worth.
Conclusion
Food insecurity, defined as a condition of not having access to sufficient food, or food of an adequate quality, to meet one’s basic needs, is a concern as it has been found to be associated with various chronic conditions. In this study, data from the 2021 Canadian Income Survey were used to look at characteristics of families who reported being food insecure. The study also used data from the 2019 Survey of Financial Security to look at the financial well-being of families that are more likely to be food insecure.
In 2022, 18% of families in Canada reported that they experienced some level of food insecurity over the past 12 months. This was up from 16% in 2021 and 17% in 2020. In 2022, among families below the poverty line, 35% reported food insecurity compared to 16% of those above the poverty line, though the majority of families (78%) who were food insecure were above the poverty line. Across income quintiles, 30% of families in the bottom income quintile were food insecure, compared to 7% in the top quintile.
Overall, families with a female as the major income earner were more likely to be food insecure compared to those with a male major income earner. Families with major income earners who were 55 years of age or older were less likely to be food insecure than the younger age groups. Higher levels of education were associated with lower food insecurity and so was being employed.
Certain family types/characteristics were associated with higher food insecurity overall and regardless of income levels (below or above the poverty line and across income quintiles). These included female lone parent families, those living in rental housing, families in which the major income earner was Indigenous, Black Canadian, and families whose major source of income was government transfers.
Families that were more likely to be food insecure were also more likely to be in a weaker financial position. For example, in 2019, compared to a net worth of $329,900 for all Canadian families, the net worth was notably lower for female lone parent families ($64,500), renters ($24,700), families in which the major income earner was Indigenous ($102,000), those for whom the major source of income was government transfers ($109,700).
A shortcoming of this study is that a direct association between food insecurity and debt, assets and net worth could not be provided given the unavailability of food insecurity information in the Survey of Financial Security. Another limitation of this study is the exclusion of families living in the three territories, on reserves and other Indigenous settlements in the provinces.Note This is likely to lead to an underestimate of food insecurity among the Indigenous population.
Sharanjit Uppal is a senior economist with the Centre for Social Data Insights and Innovation at Statistics Canada.
Start of text box
Data sources and definitions
This study uses data from two sources: 2021 Canadian Income Survey (CIS) and 2019 Survey of Financial Security (SFS). Excluded from the study are people living in the territories, on reserves and other Indigenous settlements in the provinces, institutionalized population, and households in extremely remote areas.
The primary objective of the CIS is to provide information on the income and income sources of Canadians, along with their individual and household characteristics. The data collected in the CIS is combined with Labour Force Survey and tax data.
The purpose of the SFS is to collect information from a sample of Canadian households on their assets, debts, employment, income and education. The SFS provides a comprehensive picture of the financial health of Canadians. Information is collected on the value of all major financial and non-financial assets and on the money owing on mortgages, vehicles, credit cards, student loans and other debts.
The CIS uses the Household Food Security Survey Module as a measure of food insecurity. It contains 18 questions designed to measure food insecurity resulting from limited financial resources. The questions relate to the household’s experience during the 12 months preceding the survey. The survey was conducted from January 16, 2022, to July 5, 2022.
Based on a household’s experience, food insecurity was categorized into three categories: marginal food insecurity: worry about running out of food and/or limited food selection due to a lack of money for food; moderate food insecurity: compromise in quality and/or quantity of food due to a lack of money for food; severe food insecurity: miss meals, reduce food intake and, at the most extreme, go day(s) without food. In this study, food insecurity refers to marginal, moderate or severe food insecurity.
The poverty line is based on the Market Based Measure of low income (MBM). The MBM develops thresholds of poverty based upon the cost of a basket of food, clothing, shelter, transportation, and other items for individuals and families representing a modest, basic standard of living. A family with disposable income less than the poverty threshold appropriate for their family’s size and region would be living in poverty (Heisz (2019)).
Income quintiles were calculated using after-tax economic family income and economic family size. The income levels were adjusted by dividing the economic family income by the square root of economic family size.
The unit of analysis is Canadian families. Canadian families include economic families and unattached individuals. An economic family refers to a group of two or more persons who live in the same dwelling and are related to each other by blood, marriage, common-law union, adoption or a foster relationship.
The unit of analysis to provide estimates of food insecurity from the CIS was chosen to be families rather than households for two reasons: (i) the focus of the study is on those living below and above the poverty line and the MBM measure of poverty uses family income rather than household income to define the poverty line; (ii) the unit of analysis in the SFS is family. Given that food insecurity is a household measure, results should be interpreted as “economic families and unattached individuals living in households that experienced food insecurity”.
Family characteristics including sex, age, level of education, marital status, student status, immigrant status, racialized group, Indigenous identity, labour force status, and class of worker refer to the characteristics of the major income earner.
Net worth of a family is the difference between its total assets and total debts. Total assets pertain to total family assets and include real estate (principal residence and all other real estate), employer pension plans (on a termination basis) and all other assets. Total debt pertains to total family debt and includes mortgage debt on the principal residence and all other real estate (Canadian and foreign), and consumer debt.
| Characteristics | All families | Poverty line | Sex of major income earner | ||
|---|---|---|---|---|---|
| Below | Above | Male | Female | ||
| percentage | |||||
| All families | 17.9 | 35.3 | 15.7 | 15.9 | 20.5 |
| Sex | |||||
| Male (ref.) | 15.9 | 35.1 | 14.0 | Note ...: not applicable | Note ...: not applicable |
| Female | 20.5Note * | 35.4 | 18.1Note * | Note ...: not applicable | Note ...: not applicable |
| Age group | |||||
| 16 to 24 years | 22.1 | 23.2Note * | 21.3 | 20.2 | 24.0 |
| 25 to 34 years | 21.9 | 34.3Note * | 20.2 | 18.8 | 26.3 |
| 35 to 44 years (ref.) | 22.8 | 45.7 | 20.7 | 19.6 | 27.4 |
| 45 to 54 years | 20.2Note * | 43.8 | 17.6Note * | 18.9 | 21.9Note * |
| 55 to 64 years | 16.9Note * | 45.6 | 12.9Note * | 14.6Note * | 20.3Note * |
| 65 years and over | 10.2Note * | 21.2Note * | 9.3Note * | 9.1Note * | 11.6Note * |
| Highest level of education | |||||
| Less than a high school diploma (ref.) | 22.1 | 42.1 | 17.7 | 21.0 | 23.8 |
| High school diploma | 21.6 | 36.9 | 18.8 | 19.9 | 23.9 |
| Trades/college certificate | 19.3Note * | 38.4 | 17.2 | 15.8Note * | 24.1 |
| University degree | 12.6Note * | 24.6Note * | 11.6Note * | 11.4Note * | 14.1Note * |
| Economic family type | |||||
| Non-elderly couple without children (ref.) | 11.9 | 29.0 | 11.1 | 11.2 | 13.2 |
| Non-elderly couple with children | 20.4Note * | 40.7 | 19.5Note * | 18.1Note * | 24.5Note * |
| Female lone-parent | 41.4Note * | 48.2Note * | 39.9Note * | Note ...: not applicable | 41.4Note * |
| Male lone-parent | 24.4Note * | Note F: too unreliable to be published | 20.4Note * | 24.4Note * | Note ...: not applicable |
| Other non-elderly families | 17.9Note * | 37.2 | 17.1Note * | 16.1Note * | 20.3Note * |
| Non-elderly not in economic families | 24.0Note * | 38.0 | 19.1Note * | 22.7Note * | 25.6Note * |
| Elderly families | 8.3Note * | 25.5 | 7.7Note * | 7.2Note * | 11.0 |
| Elderly not in economic families | 12.3 | 20.2 | 11.1 | 13.1 | 11.8 |
| Economic family size | |||||
| One | 20.2Note * | 34.5Note * | 16.2Note * | 20.5 | 19.9Note * |
| Two | 12.7Note * | 33.7Note * | 11.5Note * | 10.3Note * | 16.6Note * |
| Three | 18.0Note * | 40.6 | 16.8Note * | 14.9Note * | 22.4Note * |
| Four | 18.6Note * | 37.7 | 17.7Note * | 15.8Note * | 23.2Note * |
| Five or more (ref.) | 24.2 | 52.6 | 23.4 | 20.1 | 30.9 |
| Marital status | |||||
| Married (ref.) | 14.3 | 30.6 | 13.6 | 12.7 | 17.6 |
| Common-law | 15.3 | 42.4 | 14.2 | 14.3Note * | 17.1 |
| Separated | 27.5Note * | 42.8Note * | 24.5Note * | 22.2Note * | 31.9Note * |
| Divorced | 22.3Note * | 38.2 | 18.9Note * | 19.5 | 24.1Note * |
| Widowed | 12.0Note * | 27.0 | 10.4Note * | 11.3 | 12.3Note * |
| Single (never married) | 23.1Note * | 35.6 | 19.5Note * | 21.5Note * | 25.1Note * |
| Annual labour force status during the reference year | |||||
| Employed all year (ref.) | 14.7 | 28.1 | 14.3 | 13.6 | 16.6 |
| Unemployed all year | 45.3Note * | 60.0Note * | 30.7Note * | 45.3Note * | 45.4Note * |
| Not in the labour force all year | 26.1Note * | 42.6Note * | 17.8Note * | 23.8Note * | 28.4Note * |
| Employed part-year, unemployed part-year | 29.6Note * | 40.5Note * | 27.8Note * | 26.3Note * | 34.5Note * |
| Employed part-year, not in labour force part-year | 19.4Note * | 26.9 | 18.3Note * | 16.5Note * | 23.2Note * |
| Unemployed part-year, not in labour force part-year | 40.7Note * | 51.0Note * | 32.1Note * | 27.2Note * | 52.7Note * |
| Employed, unemployed and not in labour force during year | 34.7Note * | 27.1 | 37.2Note * | 29.5Note * | 41.0Note * |
| Class of worker during the reference year | |||||
| Employee (ref.) | 18.4 | 29.3 | 17.7 | 16.5 | 21.0 |
| Self-employed | 12.8Note * | 28.4 | 10.0Note * | 11.1Note * | 16.4Note * |
| Employee and self-employed | 18.3 | 34.1 | 16.1 | 16.6 | 20.7 |
| Did not work | 18.3 | 39.9 | 12.5 | 16.3 | 20.4 |
| Student status during the reference year | |||||
| Full-time student (ref.) | 25.0 | 25.9 | 24.2 | 19.8 | 28.8 |
| Part-time student | 24.4 | 28.6 | 24.0 | 19.5 | 27.9Note * |
| Not a student | 17.4Note * | 37.7Note * | 15.2Note * | 15.7 | 19.7 |
| Indigenous identity | |||||
| Indigenous | 34.2Note * | 48.1Note * | 30.6Note * | 29.6Note * | 39.7Note * |
| First Nations people living off reserve | 37.5Note * | 49.1Note * | 34.0Note * | 34.6Note * | 40.1Note * |
| Métis | 31.2Note * | 43.6 | 28.4Note * | 25.4Note * | 39.4Note * |
| Inuit | Note F: too unreliable to be published | Note F: too unreliable to be published | Note F: too unreliable to be published | Note F: too unreliable to be published | Note F: too unreliable to be published |
| Non-Indigenous (ref.) | 17.5 | 34.7 | 15.3 | 15.6 | 20.0 |
| Racialized population group | |||||
| All Racialized | 22.7Note * | 32.4 | 21.0Note * | 20.4Note * | 25.5Note * |
| South Asian | 19.3Note * | 24.6Note * | 18.5Note * | 15.5 | 25.5Note * |
| Chinese | 17.3 | 23.9Note * | 15.8 | 16.4 | 18.2 |
| Black | 37.6Note * | 56.4Note * | 33.2Note * | 35.2Note * | 40.1Note * |
| Filipino | 27.5Note * | Note F: too unreliable to be published | 28.4Note * | 26.9Note * | 28.1Note * |
| Arab | 21.9Note * | Note F: too unreliable to be published | 20.6Note * | 21.6Note * | 22.4 |
| Latin American | 19.0 | Note F: too unreliable to be published | 16.2 | 19.0 | 19.0 |
| Southeast Asian | 23.3Note * | Note F: too unreliable to be published | 17.7 | 21.7Note * | 24.9 |
| Other racialized | 19.1 | 21.7Note * | 18.4Note * | 15.1 | 23.9 |
| Non-racialized non-Indigenous (ref.) | 15.9 | 35.7 | 13.7 | 14.1 | 18.2 |
| Immigrant status | |||||
| Immigrated 2013 to 2022 | 25.6Note * | 29.0 | 25.0Note * | 20.3Note * | 32.4Note * |
| Immigrated before 2013 | 20.0Note * | 35.8 | 18.1Note * | 18.0Note * | 22.5Note * |
| Canadian born (ref.) | 16.7 | 38.2 | 14.2 | 15.0 | 18.9 |
| Major source of income | |||||
| Wages and salaries (ref.) | 16.5 | 26.4 | 16.0 | 15.2 | 18.4 |
| Self-employment income | 11.6 | 16.3 | 10.5Note * | 9.8Note * | 14.5 |
| Government transfers | 28.8Note * | 43.3Note * | 22.9Note * | 26.3Note * | 31.0Note * |
| Investment income | 4.9Note * | Note F: too unreliable to be published | 4.3Note * | 4.7Note * | FNote * |
| Private retirement pensions | 4.8Note * | Note F: too unreliable to be published | 4.6Note * | 4.5Note * | 5.0Note * |
| Other income | 17.6 | 19.5 | 16.5 | 11.2 | 23.2 |
| Home ownership | |||||
| Owner without mortgage (ref.) | 8.7 | 21.7 | 7.9 | 7.7 | 10.1 |
| Owner with mortgage | 16.1Note * | 27.1 | 15.4Note * | 15.0Note * | 17.8Note * |
| Renter - non-subsidized housing | 25.5Note * | 37.3Note * | 22.6Note * | 23.1Note * | 28.2Note * |
| Renter - subsidized housing | 42.3Note * | 61.9Note * | 33.6Note * | 40.4Note * | 43.8Note * |
| Population centre/rural | |||||
| Population centre (ref.) | 18.5 | 35.7 | 16.2 | 16.4 | 21.3 |
| Rural area | 14.6Note * | 31.6 | 13.1Note * | 13.7 | 16.1 |
| CMA | |||||
| Montreal | 15.8Note * | 33.3 | 14.0Note * | 13.7Note * | 18.6Note * |
| Ottawa-Gatineau | 14.4Note * | 23.6 | 13.4Note * | 12.7Note * | 16.7Note * |
| Toronto (ref.) | 20.2 | 34.6 | 17.8 | 17.6 | 23.3 |
| Winnipeg | 18.7 | 30.8 | 16.8 | 16.3 | 21.6 |
| Calgary | 19.5 | 33.6 | 17.5 | 18.9 | 20.3 |
| Edmonton | 20.7 | 27.3 | 19.8 | 20.3 | 21.2 |
| Vancouver | 15.9Note * | 32.4 | 13.2Note * | 13.6Note * | 18.8 |
| Other CMA or CA | 18.4 | 38.6 | 16.0 | 16.4 | 21.1 |
| Province | |||||
| Newfoundland and Labrador | 22.6Note * | 50.1Note * | 19.2Note * | 19.7 | 26.7Note * |
| Prince Edward Island | 21.2 | 23.6Note * | 20.9Note * | 18.5 | 24.3 |
| Nova Scotia | 21.1Note * | 35.9 | 18.8Note * | 17.7 | 25.3Note * |
| New Brunswick | 21.8Note * | 37.5 | 20.0Note * | 20.1Note * | 24.0 |
| Quebec | 14.1Note * | 32.9 | 12.3Note * | 12.2Note * | 16.6Note * |
| Ontario (ref.) | 18.7 | 36.2 | 16.4 | 16.8 | 21.2 |
| Manitoba | 18.8 | 32.5 | 16.9 | 16.9 | 21.4 |
| Saskatchewan | 19.7 | 37.0 | 17.2 | 17.6 | 22.8 |
| Alberta | 21.7Note * | 36.2 | 19.6Note * | 20.8Note * | 23.0 |
| British Columbia | 16.9 | 33.9 | 14.3Note * | 13.9Note * | 20.8 |
|
... not applicable F too unreliable to be published
|
|||||
| Percentage | |
|---|---|
| All families | 41.4 |
| Age group | |
| 16 to 24 years | Note F: too unreliable to be published |
| 25 to 34 years | 50.6 |
| 35 to 44 years (ref.) | 40.5 |
| 45 to 54 years | 37.7 |
| 55 to 64 years | Note F: too unreliable to be published |
| 65 years and over | Note ...: not applicable |
| Highest level of education | |
| Less than a high school diploma (ref.) | 65.4 |
| High school diploma | 43.5Note * |
| Trades/college certificate | 42.1Note * |
| University degree | 30.8Note * |
| Economic family size | |
| One | Note ...: not applicable |
| Two | 36.9 |
| Three | 43.4 |
| Four | 40.2 |
| Five or more (ref.) | 51.9 |
| Marital status | |
| Married (ref.) | 37.9 |
| Common-law | Note F: too unreliable to be published |
| Separated | 40.9 |
| Divorced | 35.1 |
| Widowed | Note F: too unreliable to be published |
| Single (never married) | 46.0 |
| Annual labour force status during the reference year | |
| Employed all year (ref.) | 33.4 |
| Unemployed all year | 70.5Note * |
| Not in the labour force all year | 56.5Note * |
| Employed part-year, unemployed part-year | 52.5Note * |
| Employed part-year, not in labour force part-year | 37.3 |
| Unemployed part-year, not in labour force part-year | Note F: too unreliable to be published |
| Employed, unemployed and not in labour force during year | 55.5Note * |
| Class of worker during the reference year | |
| Employee (ref.) | 39.6 |
| Self-employed | 18.9 |
| Employee and self-employed | Note F: too unreliable to be published |
| Did not work | 57.4 |
| Student status during reference year | |
| Full-time student (ref.) | 57.1 |
| Part-time student | Note F: too unreliable to be published |
| Not a student | 40.3 |
| Indigenous identity | |
| Indigenous (living off-reserve) | 60.1Note * |
| Non-Indigenous (ref.) | 40.6 |
| Racialized population group | |
| Black | 62.4Note * |
| All other racialized | 27.8Note * |
| Non-racialized non-Indigenous (ref.) | 40.3 |
| Immigrant status | |
| Immigrated 2013 to 2022 | 46.3 |
| Immigrated before 2013 | 40.2 |
| Canadian born (ref.) | 41.4 |
| Major source of income | |
| Wages and salaries (ref.) | 34.6 |
| Self-employment income | Note F: too unreliable to be published |
| Government transfers | 54.9Note * |
| Investment income | Note F: too unreliable to be published |
| Private retirement pensions | Note F: too unreliable to be published |
| Other income | Note F: too unreliable to be published |
| Home ownership | |
| Owner without mortgage (ref.) | 17.7 |
| Owner with mortgage | 29.8Note * |
| Renter - non-subsidized housing | 49.9Note * |
| Renter - subsidized housing | 66.0Note * |
|
... not applicable F too unreliable to be published
|
|
| Characteristics | Adjusted family income quintile | ||||
|---|---|---|---|---|---|
| Bottom | Second | Third | Fourth | Top | |
| percentage | |||||
| All families | 30.4 | 23.3 | 17.4 | 11.7 | 6.6 |
| Sex | |||||
| Male (ref.) | 28.8 | 21.3 | 16.4 | 11.4 | 6.6 |
| Female | 31.8 | 25.5Note * | 18.8 | 12.1 | 6.6 |
| Age group | |||||
| 16 to 24 years | 24.5Note * | 24.9Note * | 17.0Note * | Note F: too unreliable to be published | Note F: too unreliable to be published |
| 25 to 34 years | 34.9Note * | 30.7 | 22.2 | 12.4 | 10.1Note * |
| 35 to 44 years (ref.) | 44.5 | 35.1 | 25.3 | 14.3 | 6.4 |
| 45 to 54 years | 43.2 | 27.9Note * | 22.2 | 17.9Note * | 7.3 |
| 55 to 64 years | 40.6 | 24.4Note * | 12.4Note * | 10.0Note * | 5.9 |
| 65 years and over | 18.0Note * | 10.8Note * | 7.4Note * | 4.1Note * | 2.5Note * |
| Highest level of education | |||||
| Less than a high school diploma (ref.) | 31.1 | 19.4 | 15.1 | 9.6 | Note F: too unreliable to be published |
| High school diploma | 32.5 | 23.1 | 18.4 | 15.9Note * | 7.9 |
| Trades/college certificate | 33.0 | 26.2Note * | 19.0 | 11.6 | 7.4 |
| University degree | 22.9Note * | 21.4 | 15.1 | 10.0 | 5.8 |
| Economic family type | |||||
| Non-elderly couple without children (ref.) | 27.0 | 23.7 | 14.3 | 10.0 | 5.6 |
| Non-elderly couple with children | 39.1Note * | 32.9Note * | 23.7Note * | 14.6Note * | 7.4 |
| Female lone-parent | 54.8Note * | 45.9Note * | 28.1Note * | 18.3Note * | Note F: too unreliable to be published |
| Male lone-parent | 50.6Note * | 30.3 | 15.6Note * | Note F: too unreliable to be published | Note F: too unreliable to be published |
| Other non-elderly families | 38.4Note * | 32.7Note * | 20.2Note * | 16.6Note * | 8.1Note * |
| Non-elderly not in economic families | 36.4Note * | 25.1 | 20.6Note * | 12.1 | 8.7Note * |
| Elderly families | 18.0Note * | 9.8Note * | 9.0Note * | 4.2Note * | 2.4Note * |
| Elderly not in economic families | 18.1Note * | 11.7Note * | 5.0Note * | 4.0Note * | Note F: too unreliable to be published |
| Economic family size | |||||
| One | 29.2Note * | 20.0Note * | 16.2Note * | 10.4Note * | 7.7Note * |
| Two | 27.5Note * | 19.4Note * | 12.6Note * | 8.5Note * | 4.4Note * |
| Three | 40.3 | 27.5Note * | 20.7 | 13.4 | 7.1Note * |
| Four | 40.9 | 33.7 | 21.4 | 14.9 | 6.7Note * |
| Five or more (ref.) | 45.0 | 36.7 | 26.5 | 17.4 | 11.9 |
| Marital status | |||||
| Married (ref.) | 24.2 | 21.9 | 17.6 | 11.9 | 6.1 |
| Common-law | 36.7Note * | 25.8 | 18.2 | 10.7 | 6.3 |
| Separated | 39.7Note * | 36.1Note * | 25.8Note * | 13.7 | Note F: too unreliable to be published |
| Divorced | 33.3Note * | 24.2 | 14.9 | 14.1 | 6.2 |
| Widowed | 18.8Note * | 11.7Note * | 5.9Note * | 5.8Note * | Note F: too unreliable to be published |
| Single (never married) | 34.1Note * | 26.3Note * | 19.1 | 11.9 | 9.7Note * |
| Annual labour force status during the reference year | |||||
| Employed all year (ref.) | 24.9 | 25.6 | 19.3 | 12.6 | 6.2 |
| Unemployed all year | 56.7Note * | 38.1 | Note F: too unreliable to be published | Note F: too unreliable to be published | Note F: too unreliable to be published |
| Not in the labour force all year | 40.0Note * | 22.0 | 9.1Note * | 7.4Note * | 7.6 |
| Employed part-year, unemployed part-year | 43.0Note * | 30.5 | 29.3Note * | 18.6Note * | 11.4 |
| Employed part-year, not in labour force part-year | 26.5 | 29.0 | 19.2 | 12.1 | 9.3Note * |
| Unemployed part-year, not in labour force part-year | 52.5Note * | Note F: too unreliable to be published | Note F: too unreliable to be published | Note F: too unreliable to be published | Note F: too unreliable to be published |
| Employed, unemployed and not in labour force during year | 31.4 | 44.6Note * | 35.4Note * | 22.1Note * | Note F: too unreliable to be published |
| Class of worker during the reference year | |||||
| Employee (ref.) | 31.1 | 29.7 | 21.2 | 14.0 | 7.4 |
| Self-employed | 23.1Note * | 21.9Note * | 13.3Note * | 4.5Note * | 3.4Note * |
| Employee and self-employed | 35.1 | 24.6 | 23.2 | Note F: too unreliable to be published | Note F: too unreliable to be published |
| Did not work | 31.0 | 14.0 | 7.5 | 5.0 | 4.4 |
| Student status during reference year | |||||
| Full-time student (ref.) | 25.0 | 31.0 | 21.7 | 18.0 | Note F: too unreliable to be published |
| Part-time student | 33.2 | 29.5Note * | 27.2 | 20.8 | Note F: too unreliable to be published |
| Not a student | 31.2 | 22.7 | 17.0 | 11.3 | 6.4 |
| Indigenous identity | |||||
| Indigenous | 47.5Note * | 36.2Note * | 33.5Note * | 29.1Note * | Note F: too unreliable to be published |
| First Nations people living off reserve | 48.1Note * | 38.7Note * | 36.6Note * | 40.5Note * | Note F: too unreliable to be published |
| Métis | 44.2Note * | 33.7Note * | 31.5Note * | 23.0Note * | Note F: too unreliable to be published |
| Inuit | Note F: too unreliable to be published | Note F: too unreliable to be published | Note F: too unreliable to be published | Note F: too unreliable to be published | Note F: too unreliable to be published |
| Non-Indigenous (ref.) | 29.8 | 23.0 | 17.0 | 11.3 | 6.5 |
| Racialized population group | |||||
| All Racialized | 31.5 | 29.0Note * | 23.7Note * | 16.1Note * | 11.0Note * |
| South Asian | 25.4 | 26.7 | 23.6Note * | 13.4 | 7.6 |
| Chinese | 23.2 | 21.8 | 16.3 | 13.5 | 10.7Note * |
| Black | 53.1Note * | 45.0Note * | 37.3Note * | 17.6Note * | 19.4Note * |
| Filipino | Note F: too unreliable to be published | 36.5Note * | 27.5Note * | 27.3Note * | 21.7Note * |
| Arab | 26.0 | 33.8 | Note F: too unreliable to be published | Note F: too unreliable to be published | Note F: too unreliable to be published |
| Latin American | 38.6 | 21.7 | Note F: too unreliable to be published | Note F: too unreliable to be published | Note F: too unreliable to be published |
| Southeast Asian | 42.5 | Note F: too unreliable to be published | 25.6Note * | Note F: too unreliable to be published | Note F: too unreliable to be published |
| Other racialized | 25.5 | 25.6 | 24.8Note * | Note F: too unreliable to be published | Note F: too unreliable to be published |
| Non-racialized non-Indigenous (ref.) | 29.2 | 21.1 | 15.0 | 9.9 | 5.3 |
| Immigrant status | |||||
| Immigrated 2013 to 2022 | 28.6 | 31.5Note * | 29.8Note * | 16.5Note * | 12.9Note * |
| Immigrated before 2013 | 30.5 | 25.7 | 19.3Note * | 16.4Note * | 9.3Note * |
| Canadian born (ref.) | 31.3 | 21.8 | 15.8 | 10.1 | 5.6 |
| Major source of income | |||||
| Wages and salaries (ref.) | 26.8 | 27.4 | 20.2 | 13.5 | 7.4 |
| Self-employment income | 13.7Note * | 23.2 | 12.2 | 13.1 | Note F: too unreliable to be published |
| Government transfers | 34.1Note * | 22.6Note * | 21.7 | 12.6 | Note F: too unreliable to be published |
| Investment income | 11.6Note * | Note F: too unreliable to be published | Note F: too unreliable to be published | Note F: too unreliable to be published | Note F: too unreliable to be published |
| Private retirement pensions | 13.2Note * | 7.9Note * | 5.3Note * | 2.2Note * | 2.5Note * |
| Other income | 19.2 | Note F: too unreliable to be published | Note F: too unreliable to be published | Note F: too unreliable to be published | Note F: too unreliable to be published |
| Home ownership | |||||
| Owner without mortgage (ref.) | 18.0 | 11.4 | 7.6 | 5.6 | 2.6 |
| Owner with mortgage | 26.3Note * | 24.0Note * | 20.2Note * | 13.5Note * | 8.4Note * |
| Renter - non-subsidized housing | 34.3Note * | 29.6Note * | 22.1Note * | 14.9Note * | 8.4Note * |
| Renter - subsidized housing | 48.8Note * | 40.8Note * | 21.1Note * | Note F: too unreliable to be published | Note F: too unreliable to be published |
| Population centre/rural | |||||
| Population centre (ref.) | 31.1 | 24.5 | 18.0 | 12.1 | 6.8 |
| Rural area | 26.5Note * | 17.3Note * | 14.5Note * | 9.6Note * | 6.0 |
| CMA | |||||
| Montreal | 27.1 | 21.1Note * | 13.0Note * | 9.4 | 5.9 |
| Ottawa-Gatineau | 21.0Note * | 17.3Note * | 21.4 | 12.0 | 6.4 |
| Toronto (ref.) | 31.6 | 35.2 | 19.0 | 12.1 | 7.1 |
| Winnipeg | 29.1 | 25.0Note * | 14.7 | 12.8 | 8.5 |
| Calgary | 34.8 | 23.6Note * | 28.8Note * | 10.8 | 7.1 |
| Edmonton | 26.9 | 26.5 | 28.2Note * | 21.5Note * | 7.2 |
| Vancouver | 29.7 | 16.3Note * | 16.4 | 13.3 | 6.2 |
| Other CMA or CA | 32.6 | 22.6Note * | 17.5 | 11.1 | 6.5 |
| Province | |||||
| Newfoundland and Labrador | 38.2 | 26.3 | 22.2 | 12.8 | Note F: too unreliable to be published |
| Prince Edward Island | 26.2 | 31.6 | 17.8 | 12.2 | Note F: too unreliable to be published |
| Nova Scotia | 32.7 | 29.2 | 19.6 | 9.2 | Note F: too unreliable to be published |
| New Brunswick | 31.9 | 25.0 | 21.4 | 14.6 | 8.8 |
| Quebec | 25.6Note * | 16.4Note * | 11.8Note * | 7.8Note * | 4.7 |
| Ontario (ref.) | 32.2 | 27.9 | 18.2 | 11.7 | 6.6 |
| Manitoba | 29.6 | 23.1 | 15.6 | 12.1 | 8.8 |
| Saskatchewan | 31.5 | 25.5 | 19.9 | 12.2 | 7.1 |
| Alberta | 34.1 | 27.1 | 27.1Note * | 18.1Note * | 9.1 |
| British Columbia | 31.0 | 19.4Note * | 17.5 | 12.6 | 6.2 |
F too unreliable to be published
|
|||||
| Characteristics | Percentage |
|---|---|
| All families | 29.5 |
| Number of disabilities | |
| One (ref.) | 23.3 |
| Two | 28.1Note * |
| Three | 33.9Note * |
| Four or more | 42.2Note * |
| Severity of disability | |
| Mild (ref.) | 23.3 |
| Moderate | 31.9Note * |
| Severe | 38.0Note * |
| Very severe | 39.2Note * |
| Sex | |
| Male (ref.) | 26.6 |
| Female | 32.4Note * |
| Age group | |
| 16 to 24 years | 49.1 |
| 25 to 34 years | 39.6 |
| 35 to 44 years (ref.) | 37.9 |
| 45 to 54 years | 35.8 |
| 55 to 64 years | 32.5 |
| 65 years and over | 16.2Note * |
| Highest level of education | |
| Less than a high school diploma (ref.) | 33.6 |
| High school diploma | 33.1 |
| Trades/college certificate | 30.3 |
| University degree | 22.9Note * |
| Economic family type | |
| Non-elderly couple without children (ref.) | 22.8 |
| Non-elderly couple with children | 29.7 |
| Female lone-parent | 62.0Note * |
| Male lone-parent | 45.1Note * |
| Other non-elderly families | 33.7 |
| Non-elderly not in economic families | 42.6Note * |
| Elderly families | 13.6Note * |
| Elderly not in economic families | 18.5Note * |
| Marital status | |
| Married (ref.) | 21.2 |
| Common-law | 29.2Note * |
| Separated | 47.6Note * |
| Divorced | 32.3Note * |
| Widowed | 17.3Note * |
| Single (never married) | 41.2Note * |
| Annual labour force status during the reference year | |
| Employed all year (ref.) | 23.8 |
| Unemployed all year | 65.6Note * |
| Not in the labour force all year | 41.6Note * |
| Employed part-year, unemployed part-year | 45.0Note * |
| Employed part-year, not in labour force part-year | 34.5Note * |
| Unemployed part-year, not in labour force part-year | 59.5Note * |
| Employed, unemployed and not in labour force during year | 48.4Note * |
| Class of worker during the reference year | |
| Employee (ref.) | 31.4 |
| Self-employed | 22.1Note * |
| Employee and self-employed | 30.7 |
| Did not work | 28.6 |
| Student status during the reference year | |
| Full-time student (ref.) | 53.9 |
| Part-time student | 41.7Note * |
| Not a student | 28.3 |
| Indigenous identity | |
| Indigenous | 52.2Note * |
| First Nations people living off reserve | 55.2Note * |
| Métis | 48.8Note * |
| Inuit | Note F: too unreliable to be published |
| Non-Indigenous (ref.) | 28.7 |
| Racialized population group | |
| All Racialized | 35.7Note * |
| South Asian | 30.5 |
| Chinese | 30.1 |
| Black | 54.5Note * |
| Filipino | 42.2 |
| Arab | 35.0 |
| Latin American | 35.4 |
| Southeast Asian | 46.8 |
| Other racialized | 23.2 |
| Non-racialized non-Indigenous (ref.) | 27.3 |
| Immigrant status | |
| Immigrated 2013 to 2022 | 41.5Note * |
| Immigrated before 2013 | 29.8 |
| Canadian born (ref.) | 29.0 |
| Major source of income | |
| Wages and salaries (ref.) | 27.6 |
| Self-employment income | 21.3 |
| Government transfers | 39.9Note * |
| Investment income | 7.1Note * |
| Private retirement pensions | 9.1Note * |
| Other income | 33.0 |
| Home ownership | |
| Owner without mortgage (ref.) | 14.2 |
| Owner with mortgage | 26.1Note * |
| Renter - non-subsidized housing | 41.3Note * |
| Renter - subsidized housing | 54.3Note * |
| Poverty | |
| Below poverty line | 52.2Note * |
| Above poverty line (ref.) | 25.1 |
| Income quintile | |
| Bottom (ref.) | 44.3 |
| Second | 35.5Note * |
| Third | 23.6Note * |
| Fourth | 17.1Note * |
| Top | 10.7Note * |
| Population centre/rural | |
| Population centre (ref.) | 30.4 |
| Rural area | 24.5Note * |
| CMA | |
| Montreal | 32.0 |
| Ottawa-Gatineau | 24.1 |
| Toronto (ref.) | 32.1 |
| Winnipeg | 32.4 |
| Calgary | 39.0 |
| Edmonton | 33.1 |
| Vancouver | 20.9Note * |
| Other CMA or CA | 29.7 |
| Province | |
| Newfoundland and Labrador | 40.0Note * |
| Prince Edward Island | 34.5 |
| Nova Scotia | 34.9 |
| New Brunswick | 30.7 |
| Quebec | 27.6 |
| Ontario (ref.) | 29.7 |
| Manitoba | 29.7 |
| Saskatchewan | 31.5 |
| Alberta | 34.5 |
| British Columbia | 24.6Note * |
F too unreliable to be published
|
|
| Characteristics | Proportion with consumer debt | Median consumer debt | Median net worth | Zero or negative net worth |
|---|---|---|---|---|
| percentage | dollars | percentage | ||
| All families | 61.2 | 20,000 | 329,900 | 5.6 |
| Sex | ||||
| Male | 61.6 | 20,000 | 384,900 | 4.8 |
| Female | 60.5 | 17,600 | 278,000 | 6.7 |
| Age group | ||||
| 16 to 24 years | 53.9 | 8,900 | 13,300 | 15.5 |
| 25 to 34 years | 73.2 | 20,000 | 79,700 | 12.0 |
| 35 to 44 years | 73.9 | 21,000 | 234,400 | 7.2 |
| 45 to 54 years | 69.6 | 24,000 | 521,100 | 3.6 |
| 55 to 64 years | 62.4 | 22,000 | 690,000 | 3.5 |
| 65 years and over | 38.6 | 10,000 | 543,200 | 1.2 |
| Highest level of education | ||||
| Less than a high school diploma | 47.5 | 10,700 | 186,000 | 5.6 |
| High school diploma | 60.2 | 17,300 | 249,700 | 5.6 |
| Trades/college certificate | 66.9 | 20,000 | 328,300 | 5.8 |
| University degree | 61.4 | 22,000 | 530,002 | 5.4 |
| Economic family type | ||||
| Non-elderly couple without children | 68.4 | 25,000 | 459,400 | 3.9 |
| Non-elderly couple with children | 77.5 | 27,300 | 435,700 | 4.0 |
| Female lone-parent | 73.6 | 15,000 | 64,500 | 16.0 |
| Male lone-parent | 73.2 | 17,000 | 356,300 | 7.3 |
| Other non-elderly families | 74.2 | 25,000 | 579,800 | 3.8 |
| Non-elderly not in economic families | 58.4 | 12,500 | 51,000 | 11.8 |
| Elderly families | 44.1 | 14,000 | 840,900 | 0.5 |
| Elderly not in economic families | 33.4 | 5,700 | 322,300 | 1.8 |
| Economic family size | ||||
| One | 49.9 | 10,300 | 109,400 | 8.4 |
| Two | 59.2 | 20,000 | 551,200 | 3.5 |
| Three | 72.4 | 22,500 | 462,000 | 4.8 |
| Four | 75.6 | 29,000 | 551,100 | 3.6 |
| Five or more | 80.8 | 29,700 | 460,300 | 4.4 |
| Marital status | ||||
| Married | 63.5 | 25,000 | 657,600 | 2.3 |
| Common-law | 77.3 | 21,600 | 284,800 | 5.6 |
| Separated | 31.9 | 10,000 | 418,200 | 1.1 |
| Divorced | 66.6 | 20,500 | 116,300 | 13.5 |
| Widowed | 60.3 | 12,500 | 251,300 | 7.2 |
| Single (never married) | 58.2 | 11,900 | 54,200 | 10.8 |
| Class of worker | ||||
| Employee | 71.9 | 21,000 | 288,900 | 5.9 |
| Self-employed | 64.6 | 26,600 | 672,400 | 6.0 |
| Unpaid family worker | 29.0 | F | F | Note F: too unreliable to be published |
| Did not work | 42.5 | 10,000 | 350,600 | 5.0 |
| Indigenous identity | ||||
| Indigenous | 66.1 | 24,300 | 102,000 | 9.1 |
| First Nations people living off reserve | 58.7 | 21,200 | 56,000 | 7.9 |
| Métis | 74.1 | 25,000 | 168,000 | 10.5 |
| Inuit | Note F: too unreliable to be published | F | F | Note F: too unreliable to be published |
| Non-Indigenous | 61.0 | 19,600 | 341,000 | 5.5 |
| Immigrant status | ||||
| Immigrated 2010 to 2019 | 67.2 | 18,000 | 55,200 | 10.8 |
| Immigrated before 2010 | 56.4 | 20,000 | 524,200 | 4.6 |
| Canadian born | 62.7 | 20,000 | 359,000 | 5.3 |
| Economic family major source of income | ||||
| Wages and salaries | 71.3 | 21,000 | 326,900 | 5.6 |
| Self-employment income | 60.0 | 20,400 | 399,900 | 5.4 |
| Government transfers | 43.6 | 1,000 | 109,700 | 7.7 |
| Investment income | 53.0 | 34,200 | 1,297,700 | 1.8 |
| Private retirement pensions | 39.6 | 11,900 | 1,089,800 | 0.1 |
| Other income | 57.8 | 10,500 | 39,000 | 16.2 |
| Home ownership | ||||
| Owner without mortgage | 44.1 | 20,000 | 965,000 | Note F: too unreliable to be published |
| Owner with mortgage | 77.4 | 25,000 | 497,500 | 0.7 |
| Renter | 58.7 | 12,500 | 24,700 | 13.9 |
| Rural area | ||||
| Not a rural area | 60.8 | 19,200 | 328,000 | 5.9 |
| Rural area | 64.5 | 21,800 | 341,200 | 2.4 |
| CMA | ||||
| Montreal | 61.6 | 12,500 | 220,200 | 5.8 |
| Ottawa-Gatineau | 59.5 | 19,400 | 348,000 | 7.9 |
| Toronto | 54.6 | 20,000 | 467,900 | 6.0 |
| Calgary | 62.4 | 25,000 | 336,100 | 8.9 |
| Vancouver | 52.7 | 21,800 | 521,500 | 4.6 |
| Province | ||||
| Newfoundland and Labrador | 69.1 | 24,600 | 247,300 | 4.9 |
| Prince Edward Island | 65.6 | 20,000 | 211,400 | 5.6 |
| Nova Scotia | 69.2 | 20,000 | 257,900 | 9.6 |
| New Brunswick | 71.1 | 21,200 | 185,000 | 5.3 |
| Quebec | 62.4 | 13,000 | 237,800 | 4.5 |
| Ontario | 59.9 | 20,000 | 434,500 | 6.1 |
| Manitoba | 59.5 | 16,000 | 295,700 | 2.7 |
| Saskatchewan | 66.4 | 24,000 | 330,500 | 4.0 |
| Alberta | 63.8 | 26,000 | 317,300 | 7.2 |
| British Columbia | 55.7 | 21,500 | 423,700 | 5.4 |
|
F too unreliable to be published Source: Statistics Canada, Survey of Financial Security, 2019. |
||||
| Characteristics | Below LICO | Above LICO | ||||
|---|---|---|---|---|---|---|
| Median consumer debt | Median net worth | Zero or negative net worth | Median consumer debt | Median net worth | Zero or negative net worth | |
| dollars | percentage | dollars | percentage | |||
| All families | 9,900 | 13,700 | 13.3 | 20,000 | 415,100 | 4.4 |
| Sex | ||||||
| Male | 10,000 | 14,000 | 10.4 | 21,000 | 456,900 | 4.1 |
| Female | 8,000 | 13,300 | 16.2 | 19,000 | 351,200 | 4.9 |
| Age group | ||||||
| 16 to 24 years | 8,000 | 6,100 | 14.0 | 11,000 | 23,200 | 17.2 |
| 25 to 34 years | 10,000 | 7,200 | 19.2 | 20,500 | 101,300 | 10.9 |
| 35 to 44 years | 10,500 | 19,800 | 16.9 | 24,000 | 280,300 | 5.8 |
| 45 to 54 years | 12,000 | 21,100 | 14.3 | 25,000 | 582,800 | 2.4 |
| 55 to 64 years | 12,000 | 32,500 | 11.9 | 22,500 | 800,600 | 2.2 |
| 65 years and over | 3,900 | 65,000 | Note F: too unreliable to be published | 10,000 | 586,500 | 1.0 |
| Highest level of education | ||||||
| Less than a high school diploma | 2,500 | 8,100 | 9.8 | 13,700 | 235,000 | 4.7 |
| High school diploma | 6,300 | 8,700 | 12.2 | 20,000 | 380,600 | 4.3 |
| Trades/college certificate | 10,500 | 8,400 | 15.9 | 20,000 | 388,600 | 4.3 |
| University degree | 13,500 | 54,200 | 14.0 | 23,000 | 620,000 | 4.5 |
| Economic family type | ||||||
| Non-elderly couple without children | 25,000 | 216,700 | Note F: too unreliable to be published | 25,000 | 491,700 | 3.7 |
| Non-elderly couple with children | 25,000 | 53,300 | Note F: too unreliable to be published | 28,000 | 457,100 | 3.5 |
| Female lone-parent | 7,000 | 7,000 | 19.9 | 18,800 | 104,200 | 14.9 |
| Male lone-parent | F | F | Note F: too unreliable to be published | 17,300 | 415,000 | Note F: too unreliable to be published |
| Other non-elderly families | 8,000 | 42,000 | Note F: too unreliable to be published | 26,000 | 622,000 | 3.8 |
| Non-elderly not in economic families | 8,500 | 5,400 | 16.8 | 15,000 | 122,800 | 9.4 |
| Elderly families | F | 534,000 | Note F: too unreliable to be published | 13,500 | 847,400 | Note F: too unreliable to be published |
| Elderly not in economic families | 2,500 | 33,000 | Note F: too unreliable to be published | 6,600 | 377,400 | 1.7 |
| Economic family size | ||||||
| One | 8,000 | 8,000 | 14.3 | 12,000 | 205,600 | 6.3 |
| Two | 13,200 | 175,000 | 8.6 | 20,000 | 567,500 | 3.3 |
| Three | 12,300 | 38,000 | 12.2 | 24,000 | 493,100 | 4.2 |
| Four | 20,800 | 53,300 | Note F: too unreliable to be published | 30,000 | 592,700 | 3.4 |
| Five or more | 12,100 | 23,300 | Note F: too unreliable to be published | 30,000 | 478,500 | 3.6 |
| Marital status | ||||||
| Married | 22,500 | 158,000 | 7.0 | 25,000 | 691,500 | 2.0 |
| Common-law | F | 27,700 | Note F: too unreliable to be published | 21,800 | 297,200 | 5.3 |
| Separated | F | 134,000 | Note F: too unreliable to be published | 10,000 | 447,100 | Note F: too unreliable to be published |
| Divorced | 5,500 | 21,800 | Note F: too unreliable to be published | 25,000 | 192,000 | 13.9 |
| Widowed | 10,500 | 6,300 | 16.4 | 15,000 | 315,200 | 4.9 |
| Single (never married) | 8,000 | 6,000 | 16.2 | 13,000 | 115,700 | 8.7 |
| Class of worker | ||||||
| Employee | 9,900 | 13,000 | 14.3 | 22,000 | 326,100 | 5.2 |
| Self-employed | 12,500 | 92,500 | Note F: too unreliable to be published | 29,000 | 780,600 | 4.4 |
| Unpaid family worker | F | F | Note F: too unreliable to be published | F | F | Note F: too unreliable to be published |
| Did not work | 7,000 | 9,500 | 12.7 | 11,000 | 512,000 | 2.8 |
| Indigenous identity | ||||||
| Indigenous | 7,100 | 1,400 | Note F: too unreliable to be published | 27,500 | 153,400 | 7.2 |
| First Nations people living off reserve | F | 1,400 | Note F: too unreliable to be published | 24,000 | 89,800 | Note F: too unreliable to be published |
| Métis | F | F | Note F: too unreliable to be published | 31,500 | 225,700 | Note F: too unreliable to be published |
| Inuit | F | F | Note F: too unreliable to be published | F | F | Note F: too unreliable to be published |
| Non-Indigenous | 9,900 | 15,000 | 13.1 | 20,000 | 427,500 | 4.3 |
| Immigrant status | ||||||
| Immigrated 2010 to 2019 | 10,000 | 15,300 | 14.1 | 18,000 | 71,000 | 9.9 |
| Immigrated before 2010 | 10,000 | 24,700 | 13.2 | 20,000 | 601,000 | 3.1 |
| Canadian born | 10,000 | 13,700 | 14.7 | 20,000 | 422,500 | 4.2 |
| Economic family major source of income | ||||||
| Wages and salaries | 9,900 | 12,900 | 14.9 | 22,000 | 364,500 | 5.0 |
| Self-employment income | 18,000 | 40,000 | Note F: too unreliable to be published | 29,000 | 667,600 | Note F: too unreliable to be published |
| Government transfers | 8,000 | 9,600 | 12.9 | 10,000 | 210,700 | 5.1 |
| Investment income | F | 794,600 | Note F: too unreliable to be published | 35,000 | 1,493,800 | Note F: too unreliable to be published |
| Private retirement pensions | F | F | Note F: too unreliable to be published | 12,000 | 1,089,800 | Note F: too unreliable to be published |
| Other income | 10,500 | 5,500 | Note F: too unreliable to be published | 12,000 | 204,000 | Note F: too unreliable to be published |
| Home ownership | ||||||
| Owner without mortgage | 13,000 | 581,000 | Note F: too unreliable to be published | 20,000 | 1,009,300 | Note F: too unreliable to be published |
| Owner with mortgage | 20,000 | 415,100 | Note F: too unreliable to be published | 25,000 | 499,400 | 0.7 |
| Renter | 8,000 | 5,500 | 16.5 | 14,000 | 41,700 | 13.0 |
| Rural area | ||||||
| Not a rural area | 9,900 | 13,300 | 13.8 | 20,000 | 420,400 | 4.6 |
| Rural area | 11,000 | 67,700 | Note F: too unreliable to be published | 22,000 | 368,600 | 2.4 |
| CMA | ||||||
| Montreal | 9,900 | 7,000 | 17.4 | 13,000 | 318,700 | 3.2 |
| Ottawa-Gatineau | 15,000 | 14,500 | Note F: too unreliable to be published | 19,500 | 536,500 | Note F: too unreliable to be published |
| Toronto | 10,500 | 15,000 | Note F: too unreliable to be published | 20,800 | 671,900 | 5.2 |
| Calgary | 6,000 | 16,000 | Note F: too unreliable to be published | 27,000 | 413,800 | 7.6 |
| Vancouver | 17,000 | 39,800 | Note F: too unreliable to be published | 23,000 | 685,400 | 3.5 |
| Province | ||||||
| Newfoundland and Labrador | F | 3,700 | Note F: too unreliable to be published | 27,000 | 280,400 | Note F: too unreliable to be published |
| Prince Edward Island | F | F | Note F: too unreliable to be published | 21,000 | 257,000 | Note F: too unreliable to be published |
| Nova Scotia | 10,800 | 1,300 | Note F: too unreliable to be published | 20,300 | 311,800 | 7.4 |
| New Brunswick | 3,700 | 10,100 | Note F: too unreliable to be published | 23,500 | 199,100 | 4.3 |
| Quebec | 6,000 | 9,000 | 14.6 | 14,000 | 303,100 | 2.9 |
| Ontario | 10,000 | 14,500 | 11.2 | 21,000 | 548,900 | 5.2 |
| Manitoba | 2,000 | 25,300 | Note F: too unreliable to be published | 17,000 | 378,000 | Note F: too unreliable to be published |
| Saskatchewan | F | 49,400 | Note F: too unreliable to be published | 24,500 | 376,500 | Note F: too unreliable to be published |
| Alberta | 7,000 | 16,000 | 21.5 | 27,500 | 343,300 | 5.6 |
| British Columbia | 14,400 | 25,000 | 11.4 | 22,500 | 534,000 | 4.3 |
|
F too unreliable to be published Source: Statistics Canada, Survey of Financial Security, 2019. |
||||||
| Characteristics | All families | Poverty line | Sex of major income earner | ||
|---|---|---|---|---|---|
| Below | Above | Male | Female | ||
| predicted probabilities | |||||
| Sex | |||||
| Male (ref.) | 0.17 | 0.35 | 0.15 | Note ...: not applicable | Note ...: not applicable |
| Female | 0.19Note * | 0.36 | 0.16Note * | Note ...: not applicable | Note ...: not applicable |
| Highest level of education | |||||
| Less than a high school diploma (ref.) | 0.20 | 0.39 | 0.17 | 0.19 | 0.21 |
| High school diploma | 0.19 | 0.36 | 0.17 | 0.17 | 0.21 |
| Trades/college certificate | 0.19 | 0.38 | 0.17 | 0.16 | 0.23 |
| University degree | 0.15Note * | 0.28Note * | 0.13Note * | 0.13Note * | 0.17Note * |
| Economic family type | |||||
| Non-elderly couple without children (ref.) | 0.18 | 0.38 | 0.15 | 0.16 | 0.20 |
| Non-elderly couple with children | 0.24Note * | 0.49 | 0.20Note * | 0.21Note * | 0.29Note * |
| Female lone-parent | 0.28Note * | 0.39 | 0.26Note * | Note ...: not applicable | 0.31Note * |
| Male lone-parent | 0.24Note * | 0.54 | 0.19 | 0.21 | Note ...: not applicable |
| Other non-elderly families | 0.23Note * | 0.43 | 0.20Note * | 0.21Note * | 0.26Note * |
| Non-elderly not in economic families | 0.20Note * | 0.40 | 0.17 | 0.18 | 0.23 |
| Elderly families | 0.09Note * | 0.24Note * | 0.09Note * | 0.07Note * | 0.13Note * |
| Elderly not in economic families | 0.08Note * | 0.14Note * | 0.08Note * | 0.08Note * | 0.09Note * |
| Class of worker during the reference year | |||||
| Employee (ref.) | 0.18 | 0.31 | 0.16 | 0.15 | 0.21 |
| Self-employed | 0.14Note * | 0.31 | 0.11Note * | 0.13Note * | 0.15Note * |
| Employee and self-employed | 0.18 | 0.36 | 0.16 | 0.16 | 0.21 |
| Did not work | 0.19 | 0.39Note * | 0.15 | 0.18 | 0.21 |
| Racialized population group | |||||
| South Asian | 0.17 | 0.28 | 0.16 | 0.14 | 0.21 |
| Chinese | 0.17 | 0.28 | 0.17 | 0.17 | 0.18 |
| Black | 0.28Note * | 0.52Note * | 0.25Note * | 0.27Note * | 0.29Note * |
| Filipino | 0.23Note * | 0.14 | 0.23Note * | 0.22Note * | 0.26 |
| Arab | 0.16 | 0.24 | 0.15 | 0.17 | 0.15 |
| Latin American | 0.18 | 0.48 | 0.14 | 0.18 | 0.17 |
| Southeast Asian | 0.18 | 0.49 | 0.14 | 0.18 | 0.19 |
| Other racialized | 0.16 | 0.24 | 0.16 | 0.13 | 0.19 |
| Non-racialized non-Indigenous (ref.) | 0.17 | 0.36 | 0.15 | 0.15 | 0.20 |
| Indigenous people living off reserve | 0.24Note * | 0.39 | 0.23Note * | 0.21Note * | 0.29Note * |
| Major source of income | |||||
| Wages and salaries (ref.) | 0.16 | 0.28 | 0.14 | 0.15 | 0.17 |
| Self-employment income | 0.14 | 0.19 | 0.15 | 0.11 | 0.17 |
| Government transfers | 0.25Note * | 0.43Note * | 0.22Note * | 0.23Note * | 0.29Note * |
| Investment income | 0.09Note * | 0.13Note * | 0.09Note * | 0.08Note * | 0.09Note * |
| Private retirement pensions | 0.12Note * | 0.22 | 0.11Note * | 0.11Note * | 0.14 |
| Other income | 0.13 | 0.18 | 0.15 | 0.08Note * | 0.17 |
| Home ownership | |||||
| Owner without mortgage (ref.) | 0.11 | 0.23 | 0.10 | 0.10 | 0.14 |
| Owner with mortgage | 0.17Note * | 0.27 | 0.16Note * | 0.16Note * | 0.19Note * |
| Renter - non-subsidized housing | 0.21Note * | 0.39Note * | 0.19Note * | 0.19Note * | 0.24Note * |
| Renter - subsidized housing | 0.26Note * | 0.50Note * | 0.22Note * | 0.25Note * | 0.29Note * |
| CMA | |||||
| Montreal | 0.21 | 0.41 | 0.19 | 0.19 | 0.24 |
| Ottawa-Gatineau | 0.17 | 0.22Note * | 0.16 | 0.15 | 0.20 |
| Toronto (ref.) | 0.19 | 0.36 | 0.17 | 0.16 | 0.23 |
| Winnipeg | 0.17 | 0.28 | 0.15 | 0.14 | 0.22 |
| Calgary | 0.13Note * | 0.28 | 0.12Note * | 0.13 | 0.14Note * |
| Edmonton | 0.14Note * | 0.24 | 0.13 | 0.13 | 0.15Note * |
| Vancouver | 0.16 | 0.40 | 0.13Note * | 0.14 | 0.18 |
| Other CMA or CA | 0.18 | 0.36 | 0.16 | 0.16 | 0.21 |
| Province | |||||
| Newfoundland and Labrador | 0.22Note * | 0.41 | 0.19Note * | 0.20 | 0.25 |
| Prince Edward Island | 0.21 | 0.30 | 0.20Note * | 0.19 | 0.24 |
| Nova Scotia | 0.21 | 0.36 | 0.19Note * | 0.17 | 0.25Note * |
| New Brunswick | 0.22Note * | 0.35 | 0.20Note * | 0.20Note * | 0.24Note * |
| Quebec | 0.13Note * | 0.29 | 0.10Note * | 0.11Note * | 0.15Note * |
| Ontario (ref.) | 0.19 | 0.36 | 0.16 | 0.17 | 0.21 |
| Manitoba | 0.17 | 0.37 | 0.15 | 0.17 | 0.18 |
| Saskatchewan | 0.19 | 0.37 | 0.17 | 0.17 | 0.22 |
| Alberta | 0.26 | 0.44 | 0.24Note * | 0.24 | 0.29Note * |
| British Columbia | 0.19 | 0.34 | 0.17 | 0.16Note * | 0.24Note * |
| Income quintile | |||||
| Bottom (ref.) | 0.24 | 0.35 | 0.25 | 0.22 | 0.27 |
| Second | 0.22Note * | Note ...: not applicable | 0.21Note * | 0.20 | 0.24 |
| Third | 0.19Note * | Note ...: not applicable | 0.17Note * | 0.17Note * | 0.20Note * |
| Fourth | 0.14Note * | Note ...: not applicable | 0.12Note * | 0.13Note * | 0.15Note * |
| Top | 0.09Note * | Note ...: not applicable | 0.08Note * | 0.08Note * | 0.09Note * |
| Second to Top | Note ...: not applicable | 0.48 | Note ...: not applicable | Note ...: not applicable | Note ...: not applicable |
... not applicable
|
|||||
- Date modified: