
Income Research Paper Series
Canadian Income Survey: Food insecurity and unmet health care needs,
2018 and 2019
Skip to text
Text begins
1. Introduction
On August 21, 2018, the Government of Canada released Opportunity for All – Canada’s First Poverty Reduction Strategy, which contained long-term commitments to guide current and future government actions and investments to reduce poverty. In this poverty reduction strategy, three main pillars were identified, each containing a set of indicators that would be measured and monitored over time. This paper is about two of these indicators that can now be produced using the Canadian Income Survey: food insecurity and unmet health needs.
2. Food insecurity
Food insecurity was designated as one of four inter-related indicators in the Dignity pillar of Opportunity for All. Following the announcement of the Poverty Reduction Strategy, Statistics Canada introduced plans to create an annual national food insecurity measure to estimate the prevalence and track trends in household food insecurity over time. Food insecurity in Canada has previously been estimated by Statistics Canada using a range of surveys with varying strengths and limitations. These include the Canadian Community Health Survey (CCHS), the Longitudinal International Study of Adults (LISA), and the Aboriginal Peoples Survey. Beginning in 2019, for the reference year 2018, the Household Food Security Survey Module (HFSSM; see text boxNote ) was incorporated into the annual Canadian Income Survey (CIS).Note
What is the Household Food Security Survey Module?
The Household Food Security Survey Module (HFSSM) is Canada’s primary validated measure of food insecurity. It contains 18 questions designed to measure food insecurity resulting from limited financial resources. Based on a household’s experience, food insecurity can be categorized into 3 categories:
Marginal food insecurity: Worry about running out of food and/or limited food selection due to a lack of money for food.
Moderate food insecurity: Compromise in quality and/or quantity of food due to a lack of money for food.
Severe food insecurity: Miss meals, reduce food intake and, at the most extreme, go day(s) without food.
In this report, “food insecurity” refers to moderate or severe food insecurity.
2.1 Food insecurity results from the CIS
At present, household food insecurity data is available through the CIS for the 2018 and 2019 reference years.Note It should be noted that national estimates presented in this report do not include populations in the territories (please see Appendix Tables A2a and A2b for territorial food insecurity estimates).
In 2018, 11.5% of people lived in households that experienced moderate or severe food insecurity. This rate decreased to 10.6% in 2019. In 2019, 7.4% lived in moderately food insecure households, while 3.2% lived in severely food insecure households.
Food insecurity rates at the provincial level varied across Canada (see Table 1). Quebec had the lowest food insecurity rate in both 2018 (9.0%) and 2019 (7.1%). Quebec was also the only province where the food insecurity change between 2018 and 2019 was statistically significant, with a decrease of 1.9 percentage points. Nova Scotia had the highest food insecurity rate in both years, at 15.5% in 2018 and 13.0% in 2019. In 2019, Nova Scotia and Alberta had food insecurity rates significantly above the national average, while only Quebec had a rate significantly lower. In this report, differences with the national average are mentioned for 2019 if they are statistically significant at the 95% confidence level.
| Marginal food insecurity | Food insecurity (moderate or severe) | Moderate food insecurity | Severe food insecurity | |||||
|---|---|---|---|---|---|---|---|---|
| 2018 | 2019 | 2018 | 2019 | 2018 | 2019 | 2018 | 2019 | |
| Canada | 5.0 | 5.0 | 11.5 | 10.6Note * | 7.9 | 7.4 | 3.6 | 3.2 |
| Newfoundland and Labrador | 7.1 | 6.0 | 12.1 | 11.8 | 7.9 | 8.8 | 4.2 | 3.0 |
| Prince Edward Island | 4.7 | 5.2 | 11.5 | 12.7 | 7.2 | 8.8 | 4.3 | 4.0 |
| Nova Scotia | 5.7 | 5.8 | 15.5 | 13.0 | 9.5 | 8.4 | 6.0 | 4.6 |
| New Brunswick | 5.3 | 4.5 | 12.4 | 10.8 | 7.8 | 7.1 | 4.6 | 3.7 |
| Quebec | 4.9 | 3.5Note ** | 9.0 | 7.1Note ** | 6.9 | 5.2Note ** | 2.2 | 1.9 |
| Ontario | 5.0 | 5.8 | 11.5 | 11.2 | 8.1 | 7.7 | 3.4 | 3.5 |
| Manitoba | 5.6 | 5.4 | 13.5 | 12.1 | 8.4 | 8.5 | 5.0 | 3.6Note ** |
| Saskatchewan | 5.5 | 5.5 | 11.7 | 12.7 | 7.9 | 8.9 | 3.8 | 3.8 |
| Alberta | 5.1 | 5.6 | 14.3 | 12.8 | 8.4 | 9.0 | 5.9 | 3.8Note ** |
| British Columbia | 4.4 | 4.3 | 11.5 | 11.2 | 7.9 | 8.0 | 3.6 | 3.3 |
|
||||||||
In addition to regional differences, food insecurity also varied significantly across economic family types (Table 2). Food insecurity rates were lowest for persons in senior couples, at approximately 3% in both 2018 and 2019. In contrast, food insecurity rates were highest for persons in female lone-parent families, at about 33% for both years. In 2019, non-seniors not in an economic family and persons in lone-parent families had food insecurity rates significantly higher than the national average, while seniors not in an economic family, senior couples, and persons in non-senior couple families without children had food insecurity rates significantly lower than the national average.
| Marginal food insecurity | Food insecurity (moderate or severe) | Moderate food insecurity | Severe food insecurity | |||||
|---|---|---|---|---|---|---|---|---|
| 2018 | 2019 | 2018 | 2019 | 2018 | 2019 | 2018 | 2019 | |
| All persons | 5.0 | 5.0 | 11.5 | 10.6Note * | 7.9 | 7.4 | 3.6 | 3.2 |
| Persons in economic families | 5.1 | 5.0 | 10.7 | 9.8Note * | 7.8 | 7.2 | 2.9 | 2.6 |
| Persons in senior families | 2.6 | 2.8 | 4.4 | 4.9 | 2.9 | 3.5 | 1.5 | 1.3 |
| Persons in senior couples | 1.9 | 2.0 | 2.9 | 3.0 | 2.1 | 2.5 | 0.8 | 0.5 |
| Persons in other senior families | 4.4 | Note F: too unreliable to be published | 8.3 | 9.6 | 4.9 | 6.2 | Note F: too unreliable to be published | Note F: too unreliable to be published |
| Persons in non-senior families | 5.5 | 5.3 | 11.8 | 10.7Note * | 8.6 | 7.8Note * | 3.2 | 2.9 |
| Persons in couples | 3.9 | 3.7 | 7.2 | 7.2 | 4.6 | 4.9 | 2.6 | 2.2 |
| Persons in couple families with children | 6.5 | 6.5 | 11.3 | 9.7Note * | 8.9 | 7.7Note * | 2.3 | 2.0 |
| Persons in couple families with other relatives | 2.7 | 3.7 | 8.0 | 7.7 | 6.3 | 5.4 | 1.7 | 2.3 |
| Persons in lone-parent families | 9.0 | 7.4 | 31.9 | 30.9 | 20.8 | 20.4 | 11.0 | 10.4 |
| Persons in male lone-parent families | 7.1 | Note F: too unreliable to be published | 22.5 | 22.4 | 16.7 | 11.1 | 5.8 | Note F: too unreliable to be published |
| Persons in female lone-parent families | 9.4 | 7.3 | 33.6 | 33.0 | 21.6 | 22.8 | 12.0 | 10.2 |
| Persons in other non-senior families | 5.7 | 4.4 | 15.9 | 13.7 | 10.2 | 9.4 | 5.6 | 4.3 |
| Persons not in an economic family | 4.7 | 5.1 | 15.4 | 14.7 | 8.3 | 8.7 | 7.1 | 6.0Note ** |
| Seniors not in an economic family | 3.6 | 3.1 | 6.8 | 6.8 | 4.7 | 5.1 | 2.1 | 1.7 |
| Senior males not in an economic family | 3.4 | 2.6 | 9.2 | 7.2 | 6.0 | 5.2 | 3.2 | 2.0Note * |
| Senior females not in an economic family | 3.7 | 3.4 | 5.5 | 6.7 | 4.0 | 5.0 | 1.5 | 1.6 |
| Non-seniors not in an economic family | 5.2 | 6.1 | 19.2 | 18.3 | 9.9 | 10.3 | 9.3 | 8.0Note * |
| Non-senior males not in an economic family | 5.3 | 5.8 | 18.7 | 17.6 | 8.8 | 10.7 | 9.9 | 6.9Note ** |
| Non-senior females not in an economic family | 5.0 | 6.5 | 19.8 | 19.1 | 11.3 | 9.9 | 8.5 | 9.2 |
F too unreliable to be published
|
||||||||
As expected, food insecurity also varied substantially by income group, with those in the lowest income quintile reporting the highest food insecurity rates in both 2018 (26.7%) and 2019 (22.4%) reference years (Table 3). Notably, moderate and severe food insecurity rates for those in the lowest quintile decreased in 2019. Food insecurity was present to some degree in all quintiles, though less prevalent in the higher income groups.
| Marginal food insecurity | Food insecurity (moderate or severe) | Moderate food insecurity | Severe food insecurity | |||||
|---|---|---|---|---|---|---|---|---|
| 2018 | 2019 | 2018 | 2019 | 2018 | 2019 | 2018 | 2019 | |
| Total quintiles | 5.0 | 5.0 | 11.5 | 10.6Note * | 7.9 | 7.4 | 3.6 | 3.2 |
| Lowest quintile | 8.2 | 7.5 | 26.7 | 22.4Note ** | 16.9 | 14.5Note ** | 9.8 | 7.9Note ** |
| Second quintile | 6.9 | 6.6 | 14.3 | 13.2 | 10.3 | 9.4 | 4.0 | 3.8 |
| Third quintile | 5.0 | 5.3 | 8.5 | 8.9 | 6.7 | 6.8 | 1.9 | 2.0 |
| Fourth quintile | 3.1 | 4.3 | 5.5 | 5.5 | 3.8 | 4.2 | 1.7 | 1.3 |
| Highest quintile | 1.8 | 1.4 | 2.3 | 3.0 | 1.6 | 2.2 | 0.6 | Note F: too unreliable to be published |
F too unreliable to be published
Source: Canadian Income Survey, Statistics Canada. Custom tabulation. |
||||||||
Food insecurity also displayed variation across age groups. In 2019, individuals under the age 18 and those aged 25 to 44 had household food insecurity rates above the national average, while those aged 55 years and over had food insecurity rates below the average.Note
| Marginal food insecurity | Food insecurity (moderate or severe) | Moderate food insecurity | Severe food insecurity | |||||
|---|---|---|---|---|---|---|---|---|
| 2018 | 2019 | 2018 | 2019 | 2018 | 2019 | 2018 | 2019 | |
| All persons | 5.0 | 5.0 | 11.5 | 10.6Note * | 7.9 | 7.4 | 3.6 | 3.2 |
| Under 18 years old | 7.3 | 6.7 | 14.5 | 13.0 | 10.7 | 9.9 | 3.8 | 3.1 |
| Under 6 years old | 8.9 | 7.0Note * | 13.3 | 13.8 | 10.1 | 10.8 | 3.2 | 3.0 |
| 6 to 11 years old | 6.9 | 6.7 | 14.8 | 12.8 | 10.4 | 9.4 | 4.4 | 3.4 |
| 12 to 17 years old | 6.3 | 6.4 | 15.5 | 12.5Note ** | 11.7 | 9.5Note ** | 3.8 | 2.9 |
| 18 to 24 years old | 4.8 | 5.9 | 14.0 | 11.5Note ** | 9.8 | 7.9Note * | 4.2 | 3.6 |
| 25 to 34 years old | 5.2 | 5.2 | 12.5 | 12.7 | 8.3 | 8.3 | 4.3 | 4.4 |
| 35 to 44 years old | 6.2 | 6.4 | 12.9 | 13.4 | 8.3 | 9.6Note * | 4.6 | 3.9 |
| 45 to 54 years old | 4.4 | 4.7 | 13.0 | 10.2Note ** | 8.7 | 6.9Note ** | 4.3 | 3.3Note ** |
| 55 to 64 years old | 3.6 | 3.5 | 10.0 | 9.2 | 6.7 | 5.7 | 3.3 | 3.4 |
| 65 years old and over | 3.0 | 2.8 | 4.8 | 5.0 | 3.3 | 3.8 | 1.4 | 1.2 |
|
||||||||
Finally, Indigenous peoples, recent immigrants and persons with a disability were more likely to face food insecurity than the overall population aged 16 years and over.Note In 2019, the proportion of Indigenous people with moderate or severe food insecurity was more than double that of the overall population. Recent immigrants and persons with a disability also had food insecurity rates significantly higher than the overall population.
| Marginal food insecurity | Food insecurity (moderate or severe) | Moderate food insecurity | Severe food insecurity | |||||
|---|---|---|---|---|---|---|---|---|
| 2018 | 2019 | 2018 | 2019 | 2018 | 2019 | 2018 | 2019 | |
| Persons aged 16 years and over | 4.5 | 4.6 | 10.8 | 10.0Note * | 7.3 | 6.9 | 3.6 | 3.2Note * |
| Indigenous peoples living off reserve | 5.1 | 6.1 | 22.5 | 22.1 | 12.4 | 14.0 | 10.1 | 8.1 |
| Recent immigrants (10 years or less) | 8.3 | 9.7 | 13.2 | 15.4 | 10.5 | 13.4 | 2.7 | 2.0 |
| Persons with a disability | 6.4 | 6.1 | 21.1 | 17.5Note ** | 12.7 | 10.8Note ** | 8.4 | 6.7Note ** |
|
||||||||
2.2 Comparing CIS and CCHS food insecurity estimates
Estimates of food insecurity for Canada’s Official Poverty Dashboard were originally drawn from the CCHS.Note Beginning with the release of CIS 2020 estimates, these figures will be updated with annual estimates from the CIS. Initial results from the CIS indicate differences in the rate of food insecurity compared to the CCHS. For the 2017/2018 reference period, the CCHS estimated the rate of households with moderate or severe food insecurity to be 8.7% (Figure 1). For the 2018 reference year, the corresponding CIS estimate was 11.8%.Note While both surveys use the same Household Food Security Survey Module questions, there are a number of differences between the surveys that may help data users understand the differences in the estimates.Note
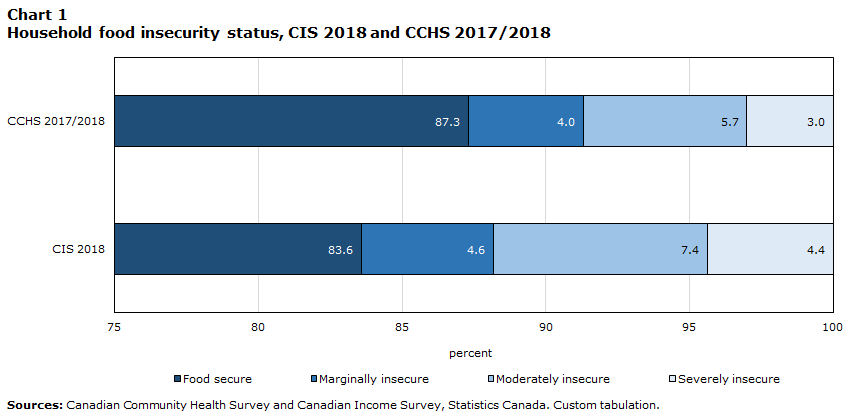
Data table for Chart 1
| Food secure | Marginally insecure | Moderately insecure | Severely insecure | |
|---|---|---|---|---|
| CIS 2018 | 83.6 | 4.6 | 7.4 | 4.4 |
| CCHS 2017/2018 | 87.3 | 4.0 | 5.7 | 3.0 |
| Sources: Canadian Community Health Survey and Canadian Income Survey, Statistics Canada. Custom tabulation. | ||||
Population weight calibration. The CIS, as an income survey, calibrates its sample weights to the T4 population totals for wages and salaries collected by the Canada Revenue Agency. This is to ensure that the weighted distribution of income (based on wages and salaries) in the data matches that of the Canadian population. Removal of the wages and salaries calibration for the 2018 CIS reference year results in a slight decrease in the rate of household food insecurity (decrease from 11.8% to 11.1%); however, this estimate still does not align with the estimate produced by the CCHS (8.7%). Although this factor appears to contribute to the gap between the survey estimates for the CIS and the CCHS, it does not account for the majority of this difference.
Imputation effects. An additional factor that could influence the estimates obtained across the surveys is the use of an imputation strategy to address missing responses in the CIS data. For 2017/2018, CCHS employed no such strategy and missing values were coded to a separate ‘Not stated’ category. In reference year 2018 CIS, one or more food security question values were imputed for approximately 4.5% of all records. In these instances, all existing responses for each household were retained and any missing values were imputed using a nearest neighbor approach. To assess the impact of this factor, separate food insecurity rates were estimated using the reference year 2018 CIS data, but excluding any records where food security responses had been imputed. This modification resulted in another slight decrease in the household food insecurity rate, from 11.8% to 11.3%.
Survey response rate effects. While both the CIS and the CCHS are voluntary surveys, the CIS is a supplement of the mandatory Labour Force Survey and typically benefits from higher response rates than many other voluntary surveys. In 2018, the response rate for the CIS was 77.4%. This can be compared to the CCHS response rate of 61.5% for 2017/2018. The CIS and the CCHS also adopt two distinct approaches to adjusting for survey non-responseNote which could contribute to variations in food insecurity rates across the two surveys, though the extent of this impact is difficult to measure.
Other variations across surveys. In addition to the factors mentioned above, there are several other differences that could impact the results obtained. These include potential effects due to the framing of the food insecurity questions in an income/labour-oriented survey versus a health-oriented survey, the sampling strategies employed, collection mode differences (a portion of the CIS respondents complete the survey on-line) and the specific collection period of the surveys.Note However, the presence or extent of the impact associated with these additional factors is difficult to isolate and assess.
3. Unmet health care needs
“Unmet health needs” was also designated as one of the four inter-related indicators in the Dignity pillar of Opportunity for All. In addition to the food security module, an unmet health care needs module was added to the CIS in 2019, for the reference year 2018. As with food insecurity estimates, unmet health care needs data for reference years 2018 and 2019 are now available.
What is the unmet health care needs module?
The question that determines whether a person had unmet health needs is: “During the past 12 months, was there ever a time when you felt that you needed health care, other than homecare services, but you did not receive it?” Those who answer “Yes” are asked subsequent questions such as the reason(s) and the type(s) of care needed.
This module is only asked of one person randomly selected among persons aged 16 years and over in each CIS household.
3.1 Unmet health care needs results from the CIS
In 2018, 1.5 million Canadians aged 16 years and over (5.1%) reported not receiving health care when they perceived needing it. This number rose to 1.8 million in 2019, representing 6.0% of the population aged 16 and over.Note
Both 2018 and 2019 CIS data indicate a difference in the rate of unmet health care needs by gender. In 2018, the rate of unmet health care needs was 4.6% among males and 5.6% among females. In 2019, these rates were 5.2% and 6.8%, respectively.
| 2018 | 2019 | 2018 | 2019 | ||
|---|---|---|---|---|---|
| number of persons (in thousands) | percentage | ||||
| Both sexes | All age groups | 1,546 | 1,839Note ** | 5.1 | 6.0Note ** |
| 16 to 24 years | 163 | 155 | 4.1 | 3.9 | |
| 25 to 34 years | 299 | 395Note ** | 5.9 | 7.6Note ** | |
| 35 to 44 years | 278 | 327 | 5.7 | 6.5 | |
| 45 to 54 years | 264 | 282 | 5.5 | 6.0 | |
| 55 to 64 years | 294 | 315 | 5.8 | 6.1 | |
| 65 years and over | 247 | 364Note ** | 4.0 | 5.6Note ** | |
| Males | All age groups | 690 | 784Note * | 4.6 | 5.2 |
| 16 to 24 years | 71 | 38Note ** | 3.5 | 1.8Note ** | |
| 25 to 34 years | 125 | 177Note * | 4.9 | 6.8Note * | |
| 35 to 44 years | 134 | 154 | 5.5 | 6.2 | |
| 45 to 54 years | 110 | 129 | 4.6 | 5.5 | |
| 55 to 64 years | 156 | 131 | 6.1 | 5.1 | |
| 65 years and over | 95 | 156Note ** | 3.3 | 5.2Note ** | |
| Females | All age groups | 855 | 1,055Note ** | 5.6 | 6.8Note ** |
| 16 to 24 years | 92 | 117 | 4.7 | 6.0 | |
| 25 to 34 years | 175 | 219 | 6.8 | 8.4 | |
| 35 to 44 years | 144 | 174 | 5.8 | 6.9 | |
| 45 to 54 years | 154 | 153 | 6.4 | 6.5 | |
| 55 to 64 years | 139 | 183Note * | 5.4 | 7.0Note * | |
| 65 years and over | 152 | 209Note ** | 4.5 | 6.0Note ** | |
|
|||||
Between 2018 and 2019, persons aged 25 to 34 and those 65 years and over reported increases in their rate of unmet healthcare needs. In 2019, the proportion of persons aged 25 to 34 years with unmet health care needs was significantly higher than the national average, while the proportion for those aged 16 to 24 years was significantly lower.
Some differences in rates of unmet health care needs were also present across provinces. In 2019, the rate of unmet health care needs was significantly higher than the national average in Nova Scotia and Ontario, while it was significantly lower in Manitoba and Alberta.
| 2018 | 2019 | 2018 | 2019 | |
|---|---|---|---|---|
| number of persons (in thousands) | percentage | |||
| Canada | 1,546 | 1,839Note ** | 5.1 | 6.0Note ** |
| Newfoundland and Labrador | 25 | 23 | 5.8 | 5.3 |
| Prince Edward Island | 8 | 10 | 6.7 | 7.8 |
| Nova Scotia | 65 | 63 | 8.2 | 7.8 |
| New Brunswick | 35 | 37 | 5.6 | 5.9 |
| Quebec | 402 | 406 | 5.8 | 5.8 |
| Ontario | 547 | 803Note ** | 4.6 | 6.6Note ** |
| Manitoba | 42 | 48 | 4.1 | 4.7 |
| Saskatchewan | 41 | 44 | 4.7 | 5.0 |
| Alberta | 151 | 144 | 4.4 | 4.1 |
| British Columbia | 229 | 260 | 5.7 | 6.4 |
|
||||
Finally, as can be seen in Table 8, the percentage of people with unmet health care needs was significantly higher for certain at-risk groups. It was almost three times higher for persons with a disability than for the overall population aged 16 years and over. Indigenous peoples also reported higher rates than the overall population.
| 2018 | 2019 | |
|---|---|---|
| Persons aged 16 years and over | 5.1 | 6.0Note ** |
| Indigenous peoples living off reserve | 8.2 | 10.8 |
| Recent immigrants (10 years or less) | 3.5 | 5.2 |
| Persons with a disability | 14.3 | 16.2Note ** |
|
||
In addition to reporting whether unmet health care needs were present, respondents also indicated why those needs were unmet and the location where they attempted to access health care services. Among the reasons listed in 2019, long wait times were the most frequently reported (32% of those with unmet needs) followed by “care not available at the time required” (27%). In terms of the locations reported, 48% of respondents who identified having an unmet need reported attempting to receive care at a doctor’s office followed by ‘other’ locationsNote (17%), walk-in clinics (13%), and hospital outpatient clinics (12%).Note
3.2 Comparing CIS and CCHS unmet health care need estimates
As a result of the rotating mandatory content, the most recent national unmet health care needs data reported in the CCHS are for 2014. For that year, the overall percentage of unmet health care needs was 11.2% for persons aged 12 years and over. This represents a significant difference from the CIS estimates of 5.1% in 2018 and 6.0% in 2019 for persons aged 16 years and over. However, caution must be used when comparing these figures, as differences between the rates can most likely be explained by two main factors. First, the question asked in the 2014 CCHS questionnaire did not indicate to exclude homecare services, while subsequent versions of this question did. In addition, the CCHS underwent a significant redesign in 2015 resulting in a break in the comparability of data collected before and after that period.Note More recent figures from 2017/2018, available only for five provinces, indicate less difference from the CIS results.
| CCHSTable 9 Note 1 2014 | CCHSTable 9 Note 1 2017/2018 | CISTable 9 Note 2 2018 | CISTable 9 Note 2 2019 | |
|---|---|---|---|---|
| Canada | 11.2 | Note ..: not available for a specific reference period | 5.1 | 6.0 |
| Newfoundland and Labrador | 7.9 | Note ..: not available for a specific reference period | 5.8 | 5.3 |
| Prince Edward Island | 10.6 | Note ..: not available for a specific reference period | 6.7 | 7.8 |
| Nova Scotia | 10.0 | 6.2 | 8.2 | 7.8 |
| New Brunswick | 8.9 | 3.8 | 5.6 | 5.9 |
| Quebec | 14.1 | Note ..: not available for a specific reference period | 5.8 | 5.8 |
| Ontario | 10.3 | 5.8 | 4.6 | 6.6 |
| Manitoba | 10.3 | 3.4 | 4.1 | 4.7 |
| Saskatchewan | 7.4 | Note ..: not available for a specific reference period | 4.7 | 5.0 |
| Alberta | 9.9 | 5.0 | 4.4 | 4.1 |
| British Columbia | 12.0 | Note ..: not available for a specific reference period | 5.7 | 6.4 |
.. not available for a specific reference period
|
||||
4. Conclusion
Food insecurity and unmet health care needs have both been identified as key indicators in Opportunity for All - Canada’s First Poverty Reduction Strategy. These indicators continue to be monitored through a range of sources and techniques. Differences across the surveys used to estimate food insecurity and unmet health care needs add some complexity to direct comparisons, but also allow each survey to offer their own unique perspective on the Canadian landscape. The CIS provides a valuable addition to the existing surveys measuring these concepts by providing stable national estimates, on an annual basis, in addition to a range of demographic and income data.
5. Appendix
| Marginal food insecurity | Food insecurity (moderate or severe) | Moderate food insecurity | Severe food insecurity | |||||
|---|---|---|---|---|---|---|---|---|
| Number of persons (x 1000) |
Percent | Number of persons (x 1000) |
Percent | Number of persons (x 1000) |
Percent | Number of persons (x 1000) |
Percent | |
| Canada | 1,823 | 5.0 | 4,162 | 11.5 | 2,853 | 7.9 | 1,310 | 3.6 |
| Newfoundland and Labrador | 36 | 7.1 | 62 | 12.1 | 41 | 7.9 | 22 | 4.2 |
| Prince Edward Island | 7 | 4.7 | 17 | 11.5 | 11 | 7.2 | 7 | 4.3 |
| Nova Scotia | 53 | 5.7 | 145 | 15.5 | 89 | 9.5 | 56 | 6.0 |
| New Brunswick | 39 | 5.3 | 92 | 12.4 | 58 | 7.8 | 34 | 4.6 |
| Quebec | 410 | 4.9 | 752 | 9.0 | 572 | 6.9 | 180 | 2.2 |
| Ontario | 720 | 5.0 | 1,636 | 11.5 | 1,154 | 8.1 | 482 | 3.4 |
| Manitoba | 70 | 5.6 | 170 | 13.5 | 106 | 8.4 | 63 | 5.0 |
| Saskatchewan | 60 | 5.5 | 127 | 11.7 | 86 | 7.9 | 41 | 3.8 |
| Alberta | 219 | 5.1 | 614 | 14.3 | 360 | 8.4 | 254 | 5.9 |
| British Columbia | 207 | 4.4 | 548 | 11.5 | 377 | 7.9 | 171 | 3.6 |
| Source: Canadian Income Survey, Statistics Canada. Table 13-10-0835-01 Food insecurity by age group and sex | ||||||||
| Marginal food insecurity | Food insecurity (moderate or severe) | Moderate food insecurity | Severe food insecurity | |||||
|---|---|---|---|---|---|---|---|---|
| Number of persons (x 1000) |
Percent | Number of persons (x 1000) |
Percent | Number of persons (x 1000) |
Percent | Number of persons (x 1000) |
Percent | |
| Canada | 1,841 | 5.0 | 3,904 | 10.6 | 2,735 | 7.4 | 1,169 | 3.2 |
| Newfoundland and Labrador | 31 | 6.0 | 60 | 11.8 | 45 | 8.8 | 15 | 3.0 |
| Prince Edward Island | 8 | 5.2 | 20 | 12.7 | 14 | 8.8 | 6 | 4.0 |
| Nova Scotia | 55 | 5.8 | 123 | 13.0 | 79 | 8.4 | 44 | 4.6 |
| New Brunswick | 34 | 4.5 | 80 | 10.8 | 53 | 7.1 | 28 | 3.7 |
| Quebec | 292 | 3.5 | 600 | 7.1 | 439 | 5.2 | 161 | 1.9 |
| Ontario | 840 | 5.8 | 1,624 | 11.2 | 1,122 | 7.7 | 502 | 3.5 |
| Manitoba | 70 | 5.4 | 154 | 12.1 | 109 | 8.5 | 45 | 3.6 |
| Saskatchewan | 60 | 5.5 | 140 | 12.7 | 98 | 8.9 | 42 | 3.8 |
| Alberta | 244 | 5.6 | 561 | 12.8 | 393 | 9.0 | 168 | 3.8 |
| British Columbia | 209 | 4.3 | 542 | 11.2 | 384 | 8.0 | 158 | 3.3 |
| Source: Canadian Income Survey, Statistics Canada. Table 13-10-0835-01 Food insecurity by age group and sex. | ||||||||
| Marginal food insecurity | Food insecurity (moderate or severe) | Moderate food insecurity | Severe food insecurity | |||||
|---|---|---|---|---|---|---|---|---|
| Number of persons | Percent | Number of persons | Percent | Number of persons | Percent | Number of persons | Percent | |
| All territories | 5,700 | 4.9 | 28,800 | 24.9 | 14,700 | 12.8 | 14,000 | 12.1 |
| Yukon | 1,500 | 4.0 | 4,600 | 12.2 | 3,800 | 10.0 | Note F: too unreliable to be published | Note F: too unreliable to be published |
| Northwest Territories | 2,300 | 5.4 | 8,500 | 20.2 | 3,900 | 9.1 | 4,700 | 11.1 |
| Nunavut | Note F: too unreliable to be published | Note F: too unreliable to be published | 15,600 | 44.1 | 7,100 | 20.1 | 8,500 | 24.1 |
|
F too unreliable to be published Source: Canadian Income Survey, Statistics Canada. Custom tabulation. |
||||||||
| Marginal food insecurity | Food insecurity (moderate or severe) | Moderate food insecurity | Severe food insecurity | |||||
|---|---|---|---|---|---|---|---|---|
| Number of persons | Percent | Number of persons | Percent | Number of persons | Percent | Number of persons | Percent | |
| All territories | 5,700 | 4.9 | 32,200 | 27.6 | 18,700 | 16.0 | 13,600 | 11.6 |
| Yukon | Note F: too unreliable to be published | Note F: too unreliable to be published | 6,000 | 15.3 | 4,000 | 10.3 | 2,000 | 5.0 |
| Northwest Territories | 2,700 | 6.4 | 9,800 | 23.1 | 6,500 | 15.4 | 3,300 | 7.7 |
| Nunavut | Note F: too unreliable to be published | Note F: too unreliable to be published | 16,500 | 46.1 | 8,100 | 22.8 | 8,300 | 23.3 |
|
F too unreliable to be published Source: Canadian Income Survey, Statistics Canada. Custom tabulation. |
||||||||
6. References
Employment and Social Development Canada, 2018. “Opportunity for All – Canada’s First Poverty Reduction Strategy”, Cat. No.: SSD-212-08-18E.
Statistics Canada. 2019. Questionnaire - Canadian Income Survey - 2019.
Tarasuk V, Mitchell A. (2020). Household food insecurity in Canada, 2017-18. Toronto: Research to identify policy options to reduce food insecurity (PROOF). Retrieved from https://proof.utoronto.ca/
- Date modified: