
Insights on Canadian Society
Education and earnings of Canadian-born Black populations
by Katherine Wall and Shane Wood

Skip to text
Text begins
Overview of the study
This study uses the 2021 Census to describe the educational attainment and earnings of the Canadian-born Black population, focusing on three groups: 1) those with at least one African-born parent (African-origin); 2) those with at least one Caribbean-born parent (Caribbean-origin) and 3) those whose parents were both born in Canada (Canadian-origin). Comparisons are drawn with the non-racialized, non-Indigenous population, both second generation and third generation or more. The study provides a descriptive analysis of the demographic and educational characteristics of the three Canadian-born Black populations, followed by a regression analysis examining factors affecting earnings, including educational attainment, job characteristics, and other factors.
- The educational attainment of Canadian-born Black populations differs considerably between groups. For example, the share with a bachelor’s degree or higher is 46% among the African-origin Black population, 27% among the Caribbean-origin Black population, and 16% among the Canadian-origin Black population.
- After taking age into account, all groups of Black men earn less than non-racialized third-generation or more men, with the largest earnings gap among Canadian-origin Black men (-$16,300) and the smallest among African-origin Black men (-$8,500). Canadian-origin (-$9,500) and Caribbean-origin (-$1,300) Black women likewise earn less than non-racialized third-generation or more women, while African-origin Black women earn more (+$3,100).
- For both women and men, differences in educational attainment are associated with approximately $8,000 in earnings difference between the African-origin and Canadian-origin Black populations, after controlling for other factors.
- Differences in educational attainment are associated with higher earnings among African-origin Black women (+$4,500) and men (+3,500), who have high educational attainment, and lower earnings among Canadian-origin Black women (-$3,800) and men (-$4,500), who have low educational attainment, relative to non-racialized third-generation or more populations of the same genders. Earnings differences related to educational attainment are smaller for Caribbean-origin Black women (+1,200) and men (-$400), whose educational attainment is more similar to that of the non-racialized third-generation or more population.
- Despite their diversity in terms of educational attainment and other characteristics, all Black groups experienced earnings gaps (ranging from $1,400 to $4,100) associated with working in lower-level occupations relative to their education and being less likely to have full time full year work, compared to the non-racialized third-generation or more population. Among African-origin men and Caribbean-origin women, the negative wage effect from these differences was larger than the positive effect from higher educational attainment.
- All Black groups also had earnings gaps (ranging from $2,900 to $8,300) that were not explained by any factors associated in the regression. Differences in pay between Black and non-racialized workers in the same occupations may be one factor in these differences. The unexplained effects were larger for Black men than Black women, across all three Black groups.
Acknowledgements
Many thanks to Dr. Carl James of York University and Dr. Malinda Smith of the University of Calgary for their expert advice on this article.
Introduction
Higher levels of education, particularly education completed in Canada, are typically associated with better employment conditions and higher earnings. However, despite the Canadian-born Black population aged 25 to 54 having similar educational attainment (29% with a bachelor’s degree or higher) to the Canadian-born non-racialized population (28%), they earn only $0.76 cents for every dollar earned by the latter. This is the second largest employment income disparity faced by Canadian-born members of any racialized group, with the largest being experienced by Latin Americans, who earn on average $0.71 cents for every dollar earned by the Canadian-born non-racialized population.
Previous research has demonstrated the socioeconomic disadvantages faced by the Canadian-born Black population, including both those with Canadian-born parents and those whose parents were born overseas.Note Their unemployment rates are higher and wages lower than the rest of the population, even after taking into account factors such as age, family composition, geography, language and education.Note Some of the wage differences are due to the lower likelihood of working full-time and to differences in occupations, but much of the difference remains unexplained, especially for Black men.Note These unexplained differences may be related to many factors that are difficult to measure; one possibility is different pay for workers in the same occupation.
Black workers are more likely to report facing discrimination or unfair treatment in the workplace.Note Both Canadian and American studies have found that employers are less likely to call back candidates with “racialized” names, or select them for interviews, compared to other candidates with the same qualifications.Note
Regression decomposition analysis can provide a clearer picture of the extent to which different factors are associated with the earnings disparities faced by Black populations. However, an additional complicating factor is the heterogeneity of the Black population, in terms of education and other characteristics. Even after differentiating between generations, there are further substantial differences between Black second-generation populations whose parents were born in different regions. In particular, those whose parents were born in Africa typically have higher educational attainment than those whose parents were born in the Caribbean.Note Thus, the association between wages and other factors may differ between Canadian-born Black populations.
For this reason, this paper analyzes three different Canadian-born Black populations: those with at least one parent born in Africa, those with at least one parent born in the Caribbean, and those with both parents born in Canada. Some historical context is valuable in understanding differences between these populations.
Large-scale Black immigration from Africa to Canada has mainly occurred in more recent years, rising from 16,000 people between 1980 and 1990 to 185,000 between 2011 and 2021, and the bulk of this recent immigration has been highly-educated economic immigrants. While these immigrants come from many different countries, those who are old enough to have Canadian-born children aged 25 or older (i.e., those who immigrated in the 1990s or before) are mainly from either eastern Africa (e.g. Ethiopia, Eritrea and Somalia), or anglophone countries in West Africa (e.g. Ghana and Nigeria).
Immigration from the Caribbean began earlier, largely from the late 1960s onwards, and has continued steadily since then. The two most common countries of origin for Black Caribbean immigrants have been Jamaica and Haiti. These immigrants, particularly prior to 2000, were typically lower-educated, and often came as domestic workers, or later as health care support workers.
The third-generation-or-more Black population in Canada includes descendants of long-standing Black communities in Nova Scotia and Ontario, originating from Loyalists who supported the British during the American Revolutionary War and later Americans who immigrated to Canada in the 1700s and 1800s. It also includes grandchildren of initial Caribbean immigrants from the late 1960s.
While the Canadian-born population on which this study focuses is a minority of the Black population (for example, it makes up 26% of those aged 25 to 54), it is growing rapidly. The Canadian-born Black population under age 25 is two and a half times as large as those aged 25 to 54. Understanding and addressing socioeconomic disparities faced by the Black population will therefore be important in helping to shape the future of Black children and youth.
The two key questions of this paper are how educational attainment differs between the three different Canadian-born Black populations, and how education along with other factors contributes to earnings differences between the different Black populations and between Black and non-Indigenous non-racialized populations. The first question is answered via a descriptive analysis that also covers some sociodemographic context on the different populations. The second is answered by a regression decomposition analysis that assesses the different factors related to wage disparities faced by the Black populations relative to the non-Indigenous non-racialized population (the latter is disaggregated into two groups that will hereafter be referred to as the non-racialized second-generation population and the non-racialized third-generation or more population). This will provide a clear picture of the ways in which these three Black populations differ, as well as both the differences and similarities in the types and sources of the challenges they face.
Descriptive analysis
All three Canadian-born Black populations are young and highly urbanized
To contextualize the findings on education and earnings, it is necessary to provide a short examination of the sociodemographic characteristics of the three Canadian-born Black populations aged 25 to 54 (core working age).
All three populations are considerably younger than non-racialized populations. This is especially the case with the African-origin Black population, nearly three-quarters (74%) of whom are aged 25 to 34 (Table 1). This is because most immigration from Africa to Canada occurred in the 1990s or after and as such, Canadian-born children of immigrants in the 1990s would mainly be in their 20s or early 30s in 2021. In comparison, immigration in substantial numbers from the Caribbean largely began in the late 1960s, so the Caribbean-origin Black population are comparatively older.
| Characteristics | Black population—Total | Black population—African-origin second generation | Black population—Caribbean-origin second generation | Black population– Canadian-origin (third generation or more) | Non-racialized population—All-origin second generation | Non-racialized population– Third generation or more |
|---|---|---|---|---|---|---|
| number | ||||||
| Population | 150,325 | 17,121 | 94,373 | 29,037 | 1,307,208 | 6,335,275 |
| percentage | ||||||
| Age | ||||||
| 25 to 34 years | 49.0 | 74.2 | 45.0 | 46.7 | 25.5 | 32.0 |
| 35 to 44 years | 32.4 | 19.9 | 36.4 | 28.4 | 33.4 | 34.1 |
| 45 to 54 years | 18.6 | 5.9 | 18.7 | 24.9 | 41.1 | 33.9 |
| Residence in a census metropolitan area or census agglomeration in 2020 | ||||||
| Census metropolitan area (CMA) | 94.3 | 97.4 | 97.0 | 84.6 | 83.6 | 65.9 |
| Census agglomeration (CA) | 2.9 | 1.4 | 1.4 | 8.0 | 7.2 | 13.4 |
| Not in a CMA or CA | 2.8 | 1.2 | 1.5 | 7.4 | 9.2 | 20.7 |
| Geography of residence in 2020 | ||||||
| Atlantic provinces | 4.6 | 1.2 | 0.6 | 20.3 | 2.6 | 10.0 |
| Montréal | 18.6 | 11.1 | 23.6 | 9.3 | 10.5 | 11.9 |
| Rest of QuebecTable 1 Note 1 | 1.1 | 1.9 | 0.9 | 1.5 | 1.7 | 16.3 |
| Ottawa–Gatineau | 4.9 | 11.3 | 4.2 | 3.6 | 4.0 | 4.5 |
| Toronto | 43.3 | 44.6 | 50.1 | 24.4 | 24.9 | 6.5 |
| Other CMAs in Ontario | 12.4 | 8.2 | 11.1 | 16.5 | 19.3 | 12.5 |
| Ontario outside CMAs | 2.2 | 1.1 | 1.5 | 4.8 | 7.1 | 8.4 |
| Calgary | 2.4 | 4.2 | 1.6 | 3.0 | 4.1 | 3.8 |
| Edmonton | 2.8 | 6.8 | 1.7 | 3.7 | 3.6 | 3.9 |
| Vancouver | 3.2 | 4.7 | 2.0 | 4.1 | 7.4 | 3.7 |
| Other CMAs in western provinces | 3.0 | 4.0 | 1.9 | 5.0 | 7.6 | 7.8 |
| Western provinces outside CMAs | 1.5 | 0.9 | 0.7 | 3.6 | 7.3 | 10.4 |
| Census family type | ||||||
| Couple without children | 10.8 | 10.4 | 9.5 | 13.6 | 17.6 | 19.9 |
| Couple with children | 23.8 | 15.8 | 24.8 | 25.1 | 47.4 | 45.2 |
| Parent in one-parent family | 13.1 | 4.9 | 13.5 | 16.8 | 6.4 | 7.5 |
| Living without other relatives | 9.2 | 3.3 | 9.4 | 12.5 | 5.4 | 6.5 |
| Living with other relatives | 3.9 | 1.5 | 4.1 | 4.3 | 1.0 | 1.0 |
| Child living with parent(s) | 27.8 | 42.7 | 29.6 | 15.3 | 11.2 | 7.7 |
| Child in couple family | 11.7 | 22.4 | 12.0 | 5.2 | 6.9 | 4.5 |
| Child in one-parent family | 16.2 | 20.3 | 17.6 | 10.1 | 4.3 | 3.2 |
| Not in a census family | 24.5 | 26.2 | 22.5 | 29.2 | 17.4 | 19.7 |
| Language spoken most often at home | ||||||
| English | 83.6 | 80.5 | 80.1 | 93.5 | 90.9 | 69.7 |
| French | 12.8 | 10.3 | 16.4 | 5.3 | 5.4 | 29.3 |
| English and French | 1.6 | 1.8 | 1.9 | 0.9 | 0.8 | 0.7 |
| Non-official language(s), or combination of official and non-official languages | 2.0 | 7.3 | 1.6 | 0.3 | 2.9 | 0.3 |
|
||||||
Second-generation populations are generally more urbanized than third-generation-or-more populations, and this was the case within both the Black population and the non-racialized population. However, within both generation categories, the Black population was more likely to live in Census Metropolitan Areas (CMAs) than the non-racialized population. In particular, over 95% of the African-origin and Caribbean-origin Black populations lived in CMAs, with half (50%) of the Caribbean-origin and 45% of the African-origin Black populations living in Toronto. Beyond Toronto, the African-origin population were more likely than the other Black groups to live in Ottawa-Gatineau or in western CMAs, while the Caribbean-origin population were more likely to live in Montreal. Nearly half of the Canadian-origin Black population lived in Ontario, and they were more likely than the other Black groups to live in areas of the province outside Toronto and Ottawa; another fifth lived in the Atlantic provinces, where Halifax has had a Black population for centuries.
These factors have implications for education and labour market outcomes. Younger and more urbanized populations tend to have higher educational attainment. Urbanized populations also tend to earn more than non-urban populations, in part due to the higher cost of living in cities, whereas younger populations generally earn less due to fewer years of work experience.
Living with parents more common among African-origin and Caribbean-origin Black populations
There were also notable differences in terms of family type, with African- and Caribbean-origin Black adults being more likely to live with their parents than other groups. Specifically, 43% of the African-origin and 30% of the Caribbean-origin Black populations were living with their parents (and were not in a couple and did not have children) (Table 1). This compares with 15% of the Canadian-origin Black population, 11% of the non-racialized second-generation population and 8% of the non-racialized Canadian-origin population. The younger age of these Black populations did not explain all of the difference.
When age was taken into account, two patterns emerged for both Canadian-born Black populations and non-racialized populations. First, second-generation populations were more likely to live with their parents than third-generation-or-more populations. Second, within generations, Black populations were more likely to live with their parents than non-racialized populations. For example, at age 30, 44% of the African-origin and 38% of the Caribbean-origin Black populations were living with their parents, compared with 22% of the non-racialized second-generation population. Likewise, 17% of the Canadian-origin Black population were living with their parents at age 30, compared with 12% of the non-racialized third-generation or more population. These living patterns may be influenced by financial considerations (especially given the concentration of both the African-origin and Caribbean-origin population in Toronto, where housing costs are very high) or by non-financial assistance of children to parents or parents to children, as well as personal preferences. Among men, living with parents is typically associated with lower earnings, but it is more likely to be a consequence of low earnings (as it is cheaper to live with parents) rather than a cause.Note
Black populations were also more likely than the non-racialized population to live in one-parent families (either as a parent or a child), at one-quarter or more for each Black group (31% of the Caribbean-origin population, 27% of the Canadian-origin population, and 25% of the African-origin population), compared with 11% for non-racialized populations. In the African-origin and Caribbean-origin Black populations, which are younger than the other populations analyzed here, the majority of people living in one-parent families were adult children living with their parent.
Educational qualifications differed sharply between Black groups, with education highest among the African-origin Black population and lowest among the Canadian-origin Black population
When viewed at a high level, the share of the Canadian-born Black population aged 25 to 54 who have a bachelor’s degree or higher (29%) appears similar to the share for the non-racialized population in the same age group (28%).Note However, as discussed in a previous study, such comparisons conceal major differences between Black groups. The African-origin Black population were the most likely to have a bachelor’s degree or higher, at 46%, compared with 27% among the Caribbean-origin Black population and 16% among the Canadian-origin Black population (Chart 1). This pattern was also seen for other educational characteristics, including rates of completing high school, and rates of completing any postsecondary credential (trades, college or university).

Data table for Chart 1
| Population group | With high school diploma or equivalency certificate | With any postsecondary certificate, diploma or degree | With bachelor's degree or higher |
|---|---|---|---|
| percent | |||
| Black population—African-origin second generation | 95.8 | 72.6 | 46.4 |
| Non-racialized population—Second generation | 92.9 | 71.2 | 35.6 |
| Black population—Caribbean-origin second generation | 92.6 | 66.9 | 27.4 |
| Non-racialized population—Third generation or more | 89.2 | 67.2 | 26.9 |
| Black population—Canadian-origin (third generation or more) | 86.1 | 49.7 | 15.9 |
| Source: Statistics Canada, Census of Population, 2021. | |||
Compared with Canadian-origin populations, second-generation populations, both Black and non-racialized, tend to have higher educational attainment for all three measures: completing high school, a postsecondary credential, and a bachelor’s degree or higher. Contributing factors include the high educational attainment of their immigrant parents and the high expectations for their educational attainment held by both their parents and the individuals themselves.Note
However, there were further differences. Among second-generation populations, the African-origin Black population was more educated on all three metrics than the non-racialized population,Note while the Caribbean-origin population was less so. In fact, the Caribbean-origin Black population had educational characteristics similar to the non-racialized third-generation or more population. Additionally, when comparing Canadian-origin populations, the Black population had notably lower education levels than the non-racialized population. They were 17 percentage points less likely to have any postsecondary credential, a gap which was mostly due to their lower likelihood (by 11 percentage points) of having a bachelor’s degree or higher.
These findings are consistent with other research, both at the national level and focused on Toronto specifically, that shows high educational attainment among both African-origin populations and their African-immigrant parents.Note A study (using data from 2008-2011) on high schools and selected universities in Toronto also found that some of the largest gaps between Black and non-Black students were faced by Black children and youth with Canadian-born parents.
For many Black students, there is a disconnect between their aspirations and their expectations. The 2016 General Social Survey found that 94% of Black youth aged 15 to 25 wanted to obtain a bachelor’s degree or higher, a larger share than among the non-Black population (82%); but in contrast, 60% expected that they would do so, compared with 79% of non-Black youth.Note Some research on Toronto’s largest school board found that instructors and educational counsellors disproportionately guided Black high school students, regardless of academic standing, towards courses that did not fit the prerequisites for university.Note
African-origin second-generation women had particularly high levels of education
Over half (57%) of African-origin Black women had a bachelor’s degree or higher, 16 percentage points higher than non-racialized second-generation women and 25 percentage points higher than non-racialized third generation or more women (Chart 2). In comparison, 36% of African-origin Black men had a bachelor’s degree or higher, 6 percentage points higher than non-racialized second-generation men and 15 percentage points higher than non-racialized third-generation or more men.

Data table for Chart 2
| Population group | Women | Men |
|---|---|---|
| percent | ||
| Black population—African-origin second generation | 57.3 | 36.1 |
| Non-racialized population—Second generation | 41.7 | 29.7 |
| Black population—Caribbean-origin second generation | 35.3 | 19.7 |
| Non-racialized population—Third generation or more | 32.7 | 21.2 |
| Black population—Canadian-origin (third generation or more) | 19.4 | 12.4 |
| Source: Statistics Canada, Census of Population, 2021. | ||
The share of the Caribbean-origin Black population with a bachelor’s degree or higher was lower than for the non-racialized second-generation population, but the gap was smaller among women (6 percentage points) than men (10 percentage points). And while Caribbean-origin Black women were slightly more likely than non-racialized third-generation or more women to have a bachelor’s degree or higher, the opposite was true for men.
Regression analysis
When age was taken into account, all Black groups, except African-origin Black women, had lower earnings than their non-racialized third-generation-or-more counterparts
The second central question of this paper is: how large of a role do educational differences play in the wage differences between Black populations and the non-racialized third generation or more population, and what other factors contribute to these differences? How do the factors contributing to earnings differences vary between the second-generation Black populations and the non-racialized second-generation population? And how do relationships between education, other variables, and wages compare between the different Black groups? The non-racialized third-generation or more population is used as the reference population because it makes up the majority of Canada’s population and provides a common point of comparison. Earnings measured in this section are wages, and persons with self-employment income are excluded.
Before controlling for any other factors, all three Black populations, for both women and men, earned less on average than the non-racialized third-generation or more population. The size of the earnings gaps ranged from $3,400 among Caribbean-origin Black women to nearly $20,000 among Canadian-origin Black men (Table 2).
One important factor in the earnings differences was that the African- and Caribbean-origin Black populations, especially the African-origin population, were younger than the reference population. After adjusting for age,Note African-origin Black women earned approximately $3,100 more than women in the reference population. This could be explained by the higher education attainment of African-origin Black women, as discussed above. However, non-racialized second-generation women earned $5,900 more than women in the reference population (after adjusting for age), despite not being as highly educated as African-origin Black women.
For all other Black populations, earnings, after adjusting for age, were still significantly lower than those of the reference population. The size of the earnings gap was largest for Canadian-origin Black men ($16,300), followed by Caribbean-origin Black men ($13,800).
| Population group | Population of interest | Reference population (age-adjusted to match population of interest) | Reference population (non-racialized third generation or more population) | Difference from earnings of age-adjusted reference population | Difference from earnings of unadjusted reference population |
|---|---|---|---|---|---|
| dollars | |||||
| Women | |||||
| Black population—African-origin second generation | 50,519 | 47,464 | 54,908 | 3,055 | -4,389 |
| Black population—Caribbean-origin second generation | 51,475 | 52,763 | 54,908 | -1,288 | -3,433 |
| Black population—Canadian-origin (third generation or more) | 43,220 | 52,735 | 54,908 | -9,515 | -11,688 |
| Non-racialized population—Second generation | 61,873 | 55,962 | 54,908 | 5,911 | 6,965 |
| Men | |||||
| Black population—African-origin second generation | 51,144 | 59,645 | 69,165 | -8,501 | -18,021 |
| Black population—Caribbean-origin second generation | 52,804 | 66,631 | 69,165 | -13,827 | -16,361 |
| Black population—Canadian-origin (third generation or more) | 49,297 | 65,584 | 69,165 | -16,287 | -19,868 |
| Non-racialized population—Second generation | 77,539 | 70,626 | 69,165 | 6,913 | 8,374 |
|
Note: In all cases, the differences between the average earnings of the population of interest and those of the age-adjusted reference population are statistically significant at p < 0.001. Source: Statistics Canada, Census of Population, 2021. |
|||||
Differences in educational attainment played a large role in wage differences between Black populations
Black populations had, in addition to age differences, substantial sociodemographic differences both from each other and from the reference population, which may explain some of the earnings gaps. An Oaxaca decomposition was used to analyze the extent to which differences in geography, family status, language spoken most often at home, educational attainment, major field of study, work activity, occupation, and union membership and participation in a registered pension plan (RPP) could explain the earnings gaps.
The populations were age-adjusted prior to carrying out the decomposition analysis, so that age itself was not a factor in the decomposition. This was done to enable a clearer comparison between populations. It is known that the age structures of the populations differ substantially, and that other variables, such as family type and educational attainment, differ with age.
The key question remains: how do the associations between population characteristics and wages differ between populations after these age differences have been taken into account? The regression does interact age with educational attainment, because the association between educational attainment and wages changes substantially with age (i.e. people with higher educational attainment tend to see larger wage gains as they age).
In Chart 3, the wage differences from the reference population given in Table 2 are represented by the red circles. The contributions of the different regression variables to these wage differences are represented by the bars, with the sum of the positive and negative bars for a group being equal to the amount shown by the red circle.
Higher educational attainment is associated with higher wages, and this was reflected in the results of the decomposition analysis. The bulk of the earnings differences associated with educational attainment were associated with the share of the population with a bachelor’s degree or higher. Being less likely to have a postsecondary credential below the bachelor level (e.g. a college or trades certificate or diploma) was also a factor for lower wages among Canadian-origin Black men.
African-origin Black women and men had higher earnings given the larger share holding a bachelor’s degree or higher. Meanwhile, Canadian-origin Black women and men had lower earnings attributable to their lower educational attainment. The results for Caribbean-origin Black women and men also followed the expected patterns based on educational attainment, with higher earnings for Caribbean-origin women and lower earnings for men.
The magnitude of these education-associated earnings differences from the reference population ranged from $4,500 higher among African-origin Black women, to $4,500 lower among Canadian-origin Black men (Chart 3). Among each of women and men, differences in educational attainment accounted for a difference of approximately $8,000 in annual wages between the highest-educated (African-origin) and lowest-educated (Canadian-origin) Black groups. The difference between the Caribbean-origin Black population and Canadian-origin Black population about $5,000 for women and $4,000 for men. Differences in educational attainment were the largest source of wage differences between different Black groups. However, there were other major factors associated with wage differences that were common to multiple Black groups.
As discussed previously, second-generation populations are usually more highly educated than third-generation or more (Canadian-origin) populations: this was also the case among the non-racialized population. The higher education of the non-racialized second-generation population was associated with higher wages than the non-racialized third-generation or more population, among both women (+$2,700) and men (+$2,300). However, this was smaller than education-related wage differences between Black second- and third-generation populations.
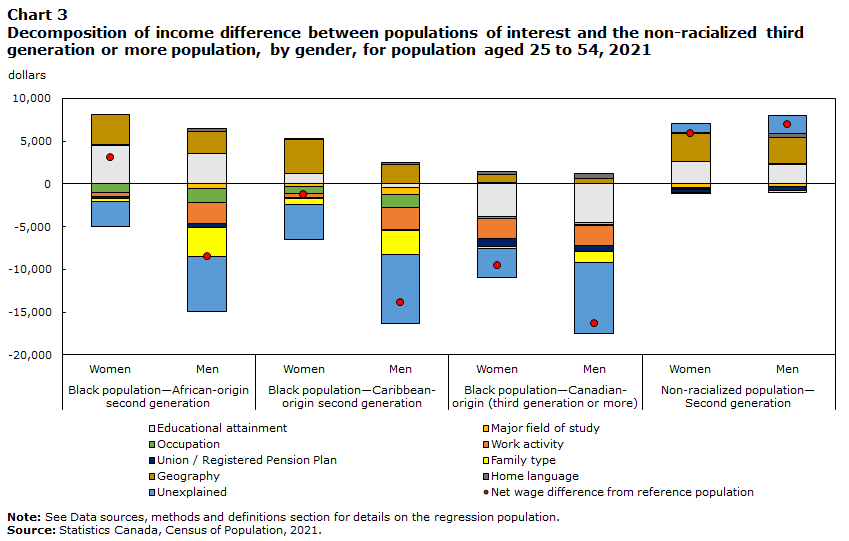
Data table for Chart 3
| Characteristics | Black population—African-origin second generation | Black population—Caribbean-origin second generation | Black population—Canadian-origin (third generation or more) | Non-racialized population—Second generation | ||||
|---|---|---|---|---|---|---|---|---|
| Women | Men | Women | Men | Women | Men | Women | Men | |
| dollars | ||||||||
| Educational attainment | 4,452 | 3,547 | 1,158 | -439 | -3,764 | -4,516 | 2,668 | 2,264 |
| Major field of study | 197 | -524 | -302 | -832 | 178 | -235 | -383 | -309 |
| Occupation | -1,012 | -1,650 | -851 | -1,474 | -244 | -114 | -179 | -18 |
| Work activity | -463 | -2,484 | -500 | -2,571 | -2,381 | -2,329 | -151 | 174 |
| Union / Registered Pension Plan | -203 | -494 | -115 | -92 | -895 | -683 | -304 | -397 |
| Family type | -390 | -3,312 | -626 | -2,831 | -312 | -1,344 | -145 | -305 |
| Geography | 3,409 | 2,621 | 3,978 | 2,261 | 968 | 682 | 3,171 | 3,041 |
| Home language | -15 | 285 | 101 | 230 | 338 | 519 | 201 | 425 |
| Unexplained | -2,920 | -6,490 | -4,132 | -8,079 | -3,403 | -8,268 | 1,034 | 2,039 |
| Net wage difference from reference population | 3,055 | -8,501 | -1,288 | -13,827 | -9,515 | -16,287 | 5,910 | 6,913 |
|
Note: See Data sources, methods and definitions section for details on the regression population. Source: Statistics Canada, Census of Population, 2021. |
||||||||
Higher incidence of overqualification and underemployment among Black populations contributed to earnings gaps
Despite the substantial differences between the three Black populations, all three of them were more likely than the non-racialized third-generation or more population to be in lower-skill occupations relative to their educational attainment, and/or to work in jobs that were part-time or part-year. In contrast, this was not substantively the case for the non-racialized second-generation population.
Variations in work activity (hours and weeks worked) and occupation were associated with earnings gaps, from the reference population, ranging from more than $4,000 among African- and Caribbean-origin Black men to around $1,400-$1,500 for African- and Caribbean-origin Black women, and broadly around $2,500 for Canadian-origin Black women and men (Chart 3). The largest wage differences attributable to being less likely to have full-time full-year work were among all three groups of Black men, as well as Canadian-origin Black women; the largest differences attributable to occupation were among African- and Caribbean-origin Black men.Note
For some Black groups, these differences counteracted in large part the gains from higher educational attainment. For example, higher educational attainment contributed approximately $1,200 to the earnings of Caribbean-origin Black women, relative to the non-racialized third-generation or more population, but lower earnings associated with differences in occupation and work activity (-$1,400) removed those gains. African-origin Black men had a wage advantage of $3,500 associated with higher educational attainment, but a wage shortfall of $4,100 associated with differences in occupation and work activity.
This may point to one reason, suggested in previous literature, for lower educational attainment among Black groups whose families have been in Canada longer. They may feel discouraged at seeing family members or peers obtain higher levels of education, yet have lower-quality jobs and lower earnings.Note
The occupation category of this regression decomposition is specifically calculated as the wage differences associated with differences in occupation between people with the same educational attainment.Note The impact of occupational differences on wages was larger for Black groups with higher levels of education (African- and Caribbean-origin), because the higher-education population who would be affected by these differences was larger. That said, in each of the three Black groups and for both genders, Black people with a bachelor’s degree or higher were 8 to 12 percentage points less likely than the reference population to work in professional occupations (those typically requiring a degree) or senior and specialized management positions,Note after adjusting for age.
African- and Caribbean-origin Black men with a postsecondary credential below the bachelor level were also 14 to 15 percentage points more likely than men in the reference population with the same education level to work in occupations typically requiring a high school diploma or less.Note For Caribbean-origin men, lower-level jobs among those with a postsecondary credential below the bachelor level made up more than half of the occupation effect.
A large portion of the wage difference between Black populations and the reference population could not be explained by the factors that were considered in the decomposition analysis
In each of the three Black groups, among both women and men, a large portion of the wage difference between Black populations and the reference population was unexplained. The unexplained portion was about twice as large among Black men (ranging from -$6,500 to -$8,300) as among Black women (-$2,900 to -$4,100) (Chart 3). This is relatively consistent across Black groups, both second-generation and third-generation-or-more, and is not observed among the non-racialized second-generation population (where there is a smaller positive unexplained effect). The existence of this negative effect across all Black groups, despite their differences in terms of other characteristics such as education, place of birth of parents and geography of residence in Canada, points to disadvantages experienced across the Black population.
One contributor to this could be Black workers receiving lower pay for the same work. As a broad illustration, 89% of Black male workers aged 25 to 64 worked in occupations where Black men had lower average wages than non-racialized men; for Black women the corresponding figure was 71%.Note This is consistent with the unexplained effect being larger for men than women. Other potential factors could include more granular differences in work activity and occupation than sample size allowed this article to examine (for example, exact hours worked per week).Note Analyses of wage gaps faced by Black populations using data from previous censuses found that occupational differences and wage gaps within occupations accounted for a large share of the overall wage gap.Note
It is important to note that large negative unexplained effects on wages are not unique to Black populations. Negative unexplained effects of similar magnitude were observed among Latin American and Filipino second-generation women and men. The causes of these unexplained effects are not necessarily the same across populations. Additional analyses of these populations in order to identify the sources of these effects are a valuable area for future research.
Among African-origin and Caribbean-origin women, there is an additional complexity to the unexplained effect. Based on the patterns that exist among the reference population (and all other analyzed populations of women and men except these two), people living in four of the largest cities in Canada – Toronto, Edmonton, Calgary and Vancouver – generally earned more than those living elsewhere.Note However, among African- and Caribbean-origin Black women, the wage advantages associated with living in some or all of these cities were much lower. Toronto played a particularly large role in this pattern, given the high share of the African- and Caribbean-origin Black populations who live in that city. In addition, people living in Montréal typically had lower wages than in most other CMAs, among all groups, and this association was larger among African- and Caribbean-origin Black women. These geographical patterns accounted for all of the unexplained effect for African-origin women and much of it for Caribbean-origin women,Note whereas they were not seen among other Black populations. This does not necessarily exclude the possibility that occupational differences or wage gaps within occupations play a role, if those factors manifest to a greater degree in certain geographical areas than others. The reasons for these patterns are an area for future analysis.
Another possible factor in these differences, and in the unexplained differences for other Black populations, could be differences in the areas of Toronto and other cities in which different populations live, as earnings may differ by area (e.g., downtown versus suburbs). The regression was not able to take this into account, but it is a potential area for future research.
Conclusion
The examination of education and earnings of Canadian-born Black populations reveals complex relationships. While the educational attainment of the Black population appears similar to that of the non-Indigenous non-racialized population, this disguises major differences in educational attainment between different Black groups. This paper specifically focuses on Black populations born in Canada. The African-origin Black population is the highest-educated; the Caribbean-origin Black population is the next-highest, with similar levels of education to the non-racialized third-generation or more population. The Canadian-origin Black population faces substantial education gaps. This highlights the importance of disaggregated analysis within specific racialized groups, since overall averages can obscure large variations.
Regression decomposition analyses showed that these educational differences are connected with wage differences of about $8,000 between the African-origin and Canadian-origin Black populations.
However, other factors were associated with lower wages among all the Black populations. Compared with the non-racialized third-generation-or-more population, all the Black populations were less likely to have a full-time full-year job and/or more likely to work in lower-level occupations related to their education attainment. These two factors were connected with wage gaps ranging from -$1,400 to -$4,100 among different Black populations. All the Black groups also faced addition wage gaps that were not explained by any of the factors included in the regression; the size of these unexplained wage gaps ranged from -$2,900 to -$4,100 among Black women, and -$6,500 to -$8,300 among Black men. These patterns were not observed among the second-generation non-racialized population. This indicates that though Black populations differ in educational attainment and other characteristics, they have important commonalities in terms of the challenges they face in the labour force.
Katherine Wall is an analyst with the Canadian Centre for Education Statistics at Statistics Canada and Shane Wood is an economic analyst at Statistics Canada.
Start of text boxData sources, methods and definitions
Data sources
The analysis uses data from the 2021 Census of Population. About one in four households in Canada completed the 2021 long-form census, providing information on a broad range of demographic, social and economic characteristics. The large number of observations and richness of the census data make them well-suited for studying population subgroups.
The analysis compares the Black populations to non-Indigenous non-racialized populations. It focuses on individuals meeting the following selection criteria: they were non-immigrants born in Canada, were aged 25 to 54 at the time of the 2021 Census and did not attend school between September 2020 and 11 May 2021. Those speaking an Indigenous language as their main language at home, and those living in the territories, were excluded from the regression as these populations were too small to be included in the analytical categories.
The analysis of earnings was further restricted to the population who had wages in 2020 and did not have self-employment income. Additionally, the top and bottom 2% of these observations sorted by wage income were excluded since these observations are often outliers. All dollar values in the text of the article are rounded to the nearest $100.
The weighted and unweighted sample sizes are as follows:
| Population group | Education analysis | Income analysis | ||||||
|---|---|---|---|---|---|---|---|---|
| Women | Men | Women | Men | |||||
| Count | Weighted count | Count | Weighted count | Count | Weighted count | Count | Weighted count | |
| Black population—African-origin second-generation | 1,948 | 8,271 | 2,075 | 8,850 | 1,296 | 5,494 | 1,214 | 5,187 |
| Black population—Caribbean-origin second-generation | 11,192 | 46,785 | 11,308 | 47,589 | 7,479 | 31,191 | 7,039 | 29,625 |
| Black population—Canadian-origin (third-generation or more) | 3,420 | 14,466 | 3,444 | 14,572 | 1,994 | 8,362 | 2,032 | 8,542 |
| Non-racialized population—Second-generation | 154,889 | 641,799 | 159,906 | 665,409 | 106,300 | 439,774 | 113,244 | 470,619 |
| Non-racialized population— Third-generation or more (reference population) | 748,607 | 3,100,072 | 775,370 | 3,235,203 | 517,657 | 2,138,357 | 565,091 | 2,350,766 |
| Source: Statistics Canada, Census of Population, 2021. | ||||||||
Methodology
For the Oaxaca (also called Kitagawa-Blinder-Oaxaca) decomposition, employment income was regressed on the following grouped categories: census family type, language spoken most often at home, work activity, major field of study (using the CIP 2021 STEM and BHASE variant, with ‘Business and related studies’ as the reference category), and the following composite variables:
- an age component which consists of age and age squared (note that the data are age-adjusted prior to the decomposition, so age has zero effect in the decomposition).
- educational attainment, which contains five categories (no certificate, diploma or degree; high school diploma or equivalency certificate; postsecondary certificate or diploma below bachelor level; bachelor’s degree; and university certificate, diploma or degree above bachelor level) and is interacted with the age component.
- occupation, which uses the NOC 2021 TEER categoryNote and is interacted with educational attainment. For each level of education, the most common NOC TEER category for that education level is used as the reference category.
- geography, which is composed of the 6 largest CMAs (Toronto, Montreal, Vancouver, Ottawa-Gatineau, Calgary and Edmonton), the Atlantic provinces, Quebec outside of these CMAs, other Ontario CMAs as a whole, other Western CMAs as a whole, Ontario outside of CMAs, and the Western provinces outside of CMAs. Groupings larger than the provincial level were necessary due to small Black populations in many areas outside of major cities.
- Union-RPP is composed of indicators of whether the person worked in a unionized job, had a workplace registered pension plan (RPP), or both.
Unless otherwise stated, all findings discussed in the regression analysis section is statistically significant at p=0.001 (i.e., 99.9% confidence).
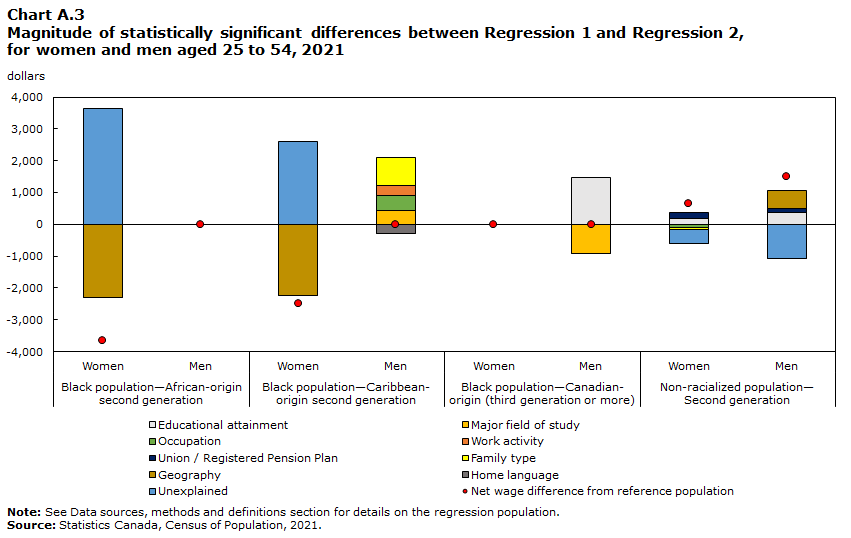
The regression operated on the assumption that the relationships between wages and the independent variables were the same for the three Black populations and the non-racialized second-generation population as they were for the reference population (the non-racialized third-generation or more population). As a robustness check, a second regression was run, in which the relationships between wages and the independent variables were treated as different for each population. Only one substantial difference was found, involving the relationship between geography and wages for African- and Caribbean-origin Black women, which was discussed in the regression results. A detailed comparison of the two regressions is provided in the appendix.
Oaxaca Decomposition – A Brief Description
The Oaxaca decomposition conducts a regression on the reference population to calculate the average effect of each independent variable on the outcome of interest (in this case, wages) for that population. Then, this effect is used to calculate what the expected difference in earnings would be given the differences in the population characteristics from one population to another. Anything not explained by this effect is considered unexplained.Note
As an example, suppose there are two populations, one making on average $1,500 and the other $1,550, and the only difference between the two populations is that the second one has 5 percentage points more people with a bachelor’s degree and 5 percentage points fewer people with a high school diploma as their highest level of education. If people with bachelor’s degrees made on average, after everything else is controlled for, $500 more than people with high school diplomas, then this would have an expected effect on the average income of the population of 5% X $500 = $25. So, of the $50 difference, $25 could be explained as due to the change in education, and $25 would be unexplained.
Definitions
African-origin Black population: Non-immigrant Black population born in Canada who have at least one parent born in Africa. Persons with one parent born in Africa and the other born in the Caribbean or Guyana are excluded.
Caribbean-origin Black population: Non-immigrant Black population born in Canada who have at least one parent born in the Caribbean or Guyana. Guyana is the only mainland Latin American country which is a substantial country of origin for Black immigrants, and has much in common culturally with Black Caribbean populations. Persons with one parent born in Africa and the other born in the Caribbean or Guyana are excluded.
Canadian-origin Black population: Black population born in Canada whose parents were also both born in Canada.
Second-generation population: Population born in Canada with at least one parent born outside Canada. Both the African-origin and Caribbean-origin Black populations are second-generation.
Third-generation or more: Population born in Canada with both parents also born in Canada. The Canadian-origin Black population is third-generation or more.
Appendix: Robustness check for regression analysis
The main regression for this article (Regression 1, or R1, in the charts below) operates on the assumption that the relationship between earnings and the independent variables is the same for the Black populations as for the reference population.
A second regression (Regression 2, or R2), used for a robustness check, does not use this assumption. Instead, for each population (African-origin Black women, Caribbean-origin Black men, etc.) it bases its decomposition on the relationship between earnings and the independent variables observed for that population. The advantage of this regression is that it takes into account that the relationships may not be the same for all groups. The disadvantage is that its estimations of the earnings of people in certain categories of the independent variables can be based on very small sample sizes, which can distort some results.
The two regressions are presented together here for more information both on areas where the findings are consistent between the two, and areas where the findings differ.
Note that the total differences in earnings between any target group and the reference population are the same across the two regressions The differences are only in the relative magnitude of the effects from the different independent variables in the decomposition.
Charts A.1 and A.2 give the regression results for women and men using the two different regression methods, while chart A.3 shows the magnitude of the differences between the two regressions for the variables where the two regressions’ findings are significantly different from each other at p=0.05 (95% confidence).

Data table for Chart A.1
| Characteristics | Black population—African-origin second generation | Black population—Caribbean-origin second generation | Black population—Canadian-origin (third generation or more) | Non-racialized population—Second generation | ||||
|---|---|---|---|---|---|---|---|---|
| R1 | R2 | R1 | R2 | R1 | R2 | R1 | R2 | |
| dollars | ||||||||
| Educational attainment | 4,452 | 3,440 | 1,158 | 898 | -3,764 | -3,164 | 2,668 | 2,864 |
| Major field of study | 197 | 724 | -302 | -130 | 178 | 363 | -383 | -370 |
| Occupation | -1,012 | -1,224 | -851 | -899 | -244 | -417 | -179 | -273 |
| Work activity | -463 | -585 | -500 | -527 | -2,381 | -1,970 | -151 | -173 |
| Union / Registered Pension Plan | -203 | -282 | -115 | -179 | -895 | -1,158 | -304 | -121 |
| Family type | -390 | -1,014 | -626 | -573 | -312 | -690 | -145 | -202 |
| Geography | 3,409 | 1,103 | 3,978 | 1,743 | 968 | -323 | 3,171 | 3,411 |
| Home language | -15 | 189 | 101 | -89 | 338 | 924 | 201 | 186 |
| Unexplained | -2,920 | 703 | -4,132 | -1,531 | -3,403 | -3,080 | 1,034 | 588 |
| Net wage difference from reference population | 3,055 | 3,055 | -1,288 | -1,288 | -9,515 | -9,515 | 5,910 | 5,910 |
|
Note: See Data sources, methods and definitions section for details on the regression population. Source: Statistics Canada, Census of Population, 2021. |
||||||||

Data table for Chart A.2
| Characteristics | Black population—African-origin second generation | Black population—Caribbean-origin second generation | Black population—Canadian-origin (third generation or more) | Non-racialized population—Second generation | ||||
|---|---|---|---|---|---|---|---|---|
| R1 | R2 | R1 | R2 | R1 | R2 | R1 | R2 | |
| dollars | ||||||||
| Educational attainment | 3547 | 4789 | -439 | -181 | -4516 | -3047 | 2264 | 2644 |
| Major field of study | -524 | 215 | -832 | -401 | -235 | -1167 | -309 | -314 |
| Occupation | -1650 | -2693 | -1474 | -1015 | -114 | -52 | -18 | 34 |
| Work activity | -2484 | -2275 | -2571 | -2251 | -2329 | -1869 | 174 | 254 |
| Union / Registered Pension Plan | -494 | -564 | -92 | -180 | -683 | -1087 | -397 | -275 |
| Family type | -3312 | -3720 | -2831 | -1929 | -1344 | -1087 | -305 | -330 |
| Geography | 2621 | 2618 | 2261 | 1400 | 682 | 618 | 3041 | 3595 |
| Home language | 285 | -68 | 230 | -64 | 519 | -289 | 425 | 328 |
| Unexplained | -6490 | -6803 | -8079 | -9207 | -8268 | -8307 | 2039 | 977 |
| Net wage difference from reference population | -8501 | -8501 | -13827 | -13827 | -16287 | -16287 | 6913 | 6913 |
|
Note: See Data sources, methods and definitions section for details on the regression population. Source: Statistics Canada, Census of Population, 2021. |
||||||||
Data table for Chart A.3
| Characteristics | Black population—African-origin second generation | Black population—Caribbean-origin second generation | Black population—Canadian-origin (third generation or more) | Non-racialized population—Second generation | ||||
|---|---|---|---|---|---|---|---|---|
| Women | Men | Women | Men | Women | Men | Women | Men | |
| dollars | ||||||||
| Educational attainment | 0 | 0 | 0 | 0 | 0 | 1,469 | 197 | 380 |
| Major field of study | 0 | 0 | 0 | 431 | 0 | -933 | 0 | 0 |
| Occupation | 0 | 0 | 0 | 460 | 0 | 0 | -94 | 0 |
| Work activity | 0 | 0 | 0 | 320 | 0 | 0 | 0 | 0 |
| Union / Registered Pension Plan | 0 | 0 | 0 | 0 | 0 | 0 | 183 | 122 |
| Family type | 0 | 0 | 0 | 903 | 0 | 0 | -57 | 0 |
| Geography | -2,305 | 0 | -2,235 | 0 | 0 | 0 | 0 | 554 |
| Home language | 0 | 0 | 0 | -293 | 0 | 0 | 0 | 0 |
| Unexplained | 3,624 | 0 | 2,600 | 0 | 0 | 0 | -446 | -1,062 |
| Net wage difference from reference population | -3,638 | 0 | -2,500 | 0 | 0 | 0 | 647 | 1,487 |
|
Note: See Data sources, methods and definitions section for details on the regression population. Source: Statistics Canada, Census of Population, 2021. |
||||||||
- Date modified: