
Insights on Canadian Society
Examining variations in immigrants’ lower risk of suicide-related behaviours
by Fei-Ju Yang, Linlu Zhao and Nicole Aitken

Text begins
Start of text box
Overview of the study
Using data from the Canadian Community Health Survey (CCHS) and the Canadian Census Health and Environment Cohort (CanCHEC), this article provides an understanding of suicide-related behaviours, namely suicide ideation and completed suicides, among immigrants. Overall, immigrants aged 15 years and older were less likely than their Canadian-born counterparts to report having had suicidal thoughts and were also less likely to die by suicide.
- Based on data from the CCHS, 1.5% of immigrants and 3% of the Canadian-born population reported having had suicidal thoughts in the past year. For both populations, having an anxiety or mood disorder was the strongest risk factor for suicide ideation.
- Youth (aged 15 to 24 years) reported having had the highest proportion of suicidal thoughts in the last year among both Immigrants and Canadian-born persons.
- The prevalence of suicide mortality was also lower among immigrants. After adjusting for differences in the age-structure of the immigrant and Canadian-born populations, the suicide rate was 7 per 100,000 person-years for immigrants, twice as low as the rate for the Canadian-born population at 14 per 100,000 person-years.
- Among immigrants, those born in Western Europe had the highest suicide mortality rate.
- While young, working aged and older immigrants were as likely to die by suicide, working-aged Canadian-born people were most likely to die by suicide.
- For immigrants and the Canadian-born population, males had a suicide mortality rate three times higher than that of females.
- Socioeconomic factors such as income and household level education did not have a consistent role in suicide-related behaviors among immigrants, while both factors had a unique impact on suicide ideation and suicide mortality among the Canadian-born population.
End of text box
If you are in distress, please contact your nearest crisis or distress centre. If it is an emergency, call 911 or go to your local emergency department. Suicide prevention resources are available at www.canada.ca/en/public-health/services/suicide-prevention.html
End of text boxIntroduction
Suicide is an ongoing public health concern in Canada and globally. Suicide-related behaviours exist on a spectrum of severity that includes suicide ideation (thoughts about taking action to end one’s life), attempted suicide (a potentially self-injurious behaviour associated with at least some intent to die), and completed suicide (a fatal self-injurious act with some evidence of intent to die).Note An estimated 11.8% of Canadians reported suicidal thoughts in their life, 2.5% had suicidal thoughts in the past year, and 3.1% made a suicide attempt in their lifetime. Relative to other causes of death, death by suicide is a relatively rare occurrence in Canada.Note Approximately 4,000 deaths by suicide occur in Canada every yearNote out of approximately 285,000 total annual deaths. Although death by suicide is a relatively rare occurrence, these suicides could have long-lasting impact on the family members of the deceased including grief and
Immigrants generally have a lower risk of suicide-related behaviours compared to non-immigrants in immigrant-receiving countries such as Canada.Note Long-term immigrants who have resided in Canada for more than 10 years typically have higher rates of suicide-related behaviours than recent immigrants, possibly as a result of prolonged exposure to post-migration-related stressors, including social isolation, discrimination, language barriers, and unemployment.Note
However, the immigrant population in Canada is not a homogeneous group, the origins of immigrants to Canada are increasingly diverse.Note When the heterogeneity of immigrant populations is considered, it becomes clear that certain immigrant populations are disproportionately affected by suicide-related behaviours. For instance, a Statistics Canada study found that suicide mortality rates for immigrants generally were lower compared with the Canadian-born population but suicide rates varied by birthplace. Those born in Europe and Oceania had suicide rates similar to that of the Canadian-born population and those born in Asia and Africa had the lowest rates.Note Country of origin analysis of immigrants living in Ontario also showed a wide range in suicide mortality rates.Note This variability among immigrants of different origins can be seen in other immigrant-receiving countries for risk of suicide ideation, attempted suicide, and completed suicide.Note Suicide-related behaviors are an interaction of pre-migration factors (e.g., home country’s investment in mental health services, religion, etc.) and post-migration factors (e.g., social support, linguistic acquisition, employment, access to health care in destination countries etc.).
It has been over 20 years since the last national release of disaggregated suicide risk by immigrant status in Canada. This national level analysis was performed using three-year combined death data centered around Census years 1991 and 1996.Note There is thus a need to conduct a disaggregated analysis using more contemporary data given the shifting patterns of country of origin of immigrants and socioeconomic and sociocultural changes over time. The purpose of this study is to provide estimates of rates of suicide ideation and suicide mortality of immigrants in Canada. Analogous analyses were conducted among Canadian-born individuals for reference. It is important to emphasize that within the Canadian-born population, there is much diversity, such as possible differences within and between racialized groups, as well as between Indigenous and non-Indigenous people.
Since national immigrant suicide-related behaviour has not been recently studied, the study aims to provide contextual information on groups in this population, particularly across life stages. Guided by the social determinants of health framework,Note the descriptive analysis disaggregates suicide-related behaviours by sociodemographic and socioeconomic factors, including age, sex,Note income, household level education; and for immigrants, time since migration and country of birth (see Data sources, methods and definitions). The impacts of these factors on suicide-related behaviours are investigated using regression modelling.
This study analyzes both suicide ideation and suicide mortality. To understand suicide ideation, the analysis used the 2015, 2016 and 2019 Canadian Community Health Survey (CCHS) pooled cohort. For the analysis of suicide mortality, the 2006 Canadian Census Health and Environment Cohort (CanCHEC) was used.Note
Text begins
Start of text box
Analysis of suicide ideation: Description of selected demographic, social and economic characteristics of the Canadian Community Health Survey study cohort (2015, 2016, 2019)
The analysis of suicide ideation is based on the CCHS pooled cohort aged 15 years and over living in the ten Canadian provinces, which contained 25,564 Canadian immigrants and 134,597 Canadian-born individuals. Using weights, this cohort is representative of approximately 7 million immigrants and 22 million Canadian-born individuals.
About a quarter of the immigrants in the CCHS study cohort were recent immigrants, who landed in Canada less than 10 years ago.Note The majority of immigrants came from Asia and Europe (45% and 28% respectively). Immigrants from Caribbean countries, South and Central America and Africa represent 22% of the immigrant population. Compared to the Canadian-born population, immigrants were older (91% being older than 25 years of age compared with 84% among the Canadian-born population) and more well-educated (85% vs 79% with a household member having a post-secondary degree). Additionally, 27% of the immigrants were in the lowest income quintile compared to 16% of the Canadian-born population.
| Selected Characteristics | Immigrant population | Canadian-born population |
|---|---|---|
| percent | ||
| Sex | ||
| Male | 49.2 | 49.4 |
| Female | 50.8 | 50.6 |
| Age group | ||
| 15 to 24 | 8.9 | 15.7 |
| 25 to 39 | 24.6 | 24.4 |
| 40 to 64 | 44.4 | 40.8 |
| 65 and over | 22.1 | 19.0 |
| Region of birth | ||
| Western Europe | 5.8 | Note ...: not applicable |
| North America excluding Canada | 3.5 | Note ...: not applicable |
| Caribbean countries, Central & South America, and Africa | 22.3 | Note ...: not applicable |
| Rest of Europe | 22.4 | Note ...: not applicable |
| Asia | 45.0 | Note ...: not applicable |
| Other countries | 1.0 | Note ...: not applicable |
| Time since migration | ||
| Recent | 26.1 | Note ...: not applicable |
| Long-term | 73.9 | Note ...: not applicable |
| Highest level of household education | ||
| Has a postsecondary degree | 84.9 | 78.5 |
| No postsecondary degree | 15.1 | 21.5 |
| Household income | ||
| Not in the lowest income quintile | 73.1 | 84.1 |
| In the lowest income quintile | 26.9 | 16.0 |
| Anxiety disorder | ||
| Yes | 4.6 | 10.3 |
| No | 95.4 | 89.7 |
| Mood disorder | ||
| Yes | 5.3 | 10.0 |
| no | 94.7 | 90.0 |
|
... not applicable Note: Data points might not add up to 100% due to rounding. Source: Statistics Canada, Canadian Community Health Survey, pooled 2015, 2016 and 2019. |
||
End of text box
In total, 1 in 16 Canadian immigrants had suicidal thoughts in their lifetime
Overall, 6% of Canadian immigrants experienced thoughts of suicide at some point in their lives. This was considerably lower than the 14% of Canadian-born persons who seriously considered suicide in their lifetime. Past-year suicide ideation was also less prevalent among immigrants (1.5%) than their Canadian-born counterparts (3.1%) (Chart 1).
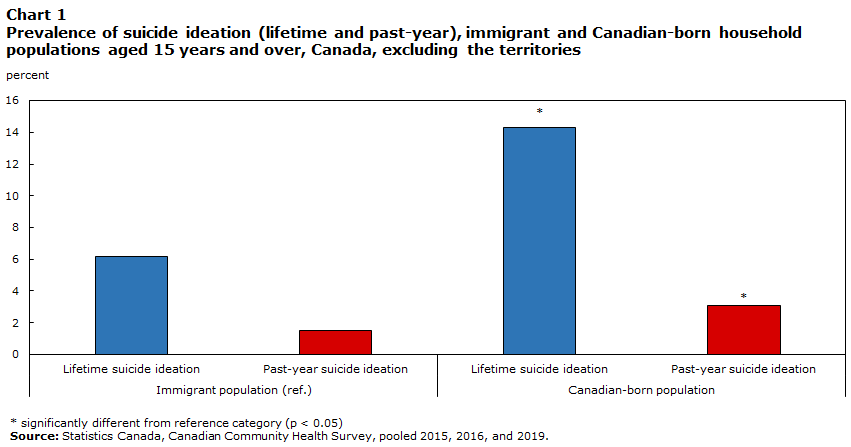
Data table for Chart 1
| Suicide ideation | Percent | |
|---|---|---|
| Immigrant population (ref.) | ||
| Lifetime suicide ideation | 6.2 | |
| Past-year suicide ideation | 1.5 | |
| Canadian-born population | ||
| Lifetime suicide ideation | 14.3Note * | |
| Past-year suicide ideation | 3.1Note * | |
|
||
To understand differences in suicide ideation within immigrant and Canadian-born populations, sociodemographic and socioeconomic characteristics were examined (Table 2).Note For immigrants, youth aged 15 to 24 years were the most likely to report past-year suicide ideation, with 4% reporting thoughts of suicide within the last year. This was more than 2.5 times the proportion reported for immigrants overall (1.5%). There were no significant differences by sex, region of birth, time since migration, household education and household income among immigrants.
For the Canadian-born population, youth also had the highest rate of past-year suicide ideation, at 6.5%. In addition, 3.6% of the 25-to-39-year-olds reported past-year suicide ideation, which was higher than the 2% among 40-to-64-year-olds. Unlike immigrants, there were differences across various other socio-demographic characteristics. A higher proportion of Canadian-born females (3.4%) reported past-year suicide ideation than Canadian-born males (2.7%). In addition, Canadian-born individuals from households with no post-secondary education, as well as households in the bottom income quintile reported higher past-year suicide ideation (3.9% and 6.2% respectively).
Additional comparisons between immigrants and the Canadian-born population indicates that for both sexes, the Canadian-born population had higher prevalence of past-year suicide ideation. In each age group, immigrants had lower prevalence of past-year suicide ideation than the Canadian-born population, except for older immigrants aged 65 years and older, for whom no significant difference between the two groups was found.
Anxiety or mood disorders were associated with suicide ideation among both immigrants and Canadian-born individuals
Having a diagnosed mood disorder or anxiety was associated with a higher prevalence of past-year suicide ideation for both Canadian immigrants and Canadian-born individuals. In general, the prevalence of anxiety and mood disorders is about 2 times greater among Canadian-born than immigrants (Appendix A). For immigrants with a mood disorder, such as depression, bipolar disorder, mania or dysthymia, 14% had past-year suicide ideation. Similar elevated levels were seen among immigrants with an anxiety disorder, with 11% having past-year suicide ideation. For Canadian-born individuals, the proportion with past-year suicide ideation was 18% for those diagnosed with mood disorders and 14% for those with anxiety disorders.
| Selected characteristics | Immigrant population | Canadian-born population | ||||
|---|---|---|---|---|---|---|
| percentage | 95% confidence interval | percentage | 95% confidence interval | |||
| from | to | from | to | |||
| Sex | ||||||
| Males (ref.) | 1.4Table 2 Note ‡ | 1.1 | 1.8 | 2.7 | 2.5 | 3.0 |
| Females | 1.7Table 2 Note ‡ | 1.3 | 2.1 | 3.4Note * | 3.1 | 3.6 |
| Age group | ||||||
| 15 to 24 | 4.4Note *Table 2 Note ‡ | 3.2 | 6.0 | 6.5Note * | 5.8 | 7.2 |
| 25 to 39 | 1.3Table 2 Note ‡ | 1.0 | 1.8 | 3.6Note * | 3.3 | 4.0 |
| 40 to 64 (ref.) | 1.2Table 2 Note ‡ | 0.9 | 1.6 | 2.3 | 2.1 | 2.5 |
| 65 and over | 1.2 | 0.9 | 1.8 | 1.0Note * | 0.9 | 1.8 |
| Region of birth | ||||||
| Western Europe (ref.) | 1.8 | 1.2 | 2.7 | Note ...: not applicable | Note ...: not applicable | Note ...: not applicable |
| North America excluding Canada | 2.8 | 1.8 | 4.4 | Note ...: not applicable | Note ...: not applicable | Note ...: not applicable |
| Caribbean countries, Central & South America, and Africa | 2.1 | 1.5 | 3.0 | Note ...: not applicable | Note ...: not applicable | Note ...: not applicable |
| Rest of Europe | 1.3 | 1.0 | 1.9 | Note ...: not applicable | Note ...: not applicable | Note ...: not applicable |
| Asia | 1.2 | 0.9 | 1.5 | Note ...: not applicable | Note ...: not applicable | Note ...: not applicable |
| Time since migration | ||||||
| Recent (ref.) | 1.2 | 0.9 | 1.7 | Note ...: not applicable | Note ...: not applicable | Note ...: not applicable |
| Long-term | 1.7 | 1.4 | 2.0 | Note ...: not applicable | Note ...: not applicable | Note ...: not applicable |
| Highest level of household education | ||||||
| Has a postsecondary degree (ref.) | 1.5 | 1.3 | 1.8 | 2.8 | 2.7 | 3.0 |
| No postsecondary degree | 1.7 | 1.2 | 2.3 | 3.9Note * | 3.5 | 4.3 |
| Household income | ||||||
| Not in the lowest quintile (ref.) | 1.7 | 1.3 | 2.2 | 2.5 | 2.3 | 2.6 |
| In the lowest quintile | 1.5 | 1.2 | 1.8 | 6.2Note * | 5.7 | 6.8 |
| Mood disorder | ||||||
| No (ref.) | 0.9 | 0.8 | 1.1 | 1.5 | 1.4 | 1.6 |
| Yes | 13.7Note * | 10.7 | 17.3 | 17.9Note * | 16.8 | 19.1 |
| Anxiety disorder | ||||||
| No (ref.) | 1.1 | 0.9 | 1.3 | 1.8 | 1.7 | 2.0 |
| Yes | 11.1Note * | 8.0 | 15.2 | 14.0Note * | 13.0 | 15.1 |
... not applicable
|
||||||
Having a mood disorder or anxiety was the strongest risk factor of suicide ideation among immigrant and the Canadian-born populations
Multivariable logistic regression modelling examined associations between sociodemographic, socioeconomic and mental health factors on past-year suicide ideation for Canadian immigrants and the Canadian-born population. Separate models were estimated for the immigrant and the Canadian-born populations as the influence of risk factors on suicide ideation may be different for these two populations.
When all risk and protective factors for suicide ideation were considered simultaneously, results suggested that having either an anxiety or mood disorder, which are strongly correlated with each other, was the strongest risk factor for both immigrant and Canadian-born populations (Table 3).Note After controlling for a range of socio-economic factors, the odds of suicide ideation was about 10 times greater among those with an anxiety or mood disorder compared to those without. Sex was not associated with past-year suicide ideation in the fully adjusted model for both populations, after accounting for impact of mental health disorders.
The fully adjusted model for both populations suggests that the age pattern of past-suicide ideation varied by immigrant status, when controlling for other sociodemographic factors. Being very young was a risk factor for past-year suicidal ideation among immigrants. Compared to 40-to-64-year-olds, immigrants aged 15 to 24 were about 4 times more likely to have thought about killing themselves in the past year. The Canadian-born population had a larger age range at risk. Plus, the Canadian-born seniors were at less risk than the working-aged reference group.
In addition, among immigrants, time since migration was a risk factor on suicide ideation. Specifically, long-term immigrants, defined as those who immigrated to Canada over 10 years ago, were more likely to report past-year suicide ideation than recent immigrants.
For the Canadian-born population, socioeconomic factors, such as being in the lowest household income quintile and having no postsecondary education at the household level, remained risk factors after taking into account different socio-demographic factors. These same risk factors did not have significant associations with past-year suicide ideation for immigrants.
| Selected characteristics | Immigrant population | Canadian-born population | ||||
|---|---|---|---|---|---|---|
| odds ratio | 95% confidence intervals | odds ratio | 95% confidence intervals | |||
| from | to | from | to | |||
| Sex | ||||||
| Males (ref.) | 1.0 | Note ...: not applicable | Note ...: not applicable | 1.0 | Note ...: not applicable | Note ...: not applicable |
| Females | 1.0 | 0.7 | 1.4 | 0.9 | 0.8 | 1.0 |
| Age group | ||||||
| 15 to 24 | 3.9Note * | 2.4 | 6.4 | 2.9Note * | 2.5 | 3.4 |
| 25 to 39 | 1.5 | 1.0 | 2.3 | 1.5Note * | 1.3 | 1.7 |
| 40 to 64 (ref.) | 1.0 | Note ...: not applicable | Note ...: not applicable | 1.0 | Note ...: not applicable | Note ...: not applicable |
| 65 and over | 1.1 | 0.7 | 1.9 | 0.5Note * | 0.4 | 0.6 |
| Region of birth | ||||||
| Western Europe (ref.) | 1.0 | Note ...: not applicable | Note ...: not applicable | Note ...: not applicable | Note ...: not applicable | Note ...: not applicable |
| North America excluding Canada | 1.0 | 0.5 | 2.1 | Note ...: not applicable | Note ...: not applicable | Note ...: not applicable |
| Caribbean countries, Central & South America, and Africa | 1.3 | 0.7 | 2.4 | Note ...: not applicable | Note ...: not applicable | Note ...: not applicable |
| Rest of Europe | 0.7 | 0.4 | 1.3 | Note ...: not applicable | Note ...: not applicable | Note ...: not applicable |
| Asia | 0.7 | 0.4 | 1.3 | Note ...: not applicable | Note ...: not applicable | Note ...: not applicable |
| Time since migration | ||||||
| Recent (ref.) | 1.0 | Note ...: not applicable | Note ...: not applicable | Note ...: not applicable | Note ...: not applicable | Note ...: not applicable |
| Long-term | 1.8Note * | 1.1 | 2.8 | Note ...: not applicable | Note ...: not applicable | Note ...: not applicable |
| Highest level of household education | ||||||
| Has a postsecondary degree (ref.) | 1.0 | Note ...: not applicable | Note ...: not applicable | 1.0 | Note ...: not applicable | Note ...: not applicable |
| No postsecondary degree | 1.1 | 0.7 | 1.6 | 1.2Note * | 1.1 | 1.4 |
| Household income | ||||||
| Not in the lowest quintile (ref.) | 1.0 | Note ...: not applicable | Note ...: not applicable | 1.0 | Note ...: not applicable | Note ...: not applicable |
| In the lowest quintile | 1.0 | 0.6 | 1.4 | 1.6Note * | 1.4 | 1.8 |
| Mental health disorder | ||||||
| No anxiety or mood disorder (ref.) | 1.0 | Note ...: not applicable | Note ...: not applicable | 1.0 | Note ...: not applicable | Note ...: not applicable |
| Have anxiety or mood disorder | 11.4Note * | 8.0 | 16.1 | 10.9Note * | 9.6 | 12.4 |
... not applicable
|
||||||
Text begins
Start of text box
Analysis of suicide mortality: Description of the selected demographic, social and economic characteristics of the Canadian Census Health and Environment Cohort 2006
The analysis of suicide mortality is based on the 2006 CanCHEC cohort with 10 years of death data follow-up, which contained 3,685,704 Canadian-born individuals and 1,003,493 landed immigrants 15 years and older living in the private households on the census day in 2006. The study cohort is representative of approximately 5.8 million landed immigrants and 19.5 million Canadian-born individuals.
About a quarter of the immigrants in the 2006 CanCHEC study cohort were recent immigrants, who landed in Canada less than 10 years agoNote (Table 4). The majority of immigrants came from Asia and Europe (40% and 38% respectively). Immigrants from Caribbean countries, South and Central America, and Africa represented 17% of the immigrant population. Compared to the Canadian-born population, immigrants were older (91% vs 82% being older than 25 years of age) and more educated (76% vs 71% with a family member having a post-secondary degree). However, 1 in 4 of the immigrants were in the lowest income quintile compared to slightly less than 1 in 5 of the Canadian-born population.
| Selected characteristics | Immigrant population | Canadian-born population |
|---|---|---|
| percent | ||
| Sex | ||
| Male | 47.8 | 48.8 |
| Female | 52.2 | 51.2 |
| Age group | ||
| 15 to 24 | 9.4 | 18.5 |
| 25 to 39 | 23.2 | 24.2 |
| 40 to 64 | 46.7 | 43.0 |
| 65 and over | 20.8 | 14.3 |
| Region of birth | ||
| Western Europe | 7.1 | Note ...: not applicable |
| North America excluding Canada | 3.9 | Note ...: not applicable |
| Caribbean countries, Central & South America, and Africa | 17.1 | Note ...: not applicable |
| Rest of Europe | 31.3 | Note ...: not applicable |
| Asia | 39.8 | Note ...: not applicable |
| Other countries | 0.9 | Note ...: not applicable |
| Time since migration | ||
| Recent immigrants | 25.3 | Note ...: not applicable |
| Long-term immigrants | 74.7 | Note ...: not applicable |
| Highest level of household education | ||
| Has a postsecondary degree | 76.3 | 70.8 |
| No postsecondary degree | 23.7 | 29.2 |
| Economic family income | ||
| Not in the lowest income quintile | 74.2 | 82.0 |
| In the lowest income quintile | 25.8 | 18.0 |
|
... not applicable Note: Includes data from the provinces and territories. Data points might not add up to 100% due to rounding. Source: Statistics Canada, Canadian Census Health and Environment Cohorts 2006. |
||
End of text box
Age-standardized suicide mortality rate lower among immigrants compared to Canadian-born individuals
The following section presents patterns of suicide mortality among immigrants and Canadian-born individuals based on the 2006 CanCHEC cohort with 10 years of death data follow-up. In the following analysis, protective or risk factors similar to the CCHS data, if available on CanCHEC, were used for descriptive and multivariable analysis. The goal is to identify whether past-year suicide ideation and suicide mortality generally share the same risk or protective factors.
The findings are presented as an estimated number of deaths by suicide per 100,000 person-years at risk. The person-year concept is often used in cohort studies and represents unit of time when individuals are at risk of dying, and can be roughly understood as persons per year.
Mirroring the lower rate of suicide ideation, the prevalence of suicide mortality was lower among immigrants compared to the Canadian-born population (Table 5). The age-standardized suicide mortality rate for immigrants was 7.5 per 100,000 person-years at risk and 13.9 per 100,000 person-years for Canadian-born individuals. However, variations in the suicide mortality rates within the populations emerged when disaggregated by sociodemographic and socioeconomic factors.
Immigrants born in Western Europe had the highest suicide mortality rate among immigrants
For both immigrant and Canadian-born populations, suicide rates were higher among males than females, contrasting patterns in suicide ideation. For immigrant men, the suicide rate was 2.75 times higher compared to immigrant women (11 versus 4 per 100,000 person-years). Similarly, it was 3 times higher among Canadian-born men compared to Canadian-born women (22 versus 7 per 100,000 person-years). The apparent gender paradox in ideation and suicide mortality is well-documented.Note Men tend to use more lethal methods to kill themselves than women, while women tend to report higher suicide thoughts and attempts.
The risk of suicide varied among immigrants from different regions. Immigrants born in Western Europe had the highest suicide mortality rate at 15 suicides per 100,000 person-years. Immigrants from other regions had suicide mortality rates ranging from 6 to 11 per 100,000 person-years (Table 5).
The variation in suicide mortality by region of birth is likely influenced by the interplay of birth country environment and post-migration integration in Canada. According to the World Health Organization, risk of suicide varies by region, with African, European, and South-East Asia regions having higher rates than the global average.Note Although immigrants’ socioeconomic and health characteristics largely differ from those of the population in their birth country, they still carry the risk of suicide in their birth country including stigmatization of mental health difficulties.Note
After migration, immigrants are impacted by another set of risk factors in the destination country, including language barriers, poor job outcomes, and barriers to health care.Note The impact of poor social integration on health is usually not immediate. It could take many years of persistent high-effort coping to impact the health of immigrants who experience low social integration.Note
Along with sex and region of birth, economic family income played a role in risk for immigrants. Those in the lowest income quintile had a suicide mortality rate 1.3 times higher than those not in the lowest income quintile (9 versus 7 per 100,000 person years). The influence of economic conditions on suicide mortality among immigrants in this study but not on suicide ideation, may be related to differences in the composition of immigrants in the two data sources. For example, the CanCHEC database contains a greater share of European immigrants and long-term immigrants compared to the CCHS. For this reason, it is not recommended to compare results across the two data sources.
Some researchers argue that objective economic conditions have weaker associations with mental health than ‘subjective social status’ for immigrants because recent immigrants and older immigrants do not necessarily compare themselves to the host country population.Note However, for immigrants who acculturate to the host country over time, their internal reference group can switch to the native-born population and the sense of relative deprivation may be stronger.
The suicide mortality rates for immigrants, however, did not differ by household education. This result indicates that, for immigrants, the protective effect of postsecondary education on suicide-related behaviours was weak. According to a recent study, the experience of over-education was found to be more prevalent among working-aged immigrants, where 62% of the recent immigrants and 48% of the established immigrants did not find jobs that matched their educational credentials, compared to 40% for the Canadian-born population.Note As a result, it points to the possibility that the experience of underemployment reduces the protective effect of postsecondary education on mental health for immigrants, who are generally well-educated in Canada.Note
Similar to the immigrant population, the suicide mortality rates were higher for Canadian-born from a household in the lowest income quintile (23 per 100,000 person years). However, unlike the immigrant population, risk was higher for Canadian-born in households without a post-secondary education (16 per 100,000 person years).
Although there were similarities in the patterns between the Canadian immigrant and Canadian-born populations for sex and income, the magnitude of difference was smaller for immigrants. For instance, the male-to-female ratio in suicide rate was 3.2 among the Canadian-born population and 2.7 for immigrants. Income-related health inequalities also appeared to be smaller among the immigrants. For instance, the rate ratio between those in the lowest income quintile and the highest quintile was larger for the Canadian-born than the immigrants (1.9 times versus 1.3 times).
| Selected Characteristics | Immigrant population | Canadian-born population | ||||
|---|---|---|---|---|---|---|
| suicide mortality rate | 95% confidence intervals | suicide mortality rate | 95% confidence intervals | |||
| from | to | from | to | |||
| Overall | 7.5Table 5 Note ‡ | 6.8 | 8.1 | 13.9 | 13.5 | 14.4 |
| Sex | ||||||
| Females (ref.) | 4.2Table 5 Note ‡ | 3.4 | 4.9 | 6.7 | 6.2 | 7.1 |
| Males | 10.1 | 12.3 | 21.6Note * | 20.9 | 22.4 | |
| Region of birth | ||||||
| Western Europe (ref.) | 15.3 | 10.1 | 20.4 | Note ...: not applicable | Note ...: not applicable | Note ...: not applicable |
| North America excluding Canada | 10.6 | 5.0 | 16.2 | Note ...: not applicable | Note ...: not applicable | Note ...: not applicable |
| Caribbean countries, Central & South America, and Africa | 5.6Note * | 4.4 | 6.8 | Note ...: not applicable | Note ...: not applicable | Note ...: not applicable |
| Rest of Europe | 9.3 | 7.6 | 10.9 | Note ...: not applicable | Note ...: not applicable | Note ...: not applicable |
| Asia | 5.5Note * | 4.7 | 6.4 | Note ...: not applicable | Note ...: not applicable | Note ...: not applicable |
| Highest level of household education | ||||||
| Has a postsecondary degree (ref.) | 7.1 | 6.2 | 8.1 | 11.4 | 10.8 | 12.0 |
| No postsecondary degree | 7.5 | 6.6 | 8.5 | 16.4Note * | 15.7 | 17.1 |
| Economic family income | ||||||
| Not in the lowest income quintile (ref.) | 6.9 | 6.1 | 7.6 | 12.2 | 11.7 | 12.6 |
| In the lowest income quintile | 9.3Note * | 7.9 | 10.7 | 23.4Note * | 22.1 | 24.8 |
... not applicable
Source: Statistics Canada, Canadian Census Health and Environment Cohorts, 2006. |
||||||
Immigrants aged 25 to 39 had the lowest suicide mortality rate among immigrants
Age-specific patterns in suicide mortality differed from suicide ideation. While young people tended to have higher rates of suicidal thoughts, they were not necessarily at higher risk of dying by suicide. (Table 6).
For immigrants, 40-to-64-year-olds were more at risk of suicide mortality, but only compared to their counterparts aged 25 to 39. Rates of suicide mortality for working-aged immigrants were similar to the youngest and oldest age groups. For the Canadian-born population, 40-to-64-year-olds had the highest suicide mortality rates (17 per 100,000 person years) compared to other age groups.
Additional comparison between immigrants and the Canadian-born population indicates that the two groups were equally vulnerable to late-life suicide. Moreover, suicide mortality among immigrant youth did not differ from that of the Canadian-born youth.
| Age group | Immigrant population | Canadian-born population | ||||
|---|---|---|---|---|---|---|
| suicide mortality rate | 95% confidence interval | suicide mortality rate | 95% confidence interval | |||
| from | to | from | to | |||
| 15 to 24 | 7.3 | 4.4 | 10.3 | 10.9Note * | 9.8 | 12.0 |
| 25 to 39 | 5.4Note *Table 6 Note ‡ | 4.2 | 6.5 | 12.0Note * | 11.2 | 12.7 |
| 40 to 64 (ref.) | 8.1Table 6 Note ‡ | 7.2 | 9.0 | 17.3 | 16.6 | 18.0 |
| 65 and over | 10.0 | 8.8 | 11.3 | 11.6Note * | 10.8 | 12.5 |
Source: Statistics Canada, the Canadian Census Health and Environment Cohorts 2006. |
||||||
Sex, age, region of birth, and income quintile remain strong risk factor of immigrant suicide mortality, after accounting for other factors
To examine the role of sociodemographic and socioeconomic factors in the risk of death by suicide among immigrants and the Canadian-born, multivariable analysis was conducted. Sociodemographic and socioeconomic variables that were identified as possible risk factors for suicide-related behaviours across all life stages were entered into the model sequentially to adjust the hazard ratio of suicide mortality. The hazard ratios can be understood as the relative risk of suicide mortality based on certain characteristics.
Overall, the models for both the immigrant and the Canadian-born populations largely reflect the descriptive statistics. After accounting for the other factors, both immigrant and Canadian-born males had a risk of suicide mortality approximately three times higher than their female counterparts (Table 7).
Among the immigrant population, the models suggest that sex, age, region of birth, and income quintile remained factors associated with a higher risk of suicide mortality. Likewise, among the Canadian-born population, sex, age, household-level education, and income quintile were factors associated with a higher risk of suicide mortality. One of the main limitations of this model is the lack of data on mental health disorders, in light of the positive correlation between anxiety or mood disorders and the risk of suicide ideation.
| Selected Characteristics | Immigrant population | Canadian-born population | ||||
|---|---|---|---|---|---|---|
| hazard ratio | 95% confidence intervals | hazard ratio | 95% confidence intervals | |||
| from | to | from | to | |||
| Sex | ||||||
| Females (ref.) | 1.0 | Note ...: not applicable | Note ...: not applicable | 1.0 | Note ...: not applicable | Note ...: not applicable |
| Males | 2.9Note * | 2.4 | 3.5 | 3.3Note * | 3.1 | 3.6 |
| Age group | ||||||
| 15 to 24 | 0.9 | 0.6 | 1.2 | 0.6Note * | 0.6 | 0.7 |
| 25 to 39 | 0.8Note * | 0.6 | 1.0 | 0.9Note * | 0.8 | 1.0 |
| 40 to 64 (ref.) | 1.0 | Note ...: not applicable | Note ...: not applicable | 1.0 | Note ...: not applicable | Note ...: not applicable |
| 65 and over | 1.1 | 0.9 | 1.3 | 0.7Note * | 0.7 | 0.8 |
| Region of birth | ||||||
| Western Europe (ref.) | 1.0 | Note ...: not applicable | Note ...: not applicable | Note ...: not applicable | Note ...: not applicable | Note ...: not applicable |
| North America excluding Canada | 0.6Note * | 0.4 | 0.9 | Note ...: not applicable | Note ...: not applicable | Note ...: not applicable |
| Caribbean countries, Central & South America, and Africa | 0.3Note * | 0.3 | 0.4 | Note ...: not applicable | Note ...: not applicable | Note ...: not applicable |
| Rest of Europe | 0.5Note * | 0.4 | 0.7 | Note ...: not applicable | Note ...: not applicable | Note ...: not applicable |
| Asia | 0.3Note * | 0.2 | 0.4 | Note ...: not applicable | Note ...: not applicable | Note ...: not applicable |
| Highest level of household education | ||||||
| Has a postsecondary degree (ref.) | 1.0 | Note ...: not applicable | Note ...: not applicable | 1.0 | Note ...: not applicable | Note ...: not applicable |
| No postsecondary degree | 1.0 | 0.9 | 1.2 | 1.3Note * | 1.2 | 1.3 |
| Economic family income | ||||||
| Not in the lowest income quintile (ref.) | 1.0 | Note ...: not applicable | Note ...: not applicable | 1.0 | Note ...: not applicable | Note ...: not applicable |
| In the lowest income quintile | 1.5Note * | 1.3 | 1.8 | 1.9Note * | 1.8 | 2.1 |
... not applicable
Source: Statistics Canada, the Canadian Census Health and Environment Cohorts 2006. |
||||||
Conclusion
Overall, Canadian immigrants had lower rates of suicide ideation and suicide mortality than the Canadian-born population. Yet, there was heterogeneity within this broader pattern, as the disaggregated results illustrated variations in suicide mortality by region of birth. This is consistent with previous studies, which indicate that the overall health patterns of immigrants as an aggregated group do not extend to immigrants from certain regions.Note
The immigrant population in Canada represents a diverse group, and as such, disaggregation of data is necessary to identify variations in suicide-related behaviours. This, in turn, can create opportunities for targeted suicide prevention strategies. The study highlighted that, while immigrant and Canadian-born population share some broader patterns in suicide-related behaviours, there are also some unique patterns. After accounting for socio-demographic and economic factors, for both immigrants and Canadian-born individuals, sex was not associated with differences in past-year suicide ideation but males had roughly three times higher suicide mortality rates than those of females. This sex gap was similar to previously published Canadian statistics.Note
Having an anxiety or mood disorder was found to be the strongest risk factor for past-year suicide ideation for both populations, consistent with other studies indicating a negative influence of mental disorders on suicide-related behaviours.Note Low household income was associated with a higher risk of suicide ideation for the Canadian-born only, but lower income was associated with suicide mortality for both populations.
These disaggregated results further indicate that the relationship between age and suicide-related behaviours varied by immigrant status. Though for both populations, past-year suicide ideation peaked among youth. Immigrants in all age groups reported lower rates of past-year suicide ideation compared to the Canadian-born population, except for senior immigrants.
In terms of suicide mortality, young and older immigrants were as likely to die by suicide, while young Canadian-born persons were less likely than their older working-aged counterparts to die by suicide. These age patterns in suicide mortality have also been reported in other Canadian studies.Note The relationship between age and suicide-related behaviours can be related to other age-related psychosocial factors not captured in this study, including self-esteem, mastery, and social support.Note Additionally, the analysis suggested education at the household-level was associated with suicide-related behaviours for Canadian-born population but not for immigrants. It is noteworthy that measures for mental disorders were not available for the analysis of suicide mortality. Given its important link to suicide ideation, it is recommended that future studies look into the possibility of including direct or proxy measures of mental health when analyzing suicide mortality.
There are several factors that influence mental health and suicide-related behaviours that were not included in this study. These included admission class (economic-class, family-class, or refugee), period of migration, acculturative stress, psychosocial resources, substance use, religion, adverse childhood experiences and racialization.Note In addition, since the goal of this study was to study suicide-related behaviours for a nationally representative population aged 15 years and over, only protective and risk factors that apply across all stages of life were included. As a result, job status and marital status were excluded in this study since youth may not have a job or be married.
Protective and risk factors likely vary by age group in a subpopulation. It is also important to develop suitable measures of protective and risk factors for specific subpopulation. For instance, for working-age immigrants, over-education or job-related stress could be risk factors for mental health, while for older adults, the risk factors could be social isolation and language barriers. Future suicide-related research should be tailored to specific age groups to help identify important protective and risks factors for different stages of life. In addition, factors such as racialization, as well as sexual and gender diversity should be considered.
It must be recognized that low suicide-related behaviours may not represent good mental health. According to the WHO, “mental health is more than the absence of mental disorder. It exists on a complex continuum, which is experienced differently from one person to the next, with varying degrees of difficulty and distress and potentially very different social and clinical outcomes”. In fact, previous studies indicate that immigrants typically had lower distress or lower depression, yet they had similar level of self-rated mental health, or lower quality of life than the Canadian-born population.Note When immigrants experience poor mental health, they were also less likely to consult mental health professionals than the Canadian-born population.Note As such, it is important to acknowledge that there is no ‘one-size-fits-all’ approach to mental health promotion or suicide prevention.
Fei-Ju Yang and Nicole Aitken are analysts at the Centre for Health Data Integration (CHDI) at Statistics Canada. Linlu Zhao is an analyst at Public Health Agency of Canada.
Text begins
Start of text box
Data sources, methods and definitions
Data sources
This study uses two data sources. Proportion of lifetime and past-year suicide ideation were estimated using the Canadian Community Health Survey (CCHS) 2015, 2016, and 2019, where suicide-related content was available. Territories and institutionalized population were not part of the CCHS sample.Note Suicide mortality rates were estimated using the Canadian Census Health and Environment Cohorts (CanCHEC) 2006Note excluding institutionalized population.
The CCHS is a cross-sectional survey that collects information related to health status, health care utilization and health determinants for the Canadian population 12 years and older, however only respondents aged 15 and over were asked the suicide-related questions. Data were pooled across three years of data (i.e., 2015, 2016 and 2019). The pooled estimates will not represent the population of any given CCHS cycle used in this analysis, since the samples were drawn from an evolving population. For instance, the proportion of immigrants grow over time, or the composition of region of birth among immigrants change over time.Note However, they will provide an estimate of the suicide ideation prevalence that reflect the average Canadian household population above 15 years old from 2015 to 2019 in ten provinces. Information associated with territories were not available on single-year CCHS data.Note
The CanCHECs are a series of population-based, probabilistically linked datasets that combine data from respondents on the long-form census with administrative health data, in this case Vital Statistics death data.Note Suicide mortality data came from the CanCHEC 2006 with 10 years of mortality follow-up. The 10 years of follow-up was chosen as it provides sufficient suicide counts and robust estimates associated with immigrants, while avoiding under coverage issue due to delayed reporting known to exist for non-natural deaths like suicide. This study included cohort members who were 15 years and over on the census day, in private households.
Definitions
Immigrant: The term ‘immigrants’ refers to landed immigrants to Canada. Non-permanent residents constituted a very small percentage of the population and were thus excluded from this study.
Canadian-born: The term ‘Canadian-born’ refers to individuals born in Canada, including second-generation or third plus-generation Canadians in the pooled CCHS cycles (2015-2016, 2019) and CanCHEC 2006.
Lifetime suicide ideation ( CCHS): Respondents were asked: “Have you ever seriously contemplated suicide?” Those who answered yes to this question were considered as having lifetime suicide ideation.
Past-year suicide ideation ( CCHS): Only respondents who were considered as having lifetime suicide ideation were asked: “Has this happened in the past 12 months?” Those who answered yes to the question were considered as having past-year suicide ideation.
Suicide mortality (CanCHEC): Suicide as a specific cause of death were based on ICD-10 (International Classification of Diseases), including X60-X84, and Y87.0.
Region of birth: Regions were grouped according to the Standard Classification of Countries and Areas of Interest (SCCAI) 2009 and 2019.Note For instance, in our article, ‘North America excluding Canada’ includes Greenland, Saint Pierre and Miquelon, and United States of America. However, due to small counts for past-year suicide ideation, we grouped North Europe, South Europe and Eastern Europe into ‘Rest of Europe.’ Caribbean countries, Central and South America and Africa were grouped together as suicide deaths among immigrants born in these regions were similar.
Time since migration: Respondents who landed in Canada 10 or more years from the collection date were considered to be long-term immigrants, while recent immigrants were those who landed within 10 years of the collection date. It is important to note that landed year is a proxy for time since migration or years of residence in Canada. However, some temporary foreign workers are known to have lived in Canada for some time before they applied for permanent residency,Note while others do not live in Canada immediately after they land in Canada.
Post-secondary degree at the household level: This variable indicates whether or not a respondent is residing in a household that had at least one household member who attained a post-secondary degree or not. Household level education was chosen over person level education because the benefits associated with the education earned by family members are expected to be distributed within a family unit. In particular, some studies have found that the person in the household with the highest level of education has a positive influence on his/her family members’ health
Household income level ( CCHS): Household income quintiles were created in two stages: first, a ratio of pre-tax total household income to the low-income cut-off corresponding to their household and community size was calculated, for each respondent; second, quintiles based on these ratios were generated using weighted data. To provide more robust estimates, quintiles were divided into ‘in the lowest quintile’ and ‘not in the lowest quintile.’ Note that households can include persons living with non-relatives, while economic family captures ‘a group of two or more persons who live in the same dwelling and are related to each other by blood, marriage, common-law union, adoption or a foster
Economic family income level (CanCHEC): To create economic family income quintiles, we first calculated the total pre-tax family income from all economic family members, then we calculated the ratio of this income to the low-income cut-off based on family size and community size. Quintiles were generated using weighted data.Note To provide more robust estimates, quintiles were divided into ‘in the lowest quintile’ and ‘not in the lowest quintile.’ Additional analyses were done to compare the suicide mortality rates by household income quintile and economic family income quintile. The results based on economic family income level and household income level were quite close.
Methods
All of the descriptive and inferential statistics were calculated with sample weight and bootstrap weights (1000 bootstrap weight for CCHS 2015, 2016, 2019 and 500 bootstrap weights for CanCHEC 2006).
For the descriptive statistics, pairwise chi-square tests of significance were conducted.
Adjusted odds ratio: Logistic regression models were used to estimate the adjusted odds ratio of reporting past-year suicide ideation. The adjusted odds ratio is the likelihood of a person with a given characteristic (for instance, being male or female) experiencing past-year suicide ideation, while controlling for other characteristics (e.g., setting the other characteristics, such as age or household income, at their average value measured within the sample).
Age-standardized suicide mortality rate: Age-standardized rates allow comparison between groups. Rates were estimated by the direct age-standardization method. The rates for all groups were all standardized to the 2011 Standard Population– as per the description in the “Vital Statistics Death Database – Glossary”.Note To calculate age-standardized suicide rates, age-specific suicide mortality rates (15 five-year age groups in total) were multiplied by 100,000 person-years in 5-year age group were calculated. Age-standardized suicide rates were computed by dividing the suicide deaths count of cohort members in the follow-up period by the total person-years at risk. Further details are available in Statistics Canada’s Health Indicators publication section on Health status indicators based on vital statistics.Note
Person-years at risk: In prospective studies (studies that trace a cohort or a group of individuals over time), person-years at risk is commonly used as a measure to account for the number of people in the study cohort, who are at risk of a specific cause of death, and the amount of time each person spends in the study period.Note
Age-specific suicide rates: Rates were computed by dividing the number of suicide deaths of a specific age group by the respective population, then multiplying the resulting number by 100,000 person-years.
Hazard ratios: Cox proportional hazards modelling was performed to estimate the adjusted hazard ratios of suicide mortality. Individuals who died due to other causes of deaths were censored.
Limitations
There are several limitations that should be considered when interpreting the study results. Study cohorts from CCHS and CanCHEC reflected the immigrant population at the time of data collection. Since CCHS data were collected ten years later than the CanCHEC 2006, a higher percentage of respondents in the CCHS study cohort were immigrants than the CanCHEC 2006 cohort. There also some compositional differences in region of birth between CCHS and CanCHEC, as major immigrant-sending countries varied by period.Note Therefore, results based on CCHS and CanCHEC are not directly comparable.
CCHS results are based on self-reports, which is subject to recall bias. Self-reporting may also lead to an underestimation of the prevalence of suicide ideation, due to the stigma around suicide and other factors. Past-year suicide ideation may be under-reported by the survey sequence of asking this only if the participant indicated lifetime ideation.
Estimates of suicide mortality rates based on the CanCHEC 2006 can underestimate true suicide mortality rates for population aged 15 years and older due to the study having excluded the institutionalized population and not all of the suicide deaths from the vital statistics being integrated with the 2006 census. Since CanCHEC 2006 cannot account for emigration patterns (Canadian-born moving to other countries or immigrants returning to their origin countries), suicides occurring in other countries could not be captured. Further caution should be used when interpreting the results because sociodemographic and socioeconomic information reported on the collection day may have changed over time.
The study findings for suicide ideation and suicide mortality should not be directly compared. Suicide-related behaviors do not necessarily follow a linear progression in terms of severity and, as noted above, the two data sources used in this study are not directly comparable.
The study focused on past-year suicide ideation rather than lifetime suicide ideation for the following reasons: (1) lifetime prevalence does not reflect current treatment needs of immigrants who experienced suicide ideation in the past year; (2) most immigrants spent considerable time in their birth country and the use of lifetime prevalence might reflect distant experiences of suicide ideation in other countries, rather than immigrants’ recent experiences of suicide ideation in Canada; (3) it is possible to recover from suicidalityNote and using lifetime prevalence does not reflect the changing patterns in suicidal behaviors.
Our study also chose to report disaggregated results by region of birth rather than by racialized groups because previous studies have shown associations of region of birth with various health outcomes, including suicide mortality, self-rated health, diabetes, and arthritis.Note Racialized groups are too broad of a category for suicide-related behaviors, as some racialized groups came from different region of birth, estimating suicide-related behaviors can conceal important variations in health outcomes. For instance, our study shows that immigrants from Western Europe had higher suicide mortality rates than those from the rest of Europe. In addition, racialized status can conflate with immigrant generation status. Racialized groups constituted 60% of the first-generation immigrants while they represented 30% of the second-generation Canadians.Note This conflation has implications for identifying whether or not belonging to a racialized group has an impact on suicide-related behaviors, as generational status has an impact on suicide-related behaviors.Note
End of text box
| Selected Characteristics | Immigrant population | Canadian-born population | ||||
|---|---|---|---|---|---|---|
| percentage | 95% confidence interval | percentage | 95% confidence interval | |||
| from | to | from | to | |||
| Sex | ||||||
| Males (ref.) | 5.2 | 4.7 | 5.9 | 12.8 | 12.4 | 13.3 |
| Females | 7.1Note * | 6.5 | 7.8 | 15.7Note * | 15.2 | 16.1 |
| Age group | ||||||
| 15-24 | 10.5Note * | 8.4 | 12.9 | 16.3Note * | 15.4 | 17.2 |
| 25-39 | 6.1 | 5.3 | 7.0 | 17.3Note * | 16.6 | 18.1 |
| 40-64 (ref.) | 5.8 | 5.1 | 6.5 | 14.6 | 14.1 | 15.1 |
| 65 and over | 5.2 | 4.6 | 6.0 | 7.8Note * | 7.5 | 8.2 |
| Region of birth | ||||||
| Western Europe (ref.) | 11.0 | 9.2 | 13.1 | Note ...: not applicable | Note ...: not applicable | Note ...: not applicable |
| North America excluding Canada | 14.9Note * | 12.3 | 17.9 | Note ...: not applicable | Note ...: not applicable | Note ...: not applicable |
| Caribbean countries, Central & South America, and Africa | 7.0Note * | 5.9 | 8.3 | Note ...: not applicable | Note ...: not applicable | Note ...: not applicable |
| Rest of Europe | 6.3Note * | 5.4 | 7.2 | Note ...: not applicable | Note ...: not applicable | Note ...: not applicable |
| Asia | 4.3Note * | 3.7 | 5.0 | Note ...: not applicable | Note ...: not applicable | Note ...: not applicable |
| Time since migration | ||||||
| Recent (ref.) | 4.5 | 3.8 | 5.3 | Note ...: not applicable | Note ...: not applicable | Note ...: not applicable |
| Long-term | 6.9Note * | 6.3 | 7.5 | Note ...: not applicable | Note ...: not applicable | Note ...: not applicable |
| Highest level of household education | ||||||
| Has a post-secondary degree (ref.) | 6.2 | 5.7 | 6.7 | 13.8 | 13.4 | 14.1 |
| No post-secondary degree | 6.2 | 5.2 | 7.3 | 16.1Note * | 15.4 | 16.8 |
| Household Income | ||||||
| Not in the lowest quintile (ref.) | 6.3 | 5.4 | 7.2 | 12.7 | 12.4 | 13.1 |
| In the lowest quintile | 6.2 | 5.7 | 6.7 | 22.7Note * | 21.8 | 23.6 |
| Mood disorder | ||||||
| No (ref.) | 4.8 | 4.4 | 5.2 | 10.2 | 9.9 | 10.5 |
| Yes | 33.5Note * | 29.4 | 37.8 | 52.1Note * | 50.7 | 53.5 |
| Anxiety disorder | ||||||
| No (ref.) | 5.3 | 4.9 | 5.7 | 11.3 | 11.0 | 11.7 |
| Yes | 26.1Note * | 22.1 | 30.6 | 40.8Note * | 39.5 | 42.2 |
... not applicable
|
||||||
- Date modified: