
Insights on Canadian Society
Harassment and discrimination among faculty and researchers in Canada's postsecondary institutions
by Darcy Hango

Skip to text
Text begins
This study was funded by Women and Gender Equality Canada (WAGE).
Start of text box 1
Overview of the study
Harassment and discrimination can exist across all Canadian workplaces, occurring in any type of occupation and setting, including postsecondary institutions. This study uses data from the 2019 Survey of Postsecondary Faculty and Researchers to examine workplace harassment and discrimination within Canada’s postsecondary institutions experienced by full and part-time university faculty (including teaching staff and researchers), college instructors, postdoctoral fellows and doctoral students. It sheds light on specific types of harassment, the relationship between the harasser and the victim, as well as the grounds for discrimination and types of discrimination. The study also examines whether those who were harassed took action against their harasser, ranging from confronting the perpetrator to filing a formal complaint.
The results of the study are representative of the survey participants, of which approximately half were university faculty (49%), one-third college faculty (29%) and one-fifth doctoral students (18%). The remaining 4% were postdoctoral fellows.
- Women are 1.5 times more likely than men to experience workplace harassment and discrimination in postsecondary institutions, a finding that is present in other workplaces and society in general.
- Sexual minority groups and persons with disabilities are among the most likely to be the targets of workplace harassment and discrimination in postsecondary institutions.
- Persons in positions of authority were the most common perpetrators of workplace harassment against PhD students and postdoctoral fellows.
- In cases of workplace harassment against university and college teachers, colleagues and students were most often identified as the persons responsible.
- Men and women, regardless of role in their institution, were more likely to be harassed by a man than a woman.
- Overall, women are more likely than men to take action against their harasser, except in the cases of sexual harassment/unwanted sexual attention and physical violence.
End of text box 1
Introduction
Harassment and discrimination can exist across all Canadian workplaces, occurring in any type of occupation and setting, including postsecondary institutions. Acts of harassment and discrimination are varied and may have wide-reaching implications on workers’ health and well-being, as well as their job tenure, stability and satisfaction. The consequences of harassment may range from negatively impacting one's attitude toward their job, in terms of their level of satisfaction and their level of commitment, to poorer physical and psychological wellbeing.Note Workplace harassment and violence may also have an impact on the overall economy, such as costs associated with absenteeism, lost productivity and job turnover.Note
To date, there has been very little research on workplace harassment occurring in postsecondary educational institutions in Canada. Some recent research examining harassment and discrimination in Canadian universities has focused on a particular discipline,Note a particular institutionNote or institutions,Note a particular province,Note or type of postsecondary institution.Note For example, one study found that among science and engineering faculty in 12 Canadian universities, women were more likely than their male colleagues to be victims of incivility, harassment and discrimination. The same study also found that while racialized women reported only marginally less harassment than their non-racialized counterparts, racialized men reported significantly more harassment and discrimination than non-racialized faculty.Note Another study at a Canadian university found that women faculty were more likely to be victims of cyberbullying.Note
Harassment and discrimination among students in Canada has been examined more extensively. A recent Statistics Canada studyNote analyzed unwanted sexual behaviour and gender-based discrimination on Canadian campuses. It found a substantial amount of discrimination based on gender, gender identity and sexual orientation, as reported by students in Canada's universities and colleges, with women more likely to experience these behaviours than men. Unwanted sexualized behaviours were also a major concern, with 45% of women and 32% of men reporting that they had personally experienced at least one of these types of behaviour in a postsecondary setting during the previous year.
Although workplace harassment and discrimination occur in all settings, some environments may pose higher risk to workers than others. Postsecondary institutions have some characteristics that may lead to increased risks of workplace harassment or discrimination. For example, there is a great deal of hierarchy in terms of authority (e.g., tenured faculty supervising graduate students), as well as interaction between professors/teaching assistants and students.Note Moreover, younger adults, who are more likely to experience harassment and discrimination,Note represent a large part of the working and student population of postsecondary institutions.
This study uses the 2019 Survey of Postsecondary Faculty and Researchers (SPFR) to help illuminate the state of workplace harassment and discrimination experienced by full and part-time university faculty (including teaching staff and researchers), college instructors, postdoctoral fellows, and doctoral students across Canada’s postsecondary institutions (see Data sources, methods and definitions). In particular, it aims to add to and expand on the body of knowledge on workplace harassment and discrimination in academia.
The SPFR allows for a focus on harassment and discrimination experienced by those who teach or conduct research in Canada's postsecondary sector, including full and part-time university and college faculty, postdoctoral fellows, and doctoral students. Often, research in this area focuses on one of these groups, usually faculty members.Note A key strength of the current study is that harassment and discrimination can be examined across different types of institutions, different fields of study and different provinces, thus providing a greater breadth of the topic previously unseen within Canadian academia. Workplace harassment and discriminationNote in general will be examined, as will specific types of harassment, relationships between those who experience harassment and those who perpetrate it, as well as the basis for discrimination and types of discrimination. Lastly, this study explores whether those who were harassed took action against their harasser, for example by the confronting the perpetrator or filing a formal complaint.Note
The data used in this study were collected in autumn 2019 and predate the COVID-19 pandemic. It is not clear at this time, if and how some of the public health restrictions resulting from the pandemic, such as social distancing measures, loss of employment or reduced income, may have impacted experiences of harassment and discrimination across Canadian campuses. From March 2020 to June 2021, most postsecondary institutions in Canada halted in-class learning,Note meaning that harassment and discrimination involving face-to-face interaction may have decreased. Conversely, online harassment or cyberbullying may have increased, as more interactions became virtual with the shift to online learning.
The SPFR data cannot shed light on this online form of harassment, as questions on cyberbullying were not asked. There are some reports that working from home may stifle workplace harassment claims,Note in that there may be fewer opportunities for incidental observation of the harassment by others.
Women faculty and researchers are about 1.5 times more likely than men to experience workplace harassment
The SPFR asked those who teach and/or conduct research in Canada's postsecondary institutions about their experiences of five types of harassment in the past year, including verbal abuse, humiliating behaviour, threats (e.g., blackmailing, threats to career or reputation, physical threats), physical violence, and unwanted sexual attention or sexual harassment.Note
In 2019, about one-third of women (34%) reported having experienced at least one type of harassment in their postsecondary institution (Chart 1).Note In contrast, about 1 in 5 (22%) men reported the same.Note ,Note This 12-percentage point gender difference aligns with previous research examining harassment across all types of workplaces in Canada. However, these proportions are higher than in other occupational settings. A Statistics Canada study found that in 2016, 19% of Canadian women reported that they had experienced harassment in their workplace in the past year, while 13% of men reported it.Note
Among the five types of harassment included in the survey, humiliating behaviour was the most commonly reported, at 22% for women and 14% for men. This was closely followed by acts of verbal abuse, at 20% for women and 13% for men.
While less frequently experienced, the largest gender gap existed for unwanted sexual attention or sexual harassment.Note In 2019, 7% of women reported unwanted sexual attention or sexual harassment in the past year, about 3.5 times higher than the proportion for men (2%). The frequency of unwanted sexual attention or sexual harassment was also significantly higher for women. In particular, 4% of women experienced two or more instances of unwanted sexual attention or sexual harassment in the past year, compared to 0.8% of men.
Women also experienced verbal abuse and humiliating behaviour at a significantly greater frequency than men. Over a year period, 12% of women reported being subjected to two or more instances of verbal abuse, compared to 7% of men. Similarly, 12% of women said they experienced multiple instances of humiliating behaviour, while the same was true for 8% of men.Note Smaller differences were observed between men and women with respect to threats and physical violence.

Data table for Chart 1
| Type of harassment | Total | Women | Men (ref) |
|---|---|---|---|
| percent | |||
| Any type | 27.7 | 33.5Note * | 22.0 |
| Humiliating behaviour | 17.7 | 21.5Note * | 14.1 |
| Verbal abuse | 16.1 | 19.8Note * | 12.6 |
| Threats to person | 7.7 | 8.4Note * | 6.9 |
| Unwanted sexual attention/sexual harassment | 4.5 | 7.0Note * | 2.1 |
| Physical violence | 0.8 | 0.8 | 0.7 |
Source: Statistics Canada, Survey of Postsecondary Faculty and Researchers, 2019. |
|||
Results of the multivariate analysis confirm that all else being equal, being a woman increases the probability of harassment (see Table 7 in appendix).
Persons with disabilities, Indigenous persons and sexual minority groups among those at higher risk of harassment
In addition to gender, several other characteristics are related to an increased risk of harassment in the 12 months preceding the survey. Persons with disabilitiesNote , Indigenous persons,Note and sexual minority groups (i.e., those who identify as lesbian or gay, or bi or pan sexual) all reported workplace harassment at significantly higher rates. Their heightened vulnerability in a postsecondary environment is consistent with their overall higher prevalence rates of criminal and non-criminal victimization across all sectors of society.Note
It is worth pointing out that the prevalence of reporting harassment is consistently higher for women, whether or not they have a disability, belong to an Indigenous group, or are part of a sexual minority population.
The largest difference in the probability of experiencing harassment in the past year existed between persons with disabilities and those without. For both men and women, postsecondary teaching staff and researchers with disabilities had a probability of experiencing harassment 1.8 times higher than their colleagues without disabilities (46% versus 26%). While this was true for both men and women, women with disabilities experienced harassment more often than men (52% versus 38%).
Indigenous persons also experienced harassment at a higher rate. In 2019, 40% of Indigenous people teaching or conducting research in postsecondary institutions experienced some form of harassment in the previous year – a full 13 percentage points higher than their non-Indigenous counterparts (27%). The risk, however, was much greater for Indigenous women (45%) than Indigenous men (33%).
For the sexual minority population, 42% of bi and pan sexual teaching staff and researchers reported having experienced at least one type of harassment in their postsecondary institution, compared to 27% of their heterosexual colleagues (see Table 1 in appendix). The increased risk for the sexual minority population was seen for both men and women, with the exception of lesbian women, who had a risk that was on par with heterosexual women.
Racialized and non-racialized faculty and researchers experience similar rates of harassment
One personal characteristic generally not related to risk was belonging to a group designated as a visible minority. Specifically, visible minority teaching staff and researchers in Canada's postsecondary institutions did not have a higher probability of being harassed in the past year, compared to their colleagues who were not part of a visible minority population (27% and 28%). This finding is consistent with results on harassment in Canadian workplaces overallNote and with students’ experiences of unwanted sexualized behaviours in postsecondary schools.Note Further research is needed to determine any differences among specific racialized groups.
In addition, those whose mother tongue was neither French nor English did not have an increased risk of harassment, though faculty and researchers whose mother tongue was English were at slightly higher risk of harassment than those whose mother tongue was French (29% versus 25%). However, this difference was only evident among women (36% versus 28%).
Women’s heightened risk of workplace harassment seen across all fields and disciplines
Based on results from SPFR, there is some evidence to suggest that faculty and researchers who work or study in science, technology, engineering or mathematics (STEM)Note fields are significantly less likely (25%) to have experienced being harassed than those who work, teach or study in BHASE (business, humanities, health, arts, social science and education)Note (or non-STEM) fields (29%).
However, women, regardless of field of study, are significantly more likely than men in these fields to self-report that they experienced harassment in their postsecondary institutions in the past year. For instance, 34% of women in STEM fields experienced harassment, while for men in STEM fields, the proportion was significantly less at 21%. A similar gender difference was observed in BHASE fields (33% for women versus 23% for men).
Differences also emerge by role or position within the postsecondary institutions. For instance, university professors reported harassment more often than postdoctoral fellows (28% versus 20%). That being said, women were generally more likely than men to report workplace harassment in postsecondary institutions regardless of their position (e.g., PhD students, teachers), with the notable exceptions of postdoctoral fellows and researchers in colleges. In these cases, there were no significant gender differences in experiences of harassment.
Perpetrators of harassment against PhD students and postdoctoral fellows most often in a position of authority
The relationship between a person who experiences harassment and the perpetrator is critically important, as the types of impacts may vary, particularly in instances where the perpetrator holds some form of authority over the victim. More precisely, harassment perpetrated by people who are in formal positions of authority may influence the career trajectory of victims, as they are likely to have a degree of control over their target’s future prospects.
Formal positions of authority include people with direct authority over others, such as supervisors, but also people who occupy senior positions that may not necessarily involve supervisory functions. For example, a tenured professor may be in a position of authority over an assistant professor, and an assistant professor may hold authority over a PhD student, even if there is no direct supervisory relationship. Previous research shows that control and power differentials are quite common in instances of harassment in the workplace.Note As such, it is important to account for control and power differentials, as experiences of harassment may vary greatly according to the position that one has within their postsecondary institution.
Among PhD students and postdoctoral fellows, two-thirds (66%) of those who experienced harassment indicated that the perpetrator was in a position of authority (Chart 2).Note ,Note ,Note The second most common types of perpetrators were colleagues or peers (32%). In addition, 20% of PhD students and postdoctoral fellows reported that they had been harassed by other staff at their institution, while 10% stated that their harasser had been a student that they teach or supervise. There were no significant gender differences observed between men and women, suggesting that men and women who are PhD students or postdoctoral fellows tend to report similar types of relationships with the people who harass them.

Data table for Chart 2
| Identity of harasser | Phd Student/Postdoctoral fellow | ||
|---|---|---|---|
| Total | Women | Men | |
| percent | |||
| Individual with authority | 65.7 | 69.4 | 60.1 |
| Colleague/peer | 32.4 | 32.5 | 32.1 |
| Other staff at institution | 19.7 | 18.8 | 21.1 |
| Student who I teach/supervise | 9.8 | 9.3 | 10.4 |
| Member of the public | 7.4 | 7.3 | 7.7 |
| Unknown | 3.5 | 2.8 | 4.6 |
| Other | 1.8 | 1.4 | 2.3 |
| Source: Statistics Canada, Survey of Postsecondary Faculty and Researchers, 2019. | |||
Contrasting the pattern observed for PhD students and postdoctoral fellows, the most common perpetrators of harassment against university and college teachers were colleagues or peers (43%) or students they teach or supervise (42%) (Chart 3). In general, there were no distinct differences between men and women, with the exception of experiences of harassment perpetrated by students. Women teachers reported a significantly higher probability of being harassed by students than did men teachers (46% versus 38%). While less commonly reported, abuse of authority was still a factor in the harassment experiences of university and college teachers, as over three in ten teachers reported that they were harassed by individuals in positions of authority.

Data table for Chart 3
| Identity of harasser | Teachers | ||
|---|---|---|---|
| Total | Women | Men (ref) | |
| percent | |||
| Colleague/peer | 43.2 | 44.4 | 41.7 |
| Student who I teach/supervise | 42.3 | 45.7Note * | 37.7 |
| Individual with authority | 33.8 | 33.3 | 34.4 |
| Other staff at institution | 13.0 | 12.2 | 14.2 |
| Member of the public | 4.2 | 4.6 | 3.6 |
| Unknown | 3.3 | 2.7 | 4.0 |
| Parent of a student | 1.8 | 2.3 | 1.1 |
| Other | 1.2 | 1.4 | 1.0 |
Source: Statistics Canada, Survey of Postsecondary Faculty and Researchers, 2019. |
|||
Men and women, regardless of role in their institution, were generally more likely to be harassed by a man than a woman
In general, both men and women, regardless of role in their institution, were more likely to be harassed by a man than a woman (see Table 2 in appendix). For PhD students and postdoctoral fellows, men and women were more likely to be harassed by a man, regardless of harasser identity. For example, women PhD students and postdoctoral fellows who were harassed by a colleague or peer said that it was more often a man than a woman (77% versus 28%). A similar pattern was noted for men PhD students and postdoctoral fellows who experienced harassment by a colleague.Note
Among teachers, women were harassed significantly more by men students than women students (68% versus. 41%). Similarly, it was much more common for men teachers to be harassed by a student who was a man (67%) than for men teachers to be harassed by a student who was a woman (48%). Men and women teachers were also significantly more likely to be harassed by men colleagues and peers.
However, when the harasser was in a position of authority, there were no significant differences between men and women teachers and the gender of their harasser.
Colleagues and persons of authority most often responsible for sexual harassment towards PhD students and postdoctoral fellows
For most types of harassment, both women and men PhD students and postdoctoral fellows identified persons in positions of authority as the persons responsible, with the notable exception of unwanted sexual attention and sexual harassment. In these cases, colleagues or peers were just as likely as persons of authority to be identified as the persons responsible for unwanted sexual attention or sexual harassment.
For teachers, the results were much more mixed, differing by gender. For women teachers, students were the predominant perpetrators of verbal abuse and threats, while acts of humiliation and unwanted sexual attention or sexual harassment were most often committed by a colleague or peer.Note
For men teachers, colleagues and peers were most often responsible for harassment. This was also the case for verbal abuse, humiliating behaviours, and threats, albeit individuals in positions of authority were just as likely as colleagues to be the perpetrator. When the behaviour reached the level of unwanted sexual attention or sexual harassment, students were most often the persons responsible against men teachers. This result supports similar findings from the United States.Note
Women more likely to take some form of action against their harasser, with the exception of sexual harassment
Not all targets of harassment take action against their harassers. Some may wish to take action, but decide against reporting the behaviour for various reasons, such as fear of reprisal from their harasser. That said, the majority of women and men targeted by workplace harassment in postsecondary institutions took some form of action, such as confronting the person or people responsible for the harassment, reporting the harassment to someone with the authority to act, talking to someone else at their institution, or filing a formal complaint.
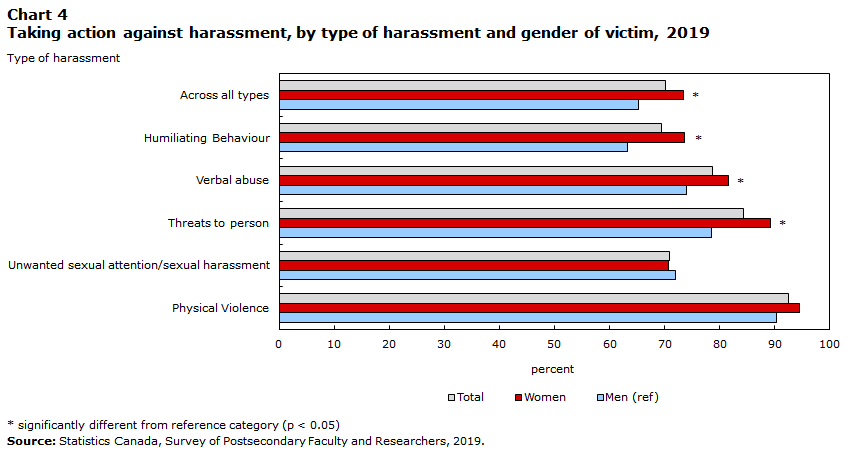
Overall, taking some form of action was more often seen among women victims: 73% of women, compared to 65% of men (Chart 4). While women were generally more likely to say that they took action, certain types of harassment were more likely to result in confronting the harasser or reporting the behaviour. In particular, acts of physical violence most often resulted in some type of action, with 94% of women and 90% of men taking action. Next were targets of threats (89% of women and 78% of men), followed by verbal abuse (82% of women and 74% of men), and humiliating behaviour (74% of women and 63% of men).
The heightened reporting by women disappears for unwanted sexual attention or sexual harassment. While the majority of targets still took action for these types of harassment, there was no gender difference: 71% of women and 72% of men.
Data table for Chart 4
| Type of harassment | Total | Women | Men (ref) |
|---|---|---|---|
| percent | |||
| Across all types | 70.2 | 73.4Note * | 65.3 |
| Humiliating Behaviour | 69.4 | 73.5Note * | 63.2 |
| Verbal abuse | 78.6 | 81.6Note * | 73.9 |
| Threats to person | 84.3 | 89.2Note * | 78.4 |
| Unwanted sexual attention/sexual harassment | 70.9 | 70.6 | 71.9 |
| Physical Violence | 92.4 | 94.4 | 90.2 |
|
|||
Taking action against harasser varies by relationship and gender
Overall, taking action against the harasser was more common when the perpetrator was a parent of a student, with almost 9 in 10 victims of harassment taking some form of action in these cases. Conversely, acts of harassment involving individuals in positions of authority or members of the public were least likely to result in action on the part of the victim (66% and 67%).
There are a few gender differences in the likelihood of taking action based on the relationship between the victim and harasser (Chart 5). In particular, about 76% of women who had been harassed by a colleague or peer took some type of action, compared with 66% of men. Similarly, 69% of women that were harassed by an individual in a position of authority took some type of action, whereas only 59% of men said the same. For other types of perpetrators, there were no other gender differences with respect to taking action against the harasser.

Data table for Chart 5
| Identity of harasser | Total | Women | Men (ref) |
|---|---|---|---|
| percent | |||
| Parent of a student | 89.2 | 92.5 | 79.5 |
| Student who I teach/supervise | 81.5 | 83.4 | 78.5 |
| Other staff at institution | 74.3 | 77.3 | 70.2 |
| Colleague/peer | 72.3 | 76.3Note * | 66.0 |
| Member of the public | 67.2 | 68.7 | 65.0 |
| Individual with authority | 65.5 | 69.4Note * | 59.5 |
| Other | 76.8 | 70.7 | 87.7 |
| Unknown | 70.4 | 77.4 | 64.0 |
Source: Statistics Canada, Survey of Postsecondary Faculty and Researchers, 2019. |
|||
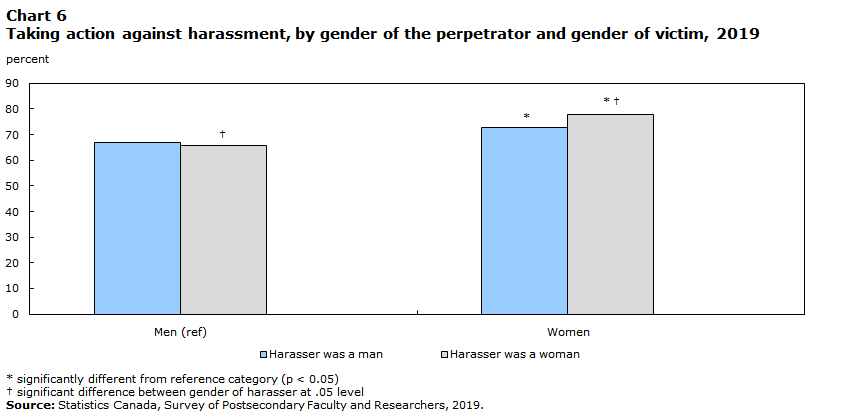
Results show that taking action against one's harasser depends on whether the harasser was a man or a woman (Chart 6). For instance, 67% of men compared to 73% of women who were harassed by a man said that they took action. In contrast, 66% of men versus 78% of women who were harassed by a woman said the same. Thus, it appears that women are more likely to take action when they were harassed by a woman, whereas men took action more or less equally regardless of whether they were harassed by a man or a woman.
Data table for Chart 6
| Gender of harasser | Men (ref) | Women |
|---|---|---|
| percent | ||
| Harasser was a man | 67.1 | 72.8Note * |
| Harasser was a woman | 65.8Note † | 77.7Note *Note † |
|
||
More research is needed but from the evidence provided by the SPFR data, women teaching, studying and doing research in Canadian universities and colleges are generally more likely than men to take action when they have been harassed.
Start of text box 2
Experiences of discrimination
Women more likely to experience unfair treatment or discrimination
Discrimination and harassment in the workplace are closely connected. Some have suggested that discriminatory behaviours may be manifested within certain types of harassment, which may make it more difficult to label the behaviour as discriminatory. For instance, in terms of gender, a woman may be verbally harassed at work, but the underlying reason for the harassment may be rooted in discrimination based on someone’s gender.Note In the current context, discrimination is measured by asking respondents if, "in the past 12 months, they have experienced unfair treatment or discrimination in their current role because of their gender, race, age, physical appearance, religion, sexual orientation, ability or for any other reason".
In 2019, the two most common bases for discrimination reported by women were sex (12%) and age (7%), while for men, the most common were race/colour, ethnicity/culture and age (3% each) (Textbox Chart 1). In general, women experienced unfair treatment or discrimination in the past year at a rate that was almost double the rate for men (20% compared to 11%). This follows a similar pattern that was observed with harassment, and was generally seen across all forms of discrimination.
In particular, women reported significantly higher levels of discrimination than men based on their sex, gender identity, having a disability, physical appearance, age, and identifying as a parent, with the largest differences being related to age, sex and identifying as a parent. Note Some previous research on parenting among faculty and career progression found that faculty members who are mothers have lower tenure rates and were more likely to be in part-time contract situations than men, and women without children.Note While findings on parenthood for women and career progression may not be exactly the same issue as experiencing unfair treatment and discrimination, some supplementary analysis showed a strong association between women having taken parental leave since their first faculty appointment and the probability that they experienced unfair treatment or discrimination on the basis of their identity as a parent.Note

Data table for Textbox Chart 1
| Reason for discrimination | Total | Women | Men (ref) |
|---|---|---|---|
| percent | |||
| Any reason | 15.4 | 20.1Note * | 10.8 |
| Sex | 7.0 | 12.2Note * | 2.0 |
| Age | 4.8 | 6.6Note * | 3.1 |
| Race/colour | 3.6 | 3.9 | 3.4 |
| Ethnicity/culture | 3.3 | 3.7 | 2.9 |
| Other | 3.0 | 3.6Note * | 2.4 |
| Nationality/immigrant status | 2.6 | 2.6 | 2.5 |
| Identity as a parent | 1.8 | 3.2Note * | 0.5 |
| Language | 1.4 | 1.6 | 1.3 |
| Physical appearance | 1.4 | 1.9Note * | 0.8 |
| Religion | 1.2 | 1.2 | 1.2 |
| Disability | 1.2 | 1.7Note * | 0.7 |
| Gender identity | 0.8 | 1.2Note * | 0.5 |
| Sexual orientation | 0.7 | 0.5 | 0.8 |
|
|||
Levels of discrimination were relatively similar between women and men for discrimination based on sexual orientation, religion, language, nationality or immigration status, ethnicity or culture, and race or colour. However, overall, the gender differences in discrimination hold even after taking into account a wide range of characteristics, such as age, sexual orientation, disability status, and role. That is, discrimination for women continues to be about two times more than men (20% versus 11%) (See Table 8 in appendix).
Discrimination higher among sexual minorities and diverse ethnocultural groups
Experiences of discrimination across Canadian workplaces are often heightened among certain populations, irrespective of gender. This includes persons with disabilities,Note transgender and gender diverse populations,Note the Indigenous population,Note sexual minorities,Note and population groups designated as visible minorities.Note ,Note These populations were also more likely to experience discrimination in academia (see Table 5 in appendix).
As with harassment, one of the greatest divides was found between people with disabilities and those without, with rates of discrimination being nearly 2.5 times higher for faculty and researchers with a disability (34%) than those without (14%). Similar differences were found between the transgender and gender diverse population compared to the cisgender population. Almost 40% of transgender and gender diverse teaching staff and researchers said they had experienced unfair treatment or discrimination in the past year, compared to 15% who were cisgender.
Rates were also higher among Indigenous teaching staff and researchers, with 28% reporting some type of discrimination. The same was true for 15% of non-Indigenous teaching staff and researchers. For those belonging to a visible minority group, 21% reported experiencing discrimination in the past year, compared to 14% of non-visible minority staff and researchers. This difference contrasts the similarity in rates of harassment between visible minority and non-visible minority teaching staff and researchers.
Identifying as gay or lesbian also elevated risk. The proportion of gay men or lesbian women (22%) who experienced discrimination was one and a half times greater than their heterosexual counterparts (14%). Bi or pan sexual women and women whose sexual orientation was not elsewhere classified were more likely to have experienced discrimination than heterosexual women.
The risk pattern for men and women did vary somewhat for certain characteristics. For example, transgender men report significantly more discrimination in the past year (44%) than cisgender men (11%). This finding was not present among women.
Most common types of unfair treatment vary between men and women
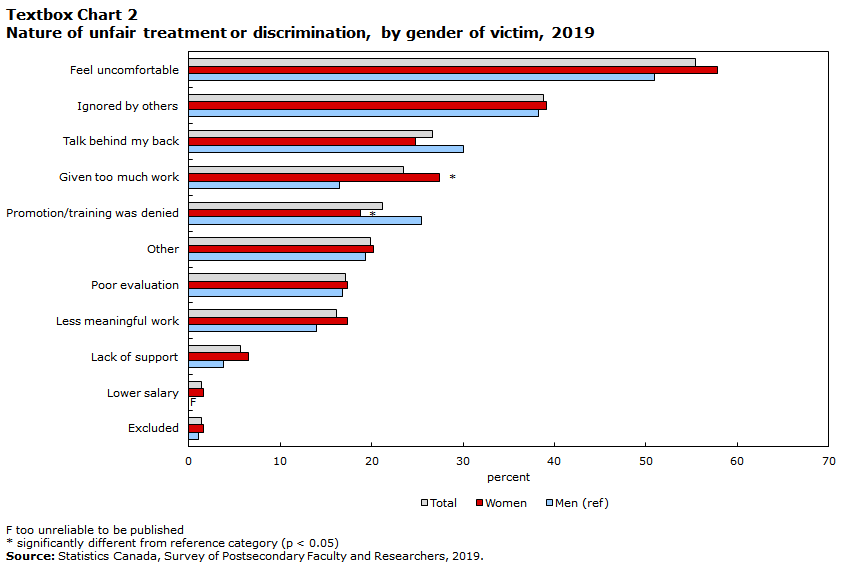
Experiences of unfair treatment or discrimination also include being ignored by others, being given less challenging or less interesting work, receiving poor performance evaluation, or being denied a promotion. These forms of behaviour are particularly concerning given that most countries in the world, including Canada, provide legal protections from gender-based discrimination in promotions.Note
In general, among those who reported having experienced unfair treatment or discrimination in the past year, women were more likely than men to report being given too much work (27% versus 16%) (Textbox Chart 2). Men, meanwhile, were more likely than women to report that their promotion or training was denied (25% versus 19%). For both men and women, the most common type of discrimination was being made to feel uncomfortable: 58% of women and 51% of men reported this type of discrimination. The next most common for both genders was being ignored by others: close to 40% of men and women said this was the basis for their discrimination in the past year.
Data table for Textbox Chart 2
| Type of unfair treatment or discrimination | Total | Women | Men (ref) |
|---|---|---|---|
| percent | |||
| Feel uncomfortable | 55.4 | 57.8 | 50.9 |
| Ignored by others | 38.8 | 39.1 | 38.2 |
| Talk behind my back | 26.6 | 24.8 | 30.0 |
| Given too much work | 23.5 | 27.4Note * | 16.5 |
| Promotion/training was denied | 21.2 | 18.8Note * | 25.5 |
| Other | 19.9 | 20.2 | 19.3 |
| Poor evaluation | 17.1 | 17.3 | 16.8 |
| Less meaningful work | 16.2 | 17.4 | 14.0 |
| Lack of support | 5.6 | 6.5 | 3.8 |
| Lower salary | 1.4 | 1.6 | Note F: too unreliable to be published |
| Excluded | 1.4 | 1.6 | 1.0 |
F too unreliable to be published
|
|||
End of text box 2
Conclusion
Harassment and discrimination exist across Canadian workplaces, occurring in any type of organization, with differing prevalence rates depending on gender and other characteristics. In the current context, harassment and discrimination in Canada's postsecondary institutions were examined, notably those who teach or conduct research in colleges and universities. Using newly collected survey data on this population, this study found multiple instances of gender imbalance in experiences related to harassment and discrimination in the year preceding the 2019 survey. For instance, just over one-third of women across all types of positions (teachers, researchers, postdoctoral fellows and PhD students) reported that they had been harassed in their postsecondary institution in the past year, whereas just over one-fifth of men said the same. This gender difference aligns with previous research examining harassment across all types of workplaces in Canada.
The most common types of harassment were similar for men and women, with women experiencing each type at a higher rate than men. The most common acts of harassment were humiliating behaviours, followed by verbal abuse, threats, and unwanted sexual attention or sexual harassment. The gender difference for unwanted sexual attention or sexual harassment is especially large and is in line with recently collected data on the student body of postsecondary institutions.Note Meanwhile, the most common perpetrators of harassment were individuals in positions of authority and colleagues or peers, but in this case, men and women’s experiences are very similar. In other words, they are harassed by people in similar positions. The exception is with respect to sexual harassment, where women are most likely to be sexually harassed by colleagues or peers, while men are most likely to be sexually harassed by students they teach or supervise.
Patterns in workplace discrimination within the postsecondary setting are very similar to harassment: women were about twice as likely to have experienced discrimination in the past year as men, and the gender difference holds even after adjusting for a wide range of factors.
The vast majority of individuals who have been harassed in the 12 months preceding the survey, in any capacity, said that they took some action regarding the harassment. Action may have been any of these four types: confronting the harasser, reporting the harasser to the authorities, talking with someone at their institution about the harassment, and filing a formal complaint. Women were more likely than men to take some action for the harassment, while some types of harassment elicited more action from both men and women. For example, experiences of physical violence were more likely to lead to actions being taken than verbal abuse or humiliating behaviour. An important finding emerged with respect to unwanted sexual attention and sexual harassment: women, who are by far much more likely than men to have been sexually harassed, were not, however, more likely to take some action.
The current findings help shed light on the state of harassment and discrimination among people who teach and conduct research in Canadian institutes of higher learning. Further study is needed to assess the implications of harassment and discrimination on career progression, as well as how the COVID-19 pandemic shut downs and the corresponding shifts to online working and teaching may impact harassment and discrimination among faculty, graduate students and postdoctoral fellows across Canadian universities, as well as faculty in Canadian colleges.
Darcy Hango is a senior researcher at the Centre for Social Data Insights and Innovation at Statistics Canada.
Appendix
| Total | Men | Women | |
|---|---|---|---|
| percent | |||
| Characteristic | |||
| Gender | |||
| Men | 22.0Note * | Note ...: not applicable | Note ...: not applicable |
| Women (ref) | 33.5 | Note ...: not applicable | Note ...: not applicable |
| Age | |||
| 20 to 34 (ref) | 26.6 | 20.9 | 31.7Table 1 Note † |
| 35 to 44 | 28.1 | 22.7 | 33.2Table 1 Note † |
| 45 to 54 | 28.8 | 21.4 | 35.6Table 1 Note † |
| 55 to 64 | 29.7 | 24.3 | 35.8Table 1 Note † |
| 65+ | 21.5Note * | 19.3 | 25.8 |
| Self-reported Indigenous identification | |||
| Non Indigenous (ref) | 27.4 | 21.8 | 33.2Table 1 Note † |
| Indigenous | 39.7Note * | 32.6 | 45.1Note * |
| Visible minority | |||
| Non visible minority (ref) | 27.9 | 22.0 | 33.4Table 1 Note † |
| Visible minority | 27.1 | 22.0 | 34.0Table 1 Note † |
| Mother tongue | |||
| English (ref) | 29.3 | 22.3 | 35.9Table 1 Note † |
| French | 24.5Note * | 20.6 | 28.1Note *Table 1 Note † |
| Neither French nor English | 26.2 | 22.0 | 31.6Table 1 Note † |
| Multiple languages | 36.4 | 28.2 | 43.2 |
| Gender identity | |||
| Cisgender (ref) | 27.6 | 21.9 | 33.5Table 1 Note † |
| Transgender or nonbinary | 41.9Note * | 50.3Note * | Note F: too unreliable to be published |
| Sexual orientation | |||
| Heterosexual (ref) | 26.6 | 20.8 | 32.5Table 1 Note † |
| Lesbian or gay | 36.1Note * | 34.3Note * | 40.5 |
| Bi sexual or pan sexual | 42.4Note * | 34.3Note * | 46.7Note * |
| Sexual orientation, not elsewhere classified | 45.1Note * | Note F: too unreliable to be published | 45.0 |
| Persons with disabilities | |||
| No (ref) | 26.3 | 21.0 | 31.9Table 1 Note † |
| Yes | 45.6Note * | 37.7Note * | 51.7Note *Table 1 Note † |
| Position and institution information | |||
| Role in postsecondary institution | |||
| PhD student | 25.4 | 20.1 | 30.4Table 1 Note † |
| Postdoctoral Fellow | 20.0Note * | 16.2 | 25.3 |
| Researcher in University | 26.3 | 18.9 | 32.5Table 1 Note † |
| Teacher in University (ref) | 28.2 | 23.1 | 33.9Table 1 Note † |
| Researcher in College | 31.4 | 29.2 | 33.1 |
| Teacher in College | 29.7 | 23.1 | 36.3Table 1 Note † |
| Field of study in which one currently works or studies | |||
| BHASE (NonSTEM) (ref) | 28.8 | 23.1 | 33.3Table 1 Note † |
| STEM | 25.3Note * | 20.5 | 34.1Table 1 Note † |
| Institution information | |||
| Province of institution (grouped) | |||
| Atlantic | 28.2 | 22.1 | 35.2Table 1 Note † |
| Quebec | 25.5 | 21.0 | 30.4Table 1 Note † |
| Ontario (ref) | 26.9 | 21.2 | 32.6Table 1 Note † |
| Prairies | 30.0Note * | 22.5 | 37.6Table 1 Note † |
| British Columbia | 31.1 | 25.7 | 36.4Table 1 Note † |
| Territories | Note F: too unreliable to be published | Note F: too unreliable to be published | Note F: too unreliable to be published |
|
... not applicable F too unreliable to be published
|
|||
| Phd Student/Postdoctoral fellow | Teachers | |||
|---|---|---|---|---|
| Women | Men | Women | Men | |
| percent | ||||
| Harasser was a student | ||||
| Harasser was a woman | 28.2Table 2 Note † | 35.0Table 2 Note † | 41.4Table 2 Note † | 47.6Table 2 Note † |
| Harasser was a man | 79.6 | 74.2 | 68.2 | 66.7 |
| Harasser was an individual with authority | ||||
| Harasser was a woman | 38.1Table 2 Note † | 27.2Table 2 Note † | 49.7 | 48.4 |
| Harasser was a man | 65.7 | 75.4 | 60.4 | 62.9 |
| Harasser was a colleague or peer | ||||
| Harasser was a woman | 27.8Table 2 Note † | 33.6Table 2 Note † | 44.3Table 2 Note † | 44.7Table 2 Note † |
| Harasser was a man | 76.6 | 71.7 | 65.9 | 65.9 |
|
||||
| Men | ||||
|---|---|---|---|---|
| Confronted harasser | Reported harasser to authorities | Talked with someone at their institution | Filed a formal complaint | |
| percent | ||||
| Physical violence | 57.8 | 64.5 | 51.4 | 25.7 |
| Unwanted sexual attention/sexual harassment | 40.4 | 27.4 | 39.2 | 18.4 |
| Threats to person | 34.9 | 43.7Table 3 Note † | 43.3Table 3 Note † | 15.2 |
| Verbal abuse | 39.3 | 34.4Table 3 Note † | 37.4Table 3 Note † | 9.1 |
| Humiliating behaviour | 31.8 | 27.6 | 34.3Table 3 Note † | 9.3 |
| Across all types | 32.9 | 28.1 | 32.8Table 3 Note † | 7.6 |
|
||||
| Women | ||||
|---|---|---|---|---|
| Confronted harasser | Reported harasser to authorities | Talked with someone at their institution | Filed a formal complaint | |
| percent | ||||
| Physical violence | 34.4 | 77.3 | 62.5 | 23.8 |
| Unwanted sexual attention/sexual harassment | 37.5 | 29.0 | 44.3 | 8.1 |
| Threats to person | 36.7 | 59.1Table 4 Note † | 57.2Table 4 Note † | 15.8 |
| Verbal abuse | 43.4 | 42.2Table 4 Note † | 45.1Table 4 Note † | 9.4 |
| Humiliating behaviour | 36.3 | 33.2 | 44.5Table 4 Note † | 7.4 |
| Across all types | 36.1 | 33.3 | 40.9Table 4 Note † | 7.1 |
|
||||
| Total | Men | Women | |
|---|---|---|---|
| percent | |||
| Characteristic | |||
| Gender | |||
| Men | 10.8Note * | Note ...: not applicable | Note ...: not applicable |
| Women (ref) | 20.1 | Note ...: not applicable | Note ...: not applicable |
| Age | |||
| 20 to 34 (ref) | 15.5 | 9.9 | 20.6Table 5 Note † |
| 35 to 44 | 16.4 | 10.6 | 21.8Table 5 Note † |
| 45 to 54 | 15.3 | 10.3 | 19.7Table 5 Note † |
| 55 to 64 | 15.3 | 11.6 | 19.6Table 5 Note † |
| 65+ | 12.7 | 12.2 | 13.7 |
| Self-reported Indigenous identification | |||
| Non Indigenous (ref) | 15.1 | 10.7 | 19.8Table 5 Note † |
| Indigenous | 27.6Note * | 19.2Note * | 33.6Note * |
| Visible minority | |||
| Non visible minority (ref) | 13.7 | 9.2 | 17.9Table 5 Note † |
| Visible minority | 21.2Note * | 15.6Note * | 28.9Note *Table 5 Note † |
| Mother tongue | |||
| English (ref) | 15.8 | 10.0 | 21.3Table 5 Note † |
| French | 9.4Note * | 7.8 | 11.0Note * |
| Neither French nor English | 18.5Note * | 13.8Note * | 24.6Table 5 Note † |
| Multiple languages | 22.1Note * | 17.0Note * | 26.3 |
| Gender identity | |||
| Cisgender (ref) | 15.3 | 10.6 | 20.0Table 5 Note † |
| Transgender or nonbinary | 36.3Note * | 44.2Note * | Note F: too unreliable to be published |
| Sexual orientation | |||
| Heterosexual (ref) | 14.4 | 10.2 | 18.7Table 5 Note † |
| Lesbian or gay | 21.6Note * | 17.9Note * | 30.4Note * |
| Bi sexual or pan sexual | 29.8Note * | 14.3 | 37.9Note *Table 5 Note † |
| Sexual orientation, not elsewhere classified | 32.8Note * | Note F: too unreliable to be published | 35.1Note * |
| Persons with disabilities | |||
| No (ref) | 13.9 | 10.1 | 18.0Table 5 Note † |
| Yes | 33.8Note * | 22.0Note * | 43.0Note *Table 5 Note † |
| Position and institution information | |||
| Role in postsecondary institution | |||
| PhD student | 16.8 | 11.5 | 21.7Table 5 Note † |
| Postdoctoral Fellow | 15.0 | 10.3 | 21.6Table 5 Note † |
| Researcher in University | 18.1 | 13.0 | 22.3 |
| Teacher in University (ref) | 16.4 | 10.8 | 22.7Table 5 Note † |
| Researcher in College | 18.8 | 14.1 | 22.7 |
| Teacher in College | 12.1Note * | 9.8 | 14.4Note *Table 5 Note † |
| Field of study in which one currently works or studies | |||
| BHASE (NonSTEM) (ref) | 16.2 | 11.8 | 19.6Table 5 Note † |
| STEM | 13.7Note * | 9.4Note * | 21.5Table 5 Note † |
| Institution information | |||
| Province of institution (grouped) | |||
| Atlantic | 15.6 | 13.0 | 18.6Table 5 Note † |
| Quebec | 11.0Note * | 8.6 | 13.6Note *Table 5 Note † |
| Ontario (ref) | 16.2 | 11.0 | 21.5Table 5 Note † |
| Prairies | 18.7 | 12.6 | 24.9Table 5 Note † |
| British Columbia | 17.1 | 11.3 | 22.8Table 5 Note † |
| Territories | Note F: too unreliable to be published | Note F: too unreliable to be published | Note F: too unreliable to be published |
|
... not applicable F too unreliable to be published
|
|||
| Characteristic | percent |
|---|---|
| Gender | |
| Men | 50.6 |
| Women | 49.4 |
| Age | |
| 20 to 34 | 21.4 |
| 35 to 44 | 24.6 |
| 45 to 54 | 23.1 |
| 55 to 64 | 21.6 |
| 65+ | 9.4 |
| Self-reported Indigenous identification | |
| Non Indigenous | 98.1 |
| Indigenous | 1.9 |
| Visible minority | |
| No | 77.6 |
| Yes | 22.4 |
| Mother tongue | |
| English | 51.9 |
| French | 19.8 |
| Neither French nor English | 25.9 |
| Multiple languages | 2.4 |
| Gender identity | |
| Cisgender | 99.5 |
| Transgender or nonbinary | 0.5 |
| Sexual orientation | |
| Heterosexual | 91.8 |
| Lesbian or gay | 4.0 |
| Bi sexual or pan sexual | 3.5 |
| Sexual orientation, not elsewhere classified | 0.7 |
| Persons with disabilities | |
| No | 92.6 |
| Yes | 7.4 |
| Role in postsecondary institution | |
| PhD student | 17.4 |
| Postdoctoral fellow | 3.7 |
| Researcher in University | 8.2 |
| Teacher in University | 39.5 |
| Researcher in College | 0.9 |
| Teacher in College | 27.4 |
| Role in both college and university | 2.9 |
| Highest level of completed education | |
| Earned Doctorate | 35.2 |
| Master's Degree | 39.4 |
| Degree in medicine, dentistry, veterinary medicine or optometry | 3.7 |
| Bachelor's Degree | 16.3 |
| College, other non-university certifcate or diploma, or Trades certificate/diploma | 5.3 |
| Field of study in which one currently works or studies | |
| BHASE (NonSTEM) | 67.7 |
| STEM | 32.3 |
| Province of institution (grouped) | |
| Atlantic | 6.7 |
| Quebec | 25.2 |
| Ontario | 38.8 |
| Prairies | 16.3 |
| British Colombia | 12.9 |
| Territories | 0.2 |
| Source: Statistics Canada, Survey of Postsecondary Faculty and Researchers, 2019. | |
| Total | Men | Women | |
|---|---|---|---|
| marginal effects | |||
| Characteristic | |||
| Gender | |||
| Men | -0.110Note * | Note ...: not applicable | Note ...: not applicable |
| Women (ref) | Note ...: not applicable | Note ...: not applicable | Note ...: not applicable |
| Age | |||
| 20 to 34 (ref) | Note ...: not applicable | Note ...: not applicable | Note ...: not applicable |
| 35 to 44 | -0.001 | -0.004 | 0.001 |
| 45 to 54 | -0.008 | -0.029 | 0.010 |
| 55 to 64 | 0.005 | -0.004 | 0.014 |
| 65+ | -0.062Note * | -0.051 | -0.079Note * |
| Self-reported Indigenous identification | |||
| Non Indigenous (ref) | Note ...: not applicable | Note ...: not applicable | Note ...: not applicable |
| Indigenous | 0.084Note * | 0.068 | 0.096Note * |
| Visible minority | |||
| Non visible minority (ref) | Note ...: not applicable | Note ...: not applicable | Note ...: not applicable |
| Visible minority | 0.024 | 0.016 | 0.032 |
| Mother tongue | |||
| English (ref) | Note ...: not applicable | Note ...: not applicable | Note ...: not applicable |
| French | -0.043Note * | -0.013 | -0.070Note * |
| Neither French nor English | -0.013 | 0.016 | -0.042 |
| Multiple languages | 0.065 | 0.054 | 0.081 |
| Gender identity | |||
| Cisgender (ref) | Note ...: not applicable | Note ...: not applicable | Note ...: not applicable |
| Transgender or nonbinary | 0.045 | 0.158 | -0.141 |
| Sexual orientation | |||
| Heterosexual (ref) | Note ...: not applicable | Note ...: not applicable | Note ...: not applicable |
| Lesbian or gay | 0.115Note * | 0.125Note * | 0.071 |
| Bi sexual or pan sexual | 0.121Note * | 0.115 | 0.125Note * |
| Sexual orientation, not elsewhere classified | 0.101 | 0.129 | 0.076 |
| Persons with disabilities | |||
| No (ref) | Note ...: not applicable | Note ...: not applicable | Note ...: not applicable |
| Yes | 0.165Note * | 0.150Note * | 0.186Note * |
| Position and institution information | |||
| Role in postsecondary institution | |||
| PhD student | -0.057Note * | -0.060Note * | -0.055Note * |
| Postdoctoral fellow | -0.097Note * | -0.091Note * | -0.109Note * |
| Researcher in University | -0.050Note * | -0.062Note * | -0.044 |
| Teacher in University (ref) | Note ...: not applicable | Note ...: not applicable | Note ...: not applicable |
| Researcher in College | 0.015 | 0.056 | -0.013 |
| Teacher in College | 0.014 | -0.002 | 0.030 |
| Field of Study in which one currently works or studies | |||
| BHASE (NonSTEM) (ref) | Note ...: not applicable | Note ...: not applicable | Note ...: not applicable |
| STEM | 0.010 | -0.009 | 0.037Note * |
| Institution information | |||
| Province of institution (grouped) | |||
| Atlantic | 0.020 | 0.007 | 0.032 |
| Quebec | 0.027 | 0.016 | 0.036 |
| Ontario (ref) | Note ...: not applicable | Note ...: not applicable | Note ...: not applicable |
| Prairies | 0.038Note * | 0.017 | 0.061Note * |
| British Columbia | 0.044Note * | 0.049Note * | 0.041 |
| Territories | -0.007 | 0.057 | -0.061 |
... not applicable
|
|||
| Total | Men | Women | |
|---|---|---|---|
| marginal effects | |||
| Characteristic | |||
| Gender | |||
| Men | -0.092Note * | Note ...: not applicable | Note ...: not applicable |
| Women (ref) | Note ...: not applicable | Note ...: not applicable | Note ...: not applicable |
| Age | |||
| 20 to 34 (ref) | Note ...: not applicable | Note ...: not applicable | Note ...: not applicable |
| 35 to 44 | 0.020 | 0.013 | 0.027 |
| 45 to 54 | 0.010 | 0.013 | 0.006 |
| 55 to 64 | 0.021 | 0.034 | 0.009 |
| 65+ | 0.011 | 0.053Note * | -0.051 |
| Self-reported Indigenous identification | |||
| Non Indigenous (ref) | Note ...: not applicable | Note ...: not applicable | Note ...: not applicable |
| Indigenous | 0.110Note * | 0.091Note * | 0.131Note * |
| Visible minority | |||
| Non visible minority (ref) | Note ...: not applicable | Note ...: not applicable | Note ...: not applicable |
| Visible minority | 0.089Note * | 0.072Note * | 0.109Note * |
| Mother tongue | |||
| English (ref) | Note ...: not applicable | Note ...: not applicable | Note ...: not applicable |
| French | -0.038Note * | -0.005 | -0.071Note * |
| Neither French nor English | 0.007 | 0.022 | -0.010 |
| Multiple languages | 0.027 | 0.042 | 0.012 |
| Gender identity | |||
| Cisgender (ref) | Note ...: not applicable | Note ...: not applicable | Note ...: not applicable |
| Transgender or nonbinary | 0.106 | 0.270Note * | -0.087 |
| Sexual orientation | |||
| Heterosexual (ref) | Note ...: not applicable | Note ...: not applicable | Note ...: not applicable |
| Lesbian or gay | 0.084Note * | 0.076Note * | 0.089 |
| Bi sexual or pan sexual | 0.099Note * | 0.010 | 0.144Note * |
| Sexual orientation, not elsewhere classified | 0.074 | 0.052 | 0.071 |
| Persons with disabilities | |||
| No (ref) | Note ...: not applicable | Note ...: not applicable | Note ...: not applicable |
| Yes | 0.164Note * | 0.106Note * | 0.215Note * |
| Position and institution information | |||
| Role in postsecondary institution | |||
| PhD student | -0.020 | 0.005 | -0.045Note * |
| Postdoctoral Fellow | -0.025 | 0.001 | -0.052 |
| Researcher in University | -0.012 | 0.022 | -0.044 |
| Teacher in University (ref) | Note ...: not applicable | Note ...: not applicable | Note ...: not applicable |
| Researcher in College | 0.009 | 0.048 | -0.018 |
| Teacher in College | -0.040Note * | -0.006 | -0.077Note * |
| Field of study in which one currently works or studies | |||
| BHASE (NonSTEM) (ref) | Note ...: not applicable | Note ...: not applicable | Note ...: not applicable |
| STEM | -0.014 | -0.032Note * | 0.010 |
| Institution information | |||
| Province of institution (grouped) | |||
| Atlantic | 0.007 | 0.032Note * | -0.020 |
| Quebec | -0.008 | -0.007 | -0.006 |
| Ontario (ref) | Note ...: not applicable | Note ...: not applicable | Note ...: not applicable |
| Prairies | 0.029Note * | 0.022 | 0.036Note * |
| British Columbia | 0.010 | 0.007 | 0.014 |
| Territories | -0.033 | 0.052 | -0.111Note * |
... not applicable
|
|||
Start of text box 3
Data sources, methods and definitions
The Survey of Postsecondary Faculty and Researchers (SPFR) conducted in 2019 was sponsored by Innovation, Science and Economic Development Canada. The SPFR aims to fill data gaps on equity, diversity, and inclusion among those who teach or conduct research in Canada's postsecondary sector, including full- and part-time university faculty, college instructors, postdoctoral fellows and doctoral students. It provides estimates of how various diversity characteristics—such as gender, visible minority status, Indigenous identity, self-reported disability, sexual orientation, use of official languages and others—may influence career experiences and affect career advancement of the survey respondents in the Canadian academic community. In the absence of a complete survey frame that lists all post-secondary institutions, faculty and researchers, several files were combined—including tax data, census, Postsecondary Student Information System, immigration, and research funding data sets—to create a survey frame.
The survey population was selected from this survey frame. Survey weights were adjusted to account for non-respondents, but were not further calibrated due to the unavailability of external control totals that were aligned with the coverage of the survey population. As a result, the survey results are only representative of the surveyed population, not necessarily the targeted population. Due to the methodology used, survey results cannot be released for individual post-secondary institutions.
Full and part-time university faculty (including teaching staff and researchers), college instructors, postdoctoral fellows, and doctoral students were contacted via email or mail, and invited to complete the survey online via Electronic Questionnaire (EQ) self-response between October 7 and December 10, 2019. The sample size is around 27,000. The sample was evenly distributed in terms of gender (49% women, 51% men), while the largest percentage in terms of role at one's institution was 40% for teachers in university (see Table 6 in appendix). Around 27% were teachers in college, while about 4% were postdoctoral fellows and 18% were PhD students. Researchers at colleges and universities made up the minority of the sample.
In the SPFR, information on sex at birth and gender are both collected. For confidentiality reasons, and given the small size of the populations concerned, it is not possible to publish data for the gender diverse population for this survey. As a result, it was necessary to derive a two-category gender variable.
End of text box 3
- Date modified: