
Insights on Canadian Society
Results from the 2016 Census: Examining the effect of public pension benefits on the low income of senior immigrants
by Wendy Kei, Marc-David L. Seidel, Dennis Ma and Marjan Houshmand

Skip to text
Start of text box

Today, Insights on Canadian Society is releasing a study based on 2016 Census data. This study uses census information on immigration and income to better understand the factors associated with low income among senior immigrants.
End of text box
Start of text box
Overview of the study
Among immigrants who came to Canada recently, some are seniors over the age of 65. This study examines the factors associated with the low-income rate of senior immigrants, with a focus on access to Old Age Security (OAS) and Guaranteed Income Supplement (GIS) benefits.
- In 2016, senior immigrants represented 31% of the total senior population over the age of 65. Of all Canadian seniors, about 2% were senior immigrants who landed in Canada 1 to 10 years before the 2016 Census, and another 2% landed in the 11 to 20 years before the 2016 Census.
- The income of senior immigrants who landed 1 to 10 years before the census mostly came from private pension or employment sources. This contrasts with other senior immigrants, whose income came mostly from public pension sources.
- The proportion of senior immigrants who were in low income was 24% of those who landed 1 to 10 years prior to the Census and 26% of those who landed 11 to 20 years prior to the Census. This compared with 11% of senior immigrants who had been in Canada for over 40 years and 14% of non-immigrant seniors.
- Among senior immigrants who landed within the two decades preceding the Census, those who had access to OAS/GIS benefits were 7 percentage points less likely to be in low income than those who did not have access to such benefits, after accounting for other factors. Other factors, such as homeownership, household type, and benefiting from a social security agreement with Canada, were also related to the low income of senior immigrants.
End of text box
Introduction
In Canada, recent immigrants over the age of 65 are often seen as financially vulnerable, and are more likely to be represented within the low-income population.Note According to the 2016 Census, approximately one quarter of new immigrants aged 65 and over (i.e., who landed between 2006 and 2015) were in low income in 2016, almost double the figure for non-immigrants and their counterparts who immigrated earlier (i.e., more than 40 years before the census).
Some studies have documented a decline in the Canadian low-income rate at retirement age since the early 1970s.Note These studies have attributed this decline to the expansion of public pension programs. Over the past 15 years, however, the low-income rate based on the low income measure after tax (or LIM-AT) has been rising for seniors, while the fixed low income measure remained stable. The LIM-AT defines individuals as having low income if their adjusted after-tax income falls below 50% of the median adjusted after-tax income.Note This suggests that low income remained low for seniors in the absolute sense, but increased recently in the relative sense.
In Canada, the income security of seniors is guaranteed by the Canadian Old Age Security (OAS) program, a monthly benefit paid to all seniors aged 65 and over who have Canadian citizenship or permanent residency status. The Guaranteed Income Supplement (GIS) is a supplementary benefit that provides a monthly non-taxable benefit for low-income OAS pension recipients living in Canada.Note Recent immigrants, however, are often not eligible for these programs because seniors must have lived in Canada for at least 10 years since age 18 to qualify for OAS pensions. These immigrants have minimal access to the Canadian public pension system because of short work and residence histories in Canada.
Research on immigration tends to focus on economic integration and income inequality for the general immigrant population.Note While previous work has shown segmented pathways of incorporation based on immigration categories and demographics,Note few studies have directly estimated how public pension policies affect senior immigrants who landed recently.Note Unlike previous studies, this paper uses various empirical strategies to gauge the effect of OAS program entitlement (along with other factors) on the low income of senior immigrants over the age of 65, with a focus on those who landed in the country more recently.Note
This paper uses the 2016 Census of Population. In addition to having detailed income information from administrative data sources, the 2016 Census contains various immigration-related variables, including information on admission categories, collected for the first time in 2016. Low-income rates are based on the low-income measure, after tax (LIM-AT), which represents the proportion of individuals whose adjusted after-tax household income is less than one-half of the median Canadian after-tax household income.Note The relationship between the Canadian OAS pension entitlements and low-income measures is estimated using regression techniques (see the Data sources, methods and definitions section).
Recent senior immigrants who came via business programs depend on private retirement income sources
Table 1 shows the proportion of the population over the age of 65 who were immigrants in 2016. Overall, 31% of this population were immigrants, 20% of whom (about two-thirds) were senior immigrants who landed over 40 years ago. About 8% landed between 21 and 40 years before the census, 2% landed 11 to 20 years before, and another 2% landed within the previous decade. Although relatively small in terms of percentages, senior immigrants who landed in the two previous decades account for a relatively large number of people in absolute size. In 2016, 93,700 senior immigrants had landed 1 to 10 years before the census (i.e., between 2006 and 2015), and another 115,100 had landed 11 to 20 years before (i.e., between 1996 and 2005).Note
| Population of immigrants | ||
|---|---|---|
| percent | number | |
| Total, both sexes | 31 | 1,566,900 |
| 1 to 10 years | 2 | 93,700 |
| 11 to 20 years | 2 | 115,100 |
| 21 to 30 years | 4 | 189,300 |
| 31 to 40 years | 4 | 175,600 |
| Over 40 years | 20 | 993,300 |
| Total, men | 31 | 731,100 |
| 1 to 10 years | 2 | 41,300 |
| 11 to 20 years | 2 | 51,000 |
| 21 to 30 years | 4 | 84,400 |
| 31 to 40 years | 4 | 81,500 |
| Over 40 years | 20 | 473,000 |
| Total, women | 31 | 835,800 |
| 1 to 10 years | 2 | 52,400 |
| 11 to 20 years | 2 | 64,100 |
| 21 to 30 years | 4 | 104,800 |
| 31 to 40 years | 4 | 94,100 |
| Over 40 years | 19 | 520,300 |
|
||
Table 2 shows the distribution of individuals over the age of 65 by selected demographic characteristics and immigration status. Overall, the distributions for age, education and activity limitations were relatively similar across immigrant and non-immigrant groups. More than half of recent senior immigrants (1 to 10 years since immigration) did not speak English or French, while almost all (95%) of those who had been in the country for over 40 years reported being able to speak English or French. More than 70% of senior immigrants who landed in the two decades prior to Census were admitted under sponsorship programs (including family-sponsored categories).
| Non-immigrant population | Years since immigration | |||||
|---|---|---|---|---|---|---|
| 1 to 10 years | 11 to 20 years | 21 to 30 years | 31 to 40 years | Over 40 years | ||
| percent | ||||||
| Age group | ||||||
| 66 to 75 years | 64 | 71 | 63 | 61 | 67 | 54 |
| 76 to 85 years | 29 | 26 | 31 | 29 | 24 | 35 |
| 86 years and over | 8 | 3 | 6 | 9 | 9 | 11 |
| Education | ||||||
| High school diploma or lower | 56 | 55 | 62 | 62 | 51 | 52 |
| Some college or university education | 30 | 17 | 15 | 19 | 28 | 31 |
| Bachelor’s degree or higher | 14 | 28 | 22 | 19 | 21 | 17 |
| Knowledge of an official languageTable 2 Note 2 | ||||||
| English only | 63 | 41 | 50 | 60 | 70 | 82 |
| French only | 20 | 3 | 3 | 4 | 6 | 3 |
| Both English and French | 17 | 2 | 3 | 4 | 8 | 10 |
| Neither English nor French | 0 | 54 | 45 | 32 | 15 | 5 |
| Household type | ||||||
| Single-person | 29 | 5 | 11 | 15 | 20 | 25 |
| Couple without children | 56 | 20 | 26 | 33 | 44 | 51 |
| Couple with children | 6 | 25 | 25 | 23 | 18 | 11 |
| Lone-parent | 5 | 6 | 7 | 8 | 8 | 6 |
| Other household typesTable 2 Note 3 | 4 | 44 | 32 | 20 | 10 | 6 |
| Immigrant admission categoryTable 2 Note 4 | ||||||
| Worker programs and provincial/territorial nominees | Note ...: not applicable | 4 | 12 | 30 | 43 | Note ...: not applicable |
| Business programsTable 2 Note 5 | Note ...: not applicable | 2 | 7 | 12 | 9 | Note ...: not applicable |
| Sponsored immigrants | Note ...: not applicable | 86 | 72 | 45 | 32 | Note ...: not applicable |
| Refugees | Note ...: not applicable | 9 | 9 | 13 | 17 | Note ...: not applicable |
| Source country or region | ||||||
| China | Note ...: not applicable | 24 | 17 | 15 | 9 | 3 |
| South AsiaTable 2 Note 6 | Note ...: not applicable | 26 | 29 | 16 | 7 | 4 |
| European countries | Note ...: not applicable | 14 | 17 | 17 | 35 | 71 |
| Latin American countries | Note ...: not applicable | 7 | 7 | 12 | 15 | 8 |
| Rest of the world | Note ...: not applicable | 29 | 30 | 40 | 34 | 14 |
| Activity limitation | ||||||
| Yes | 55 | 57 | 61 | 60 | 58 | 59 |
| No | 45 | 43 | 39 | 40 | 42 | 41 |
... not applicable
|
||||||
In contrast, roughly half of older immigrants who arrived earlier (at least 20 years since immigration) were admitted through worker programs or as candidates of provincial and territorial programs.Note These results are expected, because senior immigrants with more time spent in Canada likely came as younger adults and were therefore more likely to be admitted as skilled immigrants. Senior immigrants with fewer years in Canada were relatively older when they immigrated and therefore were more likely to be sponsored by other family members.
The source countries of immigrant seniors also varied by time spent in Canada. In 2016, 50% of recent immigrants (1 to 10 years since immigration) were from China or South Asia (i.e., Bangladesh, India, Pakistan or Sri Lanka). Conversely, immigrants who landed earlier (i.e., those who immigrated over 40 years ago) were primarily from European countries.
Senior immigrants who landed within the decade before the 2016 Census received little income from public pension sources
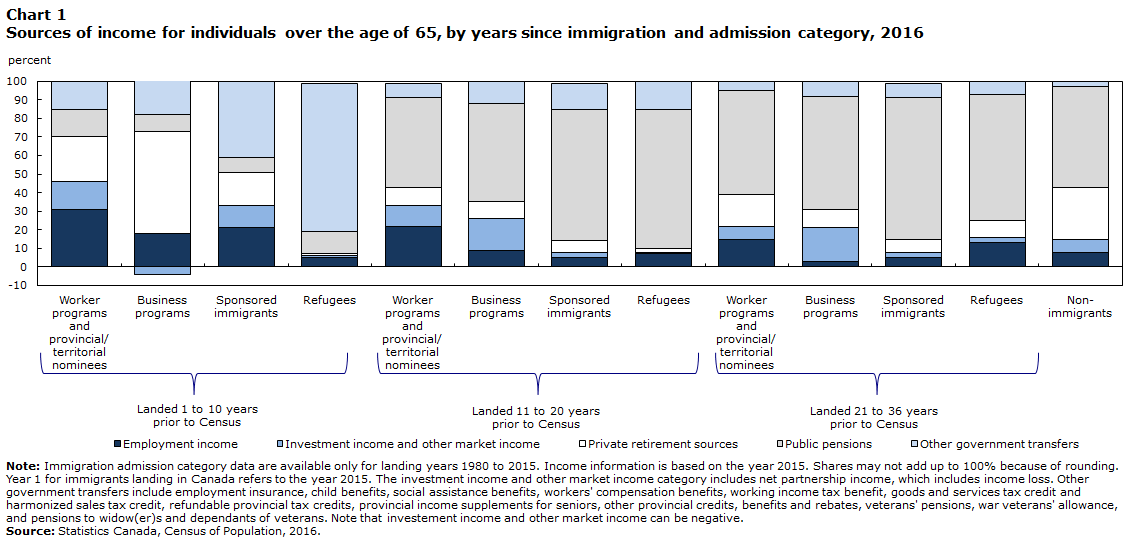
Similar to non-immigrants, more than half of the income sources for senior immigrants who have been in Canada for at least 11 years came from the Canadian public pension system (Chart 1). These include the OAS pension and its supplementary benefits (i.e., GIS, Allowance for the Survivor and Spouse’s Allowance) as well as the Canada Pension Plan (CPP) and Quebec Pension Plan (QPP). In particular, sponsored immigrants exhibited the largest dependence on public pension benefits. Generally, seniors aged 65 and over are eligible for an OAS pension if they have lived in Canada for at least 10 years (since the age of 18). CPP and QPP benefits depend on accumulated earnings and can become available starting at age 60. Therefore, senior immigrants who landed more recently are expected to have minimal public pension benefits because of short work and residence histories in Canada. This explains the relatively low share of income from public pensions among this group.
Data table for Chart 1
| Years since immigration | Immigrant admission category | Source of income | ||||
|---|---|---|---|---|---|---|
| Employment income | Investment income and other market income | Private retirement sources | Public pensions | Other government transfers | ||
| percent | ||||||
| 1 to 10 years | Worker programs and provincial/ territorial nominees | 31 | 15 | 24 | 15 | 15 |
| Business programs | 18 | -4 | 55 | 9 | 22 | |
| Sponsored immigrants | 21 | 12 | 18 | 8 | 41 | |
| Refugees | 5 | 1 | 1 | 12 | 80 | |
| 11 to 20 years | Worker programs and provincial/ territorial nominees | 22 | 11 | 10 | 48 | 8 |
| Business programs | 9 | 17 | 9 | 53 | 12 | |
| Sponsored immigrants | 5 | 3 | 6 | 71 | 14 | |
| Refugees | 7 | 1 | 2 | 75 | 15 | |
| 21 to 36 years | Worker programs and provincial/ territorial nominees | 15 | 7 | 17 | 56 | 5 |
| Business programs | 3 | 18 | 10 | 61 | 8 | |
| Sponsored immigrants | 5 | 3 | 7 | 76 | 8 | |
| Refugees | 13 | 3 | 9 | 68 | 7 | |
| Non-immigrants | 8 | 7 | 28 | 54 | 3 | |
|
Note: Immigration admission category data are available only for landing years 1980 to 2015. Income information is based on the year 2015. Shares may not add up to 100% because of rounding. Year 1 for immigrants landing in Canada refers to the year 2015. The investment income and other market income category includes net partnership income, which includes income loss. Other government transfers include employment insurance, child benefits, social assistance benefits, workers' compensation benefits, working income tax benefit, goods and services tax credit and harmonized sales tax credit, refundable provincial tax credits, provincial income supplements for seniors, other provincial credits, benefits and rebates, veterans' pensions, war veterans' allowance, and pensions to widow(er)s and dependants of veterans. Note that investement income and other market income can be negative. Source: Statistics Canada, Census of Population, 2016. |
||||||
Among senior immigrants who landed 1 to 10 years ago, income sources varied across admission categories. Among immigrants in the business programs category, private retirement income was the main source of income, representing 55% of their income, on average.Note Among recent senior immigrants who were admitted in worker programs or as candidates of provinces and territories, income came mostly from employment income sources (31%), while government transfers (other than those from public pensions) represented the largest source of income for recent senior immigrants who were sponsored or who came as refugees.Note Among refugees, in particular, other government sources accounted for 80% of their income on average.
Almost all immigrants receive Old Age Security or Guaranteed Income Supplement benefits once they meet the residency requirements
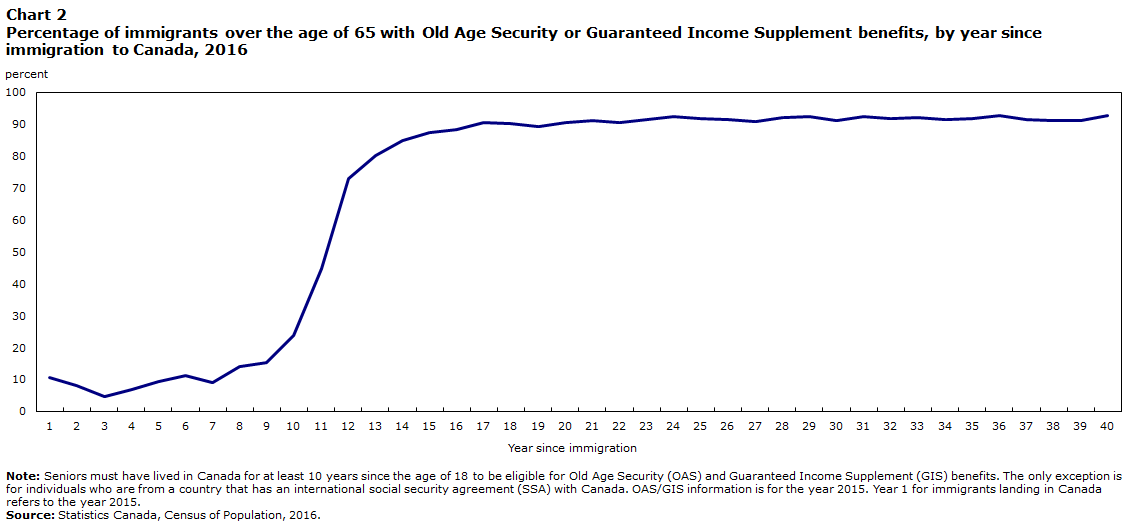
Chart 2 illustrates the share of immigrants over the age of 65 who received OAS/GIS benefits in 2015 by each year since immigration to Canada. Years of residence information is unavailable in the 2016 Census. This study uses the year since immigration measure as a proxy for the duration of stay in Canada.Note
Data table for Chart 2
| Year since immigration | Percent |
|---|---|
| 1 | 11 |
| 2 | 8 |
| 3 | 5 |
| 4 | 7 |
| 5 | 9 |
| 6 | 11 |
| 7 | 9 |
| 8 | 14 |
| 9 | 15 |
| 10 | 24 |
| 11 | 45 |
| 12 | 73 |
| 13 | 80 |
| 14 | 85 |
| 15 | 88 |
| 16 | 88 |
| 17 | 91 |
| 18 | 90 |
| 19 | 89 |
| 20 | 91 |
| 21 | 91 |
| 22 | 91 |
| 23 | 91 |
| 24 | 92 |
| 25 | 92 |
| 26 | 91 |
| 27 | 91 |
| 28 | 92 |
| 29 | 92 |
| 30 | 91 |
| 31 | 92 |
| 32 | 92 |
| 33 | 92 |
| 34 | 92 |
| 35 | 92 |
| 36 | 93 |
| 37 | 92 |
| 38 | 91 |
| 39 | 91 |
| 40 | 93 |
|
Note: Seniors must have lived in Canada for at least 10 years since the age of 18 to be eligible for Old Age Security (OAS) and Guaranteed Income Supplement (GIS) benefits. The only exception is for individuals who are from a country that has an international social security agreement (SSA) with Canada. OAS/GIS information is for the year 2015. Year 1 for immigrants landing in Canada refers to the year 2015. Source: Statistics Canada, Census of Population, 2016. |
|
Among senior immigrants who landed 1 to 10 years ago, few received OAS/GIS benefits in 2015. Applicants could still meet the residency requirement for OAS through a social security agreement (SSA) even if they had less than 10 years of residency in Canada since an SSA allows the periods of contributions and residence in Canada to be added together with those in a signatory country for OAS/GIS benefits. Therefore, the non-zero values for immigrants in Canada less than 10 years correspond with individuals who received foreign-based and OAS/GIS pension benefits through an SSA.Note
The OAS incidence rate increased from 24% in year 10 to 45% in year 11, and then to 73% in year 12. The share of OAS recipients then stayed at around 90% for all years since immigration after year 15. Although the Government of Canada allows applicants to defer receipt of OAS benefits in exchange for a larger payment amount, the pattern in Chart 2 reveals that most senior immigrants do not delay receipt of this benefit. Conversely, approximately 10% of eligible senior immigrants did not receive OAS benefits.Note Note
Overall, charts 1 and 2 provide evidence that recently arrived senior immigrants have minimal income from the Canadian public pension systems—which distinguishes them from the rest of the senior population. The next section explores whether this subgroup is more financially vulnerable than the comparison groups, and the factors that could influence low-income rates among senior immigrants.
The low-income rate of senior immigrants who landed recently was nearly twice as high as that of non-immigrant seniors
Table 3 shows the low-income rates for individuals over the age of 65 based on the LIM-AT. Overall, the low-income rate for senior immigrants who landed 1 to 30 years prior to the Census was nearly two times higher than that of their non-immigrant counterparts. Newer immigrants (those who landed 1 to 10 years ago) are generally ineligible for an OAS pension because of residency requirements and may not have accumulated sufficient earnings for the CPP and QPP given their short Canadian work histories.Note However, table 3 shows that newer immigrants who previously lived or were born in a country that has an SSA with Canada had lower low-income rates because these individuals can take advantage of the OAS pension and its supplementary benefits.
| Non-immigrant population | Immigrant population, number of years since immigration | |||||
|---|---|---|---|---|---|---|
| 1 to 10 years | 11 to 20 years | 21 to 30 years | 31 to 40 years | Over 40 years | ||
| percent | ||||||
| Total | 14 | 24 | 26 | 27 | 18 | 11 |
| Sex | ||||||
| Male | 11 | 25 | 25 | 26 | 15 | 9 |
| Female | 17 | 23 | 26 | 28 | 20 | 13 |
| Education | ||||||
| High school diploma or lower | 19 | 22 | 23 | 28 | 22 | 13 |
| Some college or university education | 10 | 25 | 30 | 27 | 15 | 9 |
| Bachelor’s degree or higher | 4 | 25 | 31 | 24 | 11 | 6 |
| Knowledge of an official languageTable 3 Note 2 | ||||||
| English only | 12 | 21 | 24 | 25 | 15 | 10 |
| French only | 22 | 31 | 37 | 42 | 30 | 16 |
| Both English and French | 12 | 28 | 27 | 29 | 16 | 11 |
| Neither English nor French | 26 | 25 | 26 | 29 | 27 | 17 |
| Presence of self-employment by other household members | ||||||
| Yes | 7 | 15 | 10 | 10 | 9 | 7 |
| No | 15 | 26 | 29 | 29 | 19 | 11 |
| Household type | ||||||
| Single-person | 33 | 73 | 76 | 70 | 48 | 27 |
| Couple without children | 6 | 54 | 46 | 36 | 13 | 5 |
| Couple with children | 4 | 14 | 10 | 9 | 6 | 4 |
| Lone-parent | 13 | 26 | 21 | 19 | 15 | 11 |
| Other household typesTable 3 Note 3 | 5 | 9 | 6 | 5 | 5 | 3 |
| Presence of other household members aged 26 to 64 | ||||||
| Yes | 8 | 13 | 10 | 10 | 8 | 6 |
| No | 16 | 65 | 61 | 49 | 25 | 13 |
| Presence of other household members in the labour force | ||||||
| Yes | 4 | 11 | 7 | 6 | 5 | 4 |
| No | 17 | 67 | 61 | 52 | 27 | 13 |
| Presence of other adult household members who are non-immigrants or who landed over 40 years ago | ||||||
| Yes | Note ...: not applicable | 8 | 5 | 5 | 5 | 5 |
| No | Note ...: not applicable | 26 | 30 | 33 | 24 | 24 |
| Immigrant admission categoryTable 3 Note 4 | ||||||
| Worker programs and provincial/territorial nominees | Note ...: not applicable | 25 | 25 | 23 | 17 | Note ...: not applicable |
| Business programsTable 3 Note 5 | Note ...: not applicable | 44 | 38 | 36 | 22 | Note ...: not applicable |
| Sponsored immigrants | Note ...: not applicable | 20 | 23 | 26 | 23 | Note ...: not applicable |
| Refugees | Note ...: not applicable | 50 | 37 | 31 | 23 | Note ...: not applicable |
| Source country or region | ||||||
| China | Note ...: not applicable | 27 | 35 | 34 | 27 | 15 |
| South AsiaTable 3 Note 6 | Note ...: not applicable | 14 | 13 | 14 | 11 | 7 |
| European countries | Note ...: not applicable | 25 | 34 | 26 | 13 | 10 |
| Latin American countries | Note ...: not applicable | 26 | 29 | 30 | 23 | 14 |
| Rest of the world | Note ...: not applicable | 28 | 27 | 29 | 20 | 11 |
| Social security agreement with CanadaTable 3 Note 7 | ||||||
| Yes | Note ...: not applicable | 14 | 16 | 21 | 16 | 11 |
| No | Note ...: not applicable | 30 | 33 | 31 | 20 | 11 |
| Home ownership statusTable 3 Note 8 | ||||||
| YesTable 3 Note 9 | 9 | 14 | 15 | 18 | 11 | 8 |
| No | 32 | 54 | 57 | 55 | 44 | 29 |
| Activity limitation | ||||||
| Yes | 16 | 26 | 27 | 29 | 21 | 12 |
| No | 12 | 21 | 24 | 24 | 13 | 8 |
... not applicable
Source: Statistics Canada, Census of Population, 2016. |
||||||
The results also show other factors that could influence low-income rates for senior immigrants. First, low-income rates were lower for senior immigrants who lived in households with more than one census family or in couple households with at least one child. This result is important because over two-thirds of recent senior immigrants lived in a couple household with children, a multiple-census-family household or a non-census-family household (Table 2). Senior immigrants who lived in an owned private dwelling had lower low-income rates—a result that was true for newer immigrants, older immigrants, and non-immigrants.
Low-income rates tended to be lower among senior immigrants who lived with other household members aged 26 to 64 and who lived with other household members with some degree of labour market attachment, particularly among those who landed 1 to 20 years ago.Note Senior households that included a self-employed person, and households that included non-immigrant or immigrants who landed over 40 years also had lower low-income rates.
With regard to admission categories, among all senior immigrants who landed 1 to 10 years ago, low-income rates were lower for those who applied through family sponsorship programs, and higher for those admitted as refugees. This finding is consistent with the importance of having additional family members in the household to help reduce financial vulnerability. However, the low-income rate was not necessarily lower among more educated recent senior immigrants or those who could speak French or English.Note Seniors with activity limitationsNote also had significantly higher low-income rates, although this result was true for both immigrants and non-immigrants.Note
Old Age Security and Guaranteed Income Supplement benefits are associated with a lower income rate among senior immigrants
The next section of the article uses logistic regression models to assess the impact of OAS/GIS benefits on the predicted probability of low income among senior immigrants. Results are expressed as an average marginal effect for each covariate of interest. This is the average change on the predicted probability of being in low income when a particular explanatory variable increases by one unit, while holding other variables constant.Note
Table 4 illustrates the results by regressing the low-income rate variable (based on the LIM-AT measure) on a binary indicator for OAS receipt (corresponding to 1 if an individual receives OAS or GIS and 0 otherwise), and other controls for gender, age, education level, knowledge of official languages, industry and occupation, location of residence, source country or region, access to SSA, immigration admission category, activity limitation, and family composition.
| All senior immigrants | Senior immigrants, 1 to 20 years since immigration | |||||
|---|---|---|---|---|---|---|
| All | Men | Women | All | Men | Women | |
| Average marginal effects | ||||||
| OAS/GIS entitlementTable 4 Note 1 | ||||||
| Yes | -0.043Note ** | -0.046Note ** | -0.042Note ** | -0.074Note ** | -0.085Note ** | -0.069Note ** |
| No (ref.) | Note ...: not applicable | Note ...: not applicable | Note ...: not applicable | Note ...: not applicable | Note ...: not applicable | Note ...: not applicable |
| Sex | ||||||
| Male | 0.015Note ** | Note ...: not applicable | Note ...: not applicable | 0.042Note ** | Note ...: not applicable | Note ...: not applicable |
| Female (ref.) | Note ...: not applicable | Note ...: not applicable | Note ...: not applicable | Note ...: not applicable | Note ...: not applicable | Note ...: not applicable |
| Education | ||||||
| Bachelor's degree or higher | -0.038Note ** | -0.030Note ** | -0.050Note ** | 0.002 | 0.000 | -0.001 |
| Some college or university education | -0.028Note ** | -0.020Note ** | -0.031Note ** | -0.016Note ** | -0.023Note ** | -0.014Note ** |
| High school diploma or lower (ref.) | Note ...: not applicable | Note ...: not applicable | Note ...: not applicable | Note ...: not applicable | Note ...: not applicable | Note ...: not applicable |
| Knowledge of official languagesTable 4 Note 2 | ||||||
| English | -0.038Note ** | -0.031Note ** | -0.049Note ** | -0.035Note ** | -0.030Note ** | -0.043Note ** |
| French | -0.026Note ** | -0.028Note ** | -0.027Note ** | -0.045Note ** | -0.038Note ** | -0.052Note ** |
| Both English and French | -0.047Note ** | -0.034Note ** | -0.062Note ** | -0.068Note ** | -0.073Note ** | -0.069Note ** |
| Neither English nor French (ref.) | Note ...: not applicable | Note ...: not applicable | Note ...: not applicable | Note ...: not applicable | Note ...: not applicable | Note ...: not applicable |
| Hours worked per day by other household members in self-employment | 0.003Note ** | 0.002Note ** | 0.005Note ** | 0.005Note ** | 0.005Note ** | 0.007Note ** |
| Household type | ||||||
| Couple without children | -0.090Note ** | -0.057Note ** | -0.116Note ** | -0.077Note ** | -0.034Note ** | -0.086Note ** |
| Couple with children | -0.187Note ** | -0.145Note ** | -0.191Note ** | -0.209Note ** | -0.197Note ** | -0.167Note ** |
| Lone-parent | -0.094Note ** | -0.078Note ** | -0.064Note ** | -0.134Note ** | -0.141Note ** | -0.081Note ** |
| Other household typesTable 4 Note 3 | -0.252Note ** | -0.231Note ** | -0.235Note ** | -0.263Note ** | -0.285Note ** | -0.195Note ** |
| Single-person (ref.) | Note ...: not applicable | Note ...: not applicable | Note ...: not applicable | Note ...: not applicable | Note ...: not applicable | Note ...: not applicable |
| Presence of other household members aged 26 to 64 years | ||||||
| Yes | -0.039Note ** | -0.012Note ** | -0.105Note ** | -0.165Note ** | -0.125Note ** | -0.224Note ** |
| No (ref.) | Note ...: not applicable | Note ...: not applicable | Note ...: not applicable | Note ...: not applicable | Note ...: not applicable | Note ...: not applicable |
| Presence of other adult household members who are non-immigrants or who landed in Canada over 40 years ago | ||||||
| Yes | -0.067Note ** | -0.071Note ** | -0.058Note ** | -0.118Note ** | -0.160Note ** | -0.092Note ** |
| No (ref.) | Note ...: not applicable | Note ...: not applicable | Note ...: not applicable | Note ...: not applicable | Note ...: not applicable | Note ...: not applicable |
| Immigrant admission category | ||||||
| Worker programs and provincial/territorial nominees | -0.034Note ** | -0.031Note ** | -0.042Note ** | -0.033Note ** | -0.027Note ** | -0.051Note ** |
| Business programsTable 4 Note 4 | 0.031Note ** | 0.027Note ** | 0.026Note ** | 0.053Note ** | 0.061Note ** | 0.029Note ** |
| Sponsored immigrants | -0.020Note ** | -0.008Note ** | -0.025Note ** | -0.033Note ** | -0.026Note ** | -0.035Note ** |
| Landed prior to 1980Table 4 Note 5 | -0.102Note ** | -0.085Note ** | -0.120Note ** | Note ...: not applicable | Note ...: not applicable | Note ...: not applicable |
| RefugeesTable 4 Note 6 (ref.) | Note ...: not applicable | Note ...: not applicable | Note ...: not applicable | Note ...: not applicable | Note ...: not applicable | Note ...: not applicable |
| Source country or region | ||||||
| China | 0.038Note ** | 0.028Note ** | 0.046Note ** | 0.023Note ** | 0.013Table 4 Note † | 0.031Note ** |
| South AsiaTable 4 Note 7 | -0.014Note ** | -0.015Note ** | -0.013Note ** | 0.021Note ** | 0.017Note ** | 0.025Note ** |
| European countries | -0.040Note ** | -0.049Note ** | -0.032Note ** | -0.050Note ** | -0.063Note ** | -0.039Note ** |
| Latin American countries | -0.011Note ** | -0.018Note ** | -0.003 | -0.027Note ** | -0.019Table 4 Note † | -0.028Note ** |
| Rest of the world (ref.) | Note ...: not applicable | Note ...: not applicable | Note ...: not applicable | Note ...: not applicable | Note ...: not applicable | Note ...: not applicable |
| Social security agreement with CanadaTable 4 Note 8 | ||||||
| Yes | -0.002Note * | -0.003Table 4 Note † | -0.001 | -0.055Note ** | -0.057Note ** | -0.051Note ** |
| No (ref.) | Note ...: not applicable | Note ...: not applicable | Note ...: not applicable | Note ...: not applicable | Note ...: not applicable | Note ...: not applicable |
| Homeownership statusTable 4 Note 9 | ||||||
| Yes | -0.118Note ** | -0.110Note ** | -0.124Note ** | -0.137Note ** | -0.135Note ** | -0.130Note ** |
| No (ref.) | Note ...: not applicable | Note ...: not applicable | Note ...: not applicable | Note ...: not applicable | Note ...: not applicable | Note ...: not applicable |
| Activity limitation | ||||||
| Yes | 0.016Note ** | 0.010Note ** | 0.022Note ** | 0.008Note * | 0.004 | 0.012Note ** |
| No (ref.) | Note ...: not applicable | Note ...: not applicable | Note ...: not applicable | Note ...: not applicable | Note ...: not applicable | Note ...: not applicable |
... not applicable
Source: Statistics Canada, Census of Population, 2016. |
||||||
Results indicate that access to OAS/GIS reduces the low-income rate among all senior immigrants over the age of 65 by about 4 percentage points, on average, after controlling for socioeconomic and demographic variables. The table shows the regression model split by gender for the same subpopulation group. With all else held constant, the OAS/GIS reduces the low-income rate of seniors by 4 to 5 percentage points for both men and women.
The OAS/GIS has even more of an impact on the low-income rate of seniors who came to Canada 1 to 20 years prior to the Census. Specifically, access to the OAS/GIS was associated with a 7 percentage point decline in the low-income rate for this population (similar results were found for both men and women). This suggests that the effect of the OAS/GIS is smaller for immigrants who landed earlier than for senior immigrants who landed more recently.
Table 5 uses the years since immigration groups in lieu of the binary variable for OAS receipt as the main variable of interest because the binary variable for OAS receipt does not account for differences in OAS/GIS pension benefits based on years of residence in Canada. The 11 to 20 years since immigration group is a proxy for senior immigrants who have just met the residency requirement of the OAS program and who typically receive about one-quarter of OAS/GIS benefits (see the Data sources, methods and definitions section for a description of the OAS/GIS program). The 21 to 30 years since immigration category corresponds with immigrants who are entitled to approximately half of OAS/GIS benefits. The 31 to 40 years since immigration category corresponds with those who receive about three-quarters of OAS/GIS benefits. Finally, the category of immigrants who have been in the country for over 40 years represents those who are normally entitled to receive the full amount of OAS/GIS benefits.
| All | Male | Female | |
|---|---|---|---|
| Average marginal effects | |||
| Years since immigration | |||
| 1 to 10 (ref.) | Note ...: not applicable | Note ...: not applicable | Note ...: not applicable |
| 11 to 20 | -0.023Note ** | -0.026Note ** | -0.025Note ** |
| 21 to 30 | -0.036Note ** | -0.040Note ** | -0.034Note ** |
| 31 to 40 | -0.081Note ** | -0.082Note ** | -0.081Note ** |
| Over 40 years | -0.102Note ** | -0.088Note ** | -0.116Note ** |
| Sex | |||
| Male | 0.015Note ** | Note ...: not applicable | Note ...: not applicable |
| Female (ref.) | Note ...: not applicable | Note ...: not applicable | Note ...: not applicable |
| Education | |||
| Bachelor's degree or higher | -0.037Note ** | -0.029Note ** | -0.049Note ** |
| Some college or university education | -0.028Note ** | -0.020Note ** | -0.031Note ** |
| High school diploma or lower (ref.) | Note ...: not applicable | Note ...: not applicable | Note ...: not applicable |
| Knowledge of official languagesTable 5 Note 1 | |||
| English | -0.036Note ** | -0.029Note ** | -0.047Note ** |
| French | -0.024Note ** | -0.025Note ** | -0.025Note ** |
| Both English and French | -0.043Note ** | -0.030Note ** | -0.057Note ** |
| Neither English nor French (ref.) | Note ...: not applicable | Note ...: not applicable | Note ...: not applicable |
| Hours worked per day by other household members in self-employment | 0.003Note ** | 0.002Note ** | 0.005Note ** |
| Household type | |||
| Couple without children | -0.095Note ** | -0.062Note ** | -0.122Note ** |
| Couple with children | -0.194Note ** | -0.151Note ** | -0.197Note ** |
| Lone-parent | -0.098Note ** | -0.082Note ** | -0.069Note ** |
| Other household typesTable 5 Note 2 | -0.257Note ** | -0.236Note ** | -0.241Note ** |
| Single-person (ref.) | Note ...: not applicable | Note ...: not applicable | Note ...: not applicable |
| Presence of other household members aged 26 to 64 years | |||
| Yes | -0.039Note ** | -0.012Note ** | -0.105Note ** |
| No (ref.) | Note ...: not applicable | Note ...: not applicable | Note ...: not applicable |
| Presence of other adult household members who are non-immigrants or who landed over 40 years ago in Canada | |||
| Yes | -0.061Note ** | -0.067Note ** | -0.050Note ** |
| No (ref.) | Note ...: not applicable | Note ...: not applicable | Note ...: not applicable |
| Immigrant admission category | |||
| Worker programs and provincial/territorial nominees | -0.028Note ** | -0.027Note ** | -0.034Note ** |
| Business programsTable 5 Note 3 | 0.034Note ** | 0.028Note ** | 0.030Note ** |
| Sponsored immigrants | -0.025Note ** | -0.014Note ** | -0.029Note ** |
| Landed prior to 1980Table 5 Note 4 | -0.052Note ** | -0.049Note ** | -0.057Note ** |
| RefugeesTable 5 Note 5 (ref.) | Note ...: not applicable | Note ...: not applicable | Note ...: not applicable |
| Source country or region | |||
| China | 0.038Note ** | 0.028Note ** | 0.047Note ** |
| South AsiaTable 5 Note 6 | -0.016Note ** | -0.017Note ** | -0.014Note ** |
| European countries | -0.039Note ** | -0.049Note ** | -0.030Note ** |
| Latin American countries | -0.010Note ** | -0.017Note ** | -0.003 |
| Rest of the world (ref.) | Note ...: not applicable | Note ...: not applicable | Note ...: not applicable |
| Social security agreement with CanadaTable 5 Note 7 | |||
| Yes | -0.001 | -0.003Table 5 Note † | 0.001 |
| No (ref.) | Note ...: not applicable | Note ...: not applicable | Note ...: not applicable |
| Homeownership statusTable 5 Note 8 | |||
| Yes | -0.116Note ** | -0.107Note ** | -0.122Note ** |
| No (ref.) | Note ...: not applicable | Note ...: not applicable | Note ...: not applicable |
| Activity limitation | |||
| Yes | 0.016Note ** | 0.010Note ** | 0.022Note ** |
| No (ref.) | Note ...: not applicable | Note ...: not applicable | Note ...: not applicable |
... not applicable
Source: Statistics Canada, Census of Population, 2016. |
|||
Compared with senior immigrants who did not qualify for OAS benefits (i.e., immigrant seniors who landed within a decade preceding the Census) and with all else held constant, the probability of being in low income was 2 percentage points lower among senior immigrants who landed 11 to 20 years ago, 4 percentage points lower among those who landed 21 to 30 years ago, 8 percentage points lower among those who landed 31 to 40 years ago and 10 percentage points lower among those who landed more than 40 years ago. These results suggest that the OAS/GIS program plays a significant role in reducing low-income rates among seniors, and that this effect increases with years of residency in Canada. How OAS/GIS benefits affect low-income rates appeared to be similar for both men and women who recently immigrated to Canada, but had a greater effect on the low income of immigrant women who spent a longer period in Canada.
Overall, multivariate results support most of the findings from the descriptive statistics. For example, results in Table 5 show that homeownership and living arrangement help reduce the low-income rate of senior immigrants. In particular, couple households with children and multiple-census-family households were significantly less likely to be in low income than single-person households. The presence of other non-immigrant adults or early-arrived immigrants in the household was also associated with a decline in the probability of low income, particularly for immigrants who landed 1 to 20 years prior to the Census.
The presence of other individuals aged 26 to 64 in the household was negatively correlated with low income, especially for female senior immigrants and for those who landed within the two decades preceding the Census. Similar to the descriptive statistics findings, immigrants who benefited from SSAs had lower low-income rates than those who did not—but that result was true only for immigrants who landed 1 to 20 years ago. The probability of low income was also higher among individuals who reported that they had at least one activity limitation.
In terms of immigrant admission categories, all regression models show that immigrants in the business programs category were more likely to be in low income than refugees after controlling for homeownership and household characteristics. In comparison with refugees, the predicted probability of being in low income was lower among immigrants in worker programs and in provincial/territorial nominees programs and in sponsorship programs, by a margin of 3 to 5 percentage points.
Education made little difference in the low-income rates of senior immigrants who landed 1 to 20 years before; it mattered, however, when the entire sample of senior immigrants was considered. Senior immigrants who had at least a bachelor’s degree were 4 percentage points less likely to be in low income than those with a high school diploma at most. The ability to conduct a conversation in either or both official languages was also negatively correlated with low income, particularly among senior immigrants who landed 1 to 20 years ago.
Low-income rates among senior immigrants represent only one measure of financial vulnerability. Senior immigrants who landed more recently—particularly those from specific countries and regions of the world—may have access to other types of financial resources, often through other family members outside Canada. Examples include wealth transfers through homeownership; income received through investment, private retirement and other market income sources; and transfers from “satellite families” (for more information, see the section Alternative source of financial support for senior immigrants).
Conclusion
In Canada, one-quarter of senior immigrants who landed within the two decades preceding the Census are categorized as being in low income according to the LIM-AT measure. The purpose of this article was to investigate the factors that influence the low-income rates of immigrants over the age of 65, based on data from the 2016 Census, with a focus on OAS/GIS benefits.
The findings suggest that OAS/GIS benefits have a significant effect on the low-income rate of senior immigrants, and that the OAS program has a greater impact with increased years of residence in Canada.
Access to OAS/GIS benefits, however, is not the only factor that affects the low-income rates of senior immigrants. Factors such as homeownership status and household characteristics matter because immigrants who owned a house as well as those who lived in multiple-census-family or couple households had lower probabilities of being in low income than senior immigrants not in these two situations. Other factors, such as admission categories, source country or region, knowledge of official languages and whether the source country has an SSA with Canada, can also influence the low-income rates of senior immigrants, particularly those who landed more recently.
A full assessment of the income of a family would include sources of income received from other households, received either as an inter-household cash transfer, or the implicit income received through the supply of a home or other assets. Literature on “satellite families”, suggests that this phenomenon might be more prevalent among the recent immigrant senior population. It is beyond the ability of the current study to look at a more complete measure of income such as this. This suggests that future work focussing on broader indicators of economic well-being, for example considering measures of housing or other material deprivation, could contribute to our understanding of the situation of recent immigrant seniors.
Wendy Kei is an analyst with the Microdata Access Division at Statistics Canada and a faculty member at the University of British Columbia. Marc-David L. Seidel is a faculty member at the University of British Columbia. Dennis Ma is a Ph.D. candidate at the University of British Columbia. Marjan Houshmand is a faculty member at the University of Hawaii.
Start of text box
Data sources, methods and definitions
Data sources
The data in this analysis were from the 2016 Census of Population. Because income information is based on the year 2015, immigrants over the age of 65 in 2016 were the target population to avoid mistakenly capturing ineligible individuals in the analyses. In line with international standards, the LOLIMA variable—the after-tax household-level low-income status—from the 2016 Census was used to identify senior immigrants with income below the low-income line (50% of median after-tax income of private households adjusted for household size). These measures exclude individuals living in the territories, on reserves and in collective households.
Methods
Two different logistic regression models were used to estimate how Old Age Security (OAS) and Guaranteed Income Supplement (GIS) entitlements affect the low-income measures of individuals over the age of 65.
In Table 4, the low-income measure variable is regressed on a binary indicator for OAS entitlement (equalling 1 if an individual receives OAS or GIS and 0 otherwise) and a vector of control variables including effects of age, metropolitan area, industry, occupation, source country or region, education, immigration admission category, household characteristics and official language ability; binary indicators for homeownership, activity limitation, arriving from a country that has a social security agreement (SSA) with Canada, the presence of other household members aged 26 to 64, and the presence of other adult household members who are non-immigrants or who landed in Canada more than 40 years ago; and hours worked by other household members per day in self-employment to proxy for the presence of family business.
In Table 5, the low-income measure variable is regressed on binary indicators for 11 to 20 years since immigration, 21 to 30 years since immigration, 31 to 40 years since immigration and over 40 years since immigration, plus the same covariates as those used in Table 4. The base group in this model is immigrants who landed 1 to 10 years ago and who most likely did not qualify for OAS public pensions.
Old Age Security and Guaranteed Income Supplement programs
The OAS pension is the Government of Canada’s largest pension program. It is a monthly benefit paid to seniors aged 65 and over who have Canadian citizenship or permanent residency status. The OAS pension is not mean-tested, does not depend on marital status and is based on a residency requirement for eligibility.Note There are three possible scenarios to meet the residency requirement. First, seniors who live in Canada at the time of application must have lived in Canada for at least 10 years since age 18. Second, applicants who live overseas at the time of application must present proof of residence that the duration of stay in Canada since age 18 exceeds 20 years.Note Third, if neither scenario applies, applicants could meet the residency requirement through an international SSA, which would allow the period of contributions and residence in Canada to be combined with that in an agreement country for eligibility for OAS benefits.Note
A senior receives the full OAS pension benefit if they have lived in Canada for at least 40 years since age 18 and their personal income is less than $125,696. For January 2019 to March 2019, the full OAS pension amount was $601.45 per month, inflation-adjusted. As of July 2013, a senior can choose to receive a higher monthly pension amount if they defer receiving the OAS pension for up to 60 months after the pension eligibility date. For individuals who have lived in Canada for 10 to 39 years, the pension amount is prorated by their duration of stay. For example, an individual receives one quarter of the full pension amount if, at the time of application, they have lived in Canada for 10 years since age 18. The prorated amount before inflation adjustment is fixed for life. The recipient needs to pay a recovery tax if their net annual world income exceeds a maximum threshold amount ($77,580 for income year 2019) or if they lived in a country where the non-resident tax on Canadian pension is 25% or higher.
OAS recipients and their partners can qualify for three supplementary benefits (GIS, Spouse’s Allowance and Allowance for the Survivor). Unlike OAS benefits, these supplementary benefits are not prorated by the duration of stay, but are available when the applicant meets the OAS residency requirement and their previous year’s combined income with their partner (excluding OAS pension) is below a maximum annual threshold level.
Definitions
See the 2016 Census Dictionary at https://www12.statcan.gc.ca/census-recensement/2016/ref/dict/index-eng.cfm for income definitions (for Chart 1).
Public pension includes cash benefits received from an OAS pension, GIS, Spouse’s Allowance and Allowance for the Survivor and retirement pensions, survivors’ benefits and disability benefits from the Canada Pension Plan and Quebec Pension Plan.
Worker program immigrants and provincial/territorial nominees include the following categories: Express Entry program; Federal Skilled Worker Program; Federal Skilled Trades Program; Canadian Experience Class; Provincial/Territorial Nominee Program; and Caregiver Program.
Business program immigrants include the following categories: entrepreneur, investor and self-employed programs.
Sponsored immigrants include the following categories: sponsored spouse or partner, sponsored parent or grandparent, sponsored child, sponsored intercountry adopted child, public policy or humanitarian and compassionate case sponsored by family, and immigrant sponsored by family, not included elsewhere.
Refugees include the following categories: protected person in Canada, dependant abroad of a protected person in Canada, government-assisted refugee, privately sponsored refugee and blended visa office-referred refugee.
Other immigrants include the following categories: public policy or humanitarian and compassionate care; and other immigrant, not included elsewhere.
Activity limitations include difficulty seeing; difficulty hearing; difficulty walking, using stairs, using hands or fingers, or doing physical activities; difficulty learning, remembering or concentrating; emotional, psychological or mental health conditions; and other health problems or long-term conditions that have lasted or the respondent expects to last for six months or more.
End of text box
Start of text box
Alternatives sources of financial support for senior immigrants
Because senior immigrants who landed more recently do not have immediate access to the Canadian public pension system given their lack of employment and residence histories in Canada, a question of interest is whether this subpopulation group has access to offshore wealth and income transfers that would make them less financially vulnerable. Different sources have suggested that recent immigrants use residential investment and satellite families as a mechanism for transferring wealth to Canada from abroad.Note A satellite family refers to a family where one of the members earns abroad while the rest of the family resides in Canada, but the family does not fully declare their global income in Canada for tax purposes.Note
For immigrants, one way to transfer wealth into Canada from abroad is through homeownership. People from certain ethnic groups have moved quickly into some Canadian housing markets.Note Table 6 shows the share of senior immigrants who lived in privately owned dwellings as a proxy for homeownership, by source country or region and years since immigration.Note Consistent with other studies,Note the 2016 Census shows that 85% of recent senior immigrants from China and South Asian countries lived in privately owned dwellings, compared with 73% of European-born senior immigrants, 61% of Latin American senior immigrants and 66% of senior immigrants from the rest of the world. Similar trends were seen for other categories of years since immigration.
| Years since immigration | ||||
|---|---|---|---|---|
| 1 to 10 years | 11 to 20 years | 21 to 30 years | 31 to 40 years | |
| Source country or region | percent | |||
| China | 85 | 77 | 85 | 86 |
| South AsiaTable 6 Note 1 | 85 | 85 | 86 | 89 |
| European countries | 73 | 62 | 72 | 83 |
| Latin American countries | 61 | 56 | 55 | 66 |
| Rest of the world | 66 | 72 | 75 | 79 |
| Total, senior immigrants | 76 | 74 | 75 | 80 |
Source: Statistics Canada, Census of Population, 2016. |
||||
The percentage of senior immigrants with investment, private retirement and other market is shown in Table 7. As noted above, these income sources may include income from abroad. About 58% of Chinese recent senior immigrants and 57% of their European-born counterparts had some form of private non-employment income. These values are roughly double those of senior immigrants from South Asia, Latin American countries and the rest of the world.
| Years since immigration | ||||
|---|---|---|---|---|
| 1 to 10 years | 11 to 20 years | 21 to 30 years | 31 to 40 years | |
| Source country or region | percent | |||
| China | 58 | 32 | 49 | 61 |
| South AsiaTable 7 Note 1 | 19 | 20 | 30 | 58 |
| European countries | 57 | 45 | 63 | 81 |
| Latin American countries | 25 | 24 | 34 | 56 |
| Rest of the world | 29 | 35 | 46 | 65 |
| Total, senior immigrants | 37 | 31 | 45 | 68 |
Source: Statistics Canada, Census of Population, 2016. |
||||
Finally, it is also important to examine the extent of accessibility to funding sources from overseas through satellite families. To gauge the extent of this phenomenon, the sample was restricted to senior immigrants living in lone-parent and single-person households. Then, the share of individuals within this subset who reported married or common-law status was examined (Table 8). The partner in a single-person household or a lone-parent family who is not living in Canada may be another mechanism for transferring offshore income to Canada. It should be noted that the census does not provide any information on the number of children living outside Canada—some children could be the main income earners of the family. The results shows that senior immigrants from China (15%) and South Asia (13%) had the largest proportions of lone parents and single persons who reported that they were in a married or common-law relationship, particularly among those who landed recently. Conversely, the proportions were smaller among European and Latin American senior immigrants, regardless of years since immigration (at 5% or less).
| Years since immigration | ||||
|---|---|---|---|---|
| 1 to 10 years | 11 to 20 years | 21 to 30 years | 31 to 40 years | |
| Source country or region | percent | |||
| China | 15 | 7 | 6 | 5 |
| South AsiaTable 8 Note 1 | 13 | 11 | 5 | 4 |
| European countries | 2 | 2 | 2 | 2 |
| Latin American countries | 4 | 5 | 2 | 3 |
| Rest of the world | 6 | 5 | 4 | 3 |
| Total, senior immigrants | 7 | 5 | 4 | 3 |
Source: Statistics Canada, Census of Population, 2016. |
||||
End of text box
- Date modified: