
Insights on Canadian Society
Debt and financial distress among Canadian families

Archived Content
Information identified as archived is provided for reference, research or recordkeeping purposes. It is not subject to the Government of Canada Web Standards and has not been altered or updated since it was archived. Please "contact us" to request a format other than those available.
by George Marshall

Start of text box
This study uses data from the 2016 Survey of Financial Security to examine financial distress indicators for Canadian families. Three financial distress indicators are examined: the proportion of Canadian families who skipped or delayed a mortgage payment, the proportion who skipped or delayed a non-mortgage payment and the proportion who borrowed money through a payday loan. This paper also examines the factors associated with financial distress among Canadians, with a particular focus on their debt level.
- Among Canadian families with debt, in 2016, 11% skipped or delayed a non-mortgage payment, and, among those who had mortgage debt, 4% skipped or delayed a mortgage payment in the past year.
- About 4% of Canadian families with debt reported that at least one family member borrowed money through a payday loan in the past three years.
- Families in higher debt-to-asset categories were more likely to miss or delay payments or to use payday loans. For example, among families that had a debt-to-asset ratio above 0.50—meaning that the value of their debt amounted to more than 50% of their assets—16% missed or delayed a non-mortgage payment in the previous year, compared with 7% of families that had a debt-to-asset ratio of 0.25 or below.
- The debt-to-income ratio was not significantly associated with financial distress indicators, even after accounting for other factors.
- Other family characteristics were associated with financial distress indicators. For example, lone-parent families (8%) and “other” family types (6%) were more likely to have used payday loans than couples with no children (4%), after accounting for other factors.
End of text box
Introduction
A great deal of research in recent years has focused on the levels of debt that families carry.Note This research has intensified since the financial crisis that began in the United States in 2007. Statistics Canada publishes several financial indicators in the National Balance Sheet Accounts, which monitor financial conditions in the household sector. The credit-market-debt-to-disposable-income ratio, which compares the stock of all household credit market debt with the level of after-tax disposable income, has risen nearly every year since it was first published in 1990 (Chart 1). However, this increase in debt levels has been accompanied by similar increases in the value of assets, leaving the debt-to-asset ratio nearly unchanged since 1991, despite some fluctuations (Chart 2).

Data table for Chart 1
| Percent | |
|---|---|
| 1990 | 86.89 |
| 1991 | 87.61 |
| 1992 | 88.97 |
| 1993 | 90.04 |
| 1994 | 92.65 |
| 1995 | 94.31 |
| 1996 | 96.82 |
| 1997 | 100.22 |
| 1998 | 103.85 |
| 1999 | 105.83 |
| 2000 | 106.79 |
| 2001 | 106.88 |
| 2002 | 110.99 |
| 2003 | 115.04 |
| 2004 | 121.26 |
| 2005 | 128.63 |
| 2006 | 134.06 |
| 2007 | 141.46 |
| 2008 | 148.51 |
| 2009 | 154.12 |
| 2010 | 158.65 |
| 2011 | 160.17 |
| 2012 | 161.29 |
| 2013 | 161.93 |
| 2014 | 163.15 |
| 2015 | 164.84 |
| 2016 | 172.11 |
| 2017 | 175.38 |
| 2018 | 175.23 |
| Source: Statistics Canada, Table 38-10-0235-01, National Balance Sheet Accounts. | |
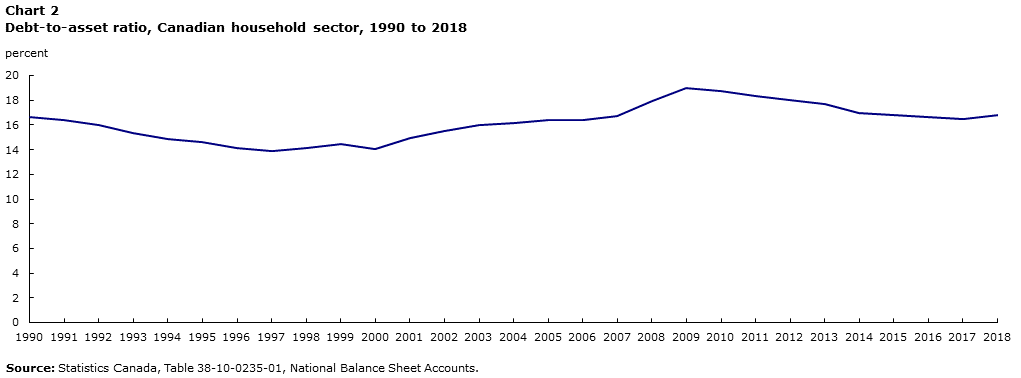
Data table for Chart 2
| Percent | |
|---|---|
| 1990 | 16.66 |
| 1991 | 16.42 |
| 1992 | 15.99 |
| 1993 | 15.34 |
| 1994 | 14.82 |
| 1995 | 14.58 |
| 1996 | 14.15 |
| 1997 | 13.87 |
| 1998 | 14.13 |
| 1999 | 14.42 |
| 2000 | 14.08 |
| 2001 | 14.91 |
| 2002 | 15.48 |
| 2003 | 15.98 |
| 2004 | 16.17 |
| 2005 | 16.42 |
| 2006 | 16.43 |
| 2007 | 16.72 |
| 2008 | 17.98 |
| 2009 | 19.00 |
| 2010 | 18.71 |
| 2011 | 18.35 |
| 2012 | 18.04 |
| 2013 | 17.66 |
| 2014 | 16.98 |
| 2015 | 16.81 |
| 2016 | 16.64 |
| 2017 | 16.51 |
| 2018 | 16.78 |
| Source: Statistics Canada, Table 38-10-0235-01, National Balance Sheet Accounts. | |
Although debt is often necessary to finance asset purchases, such as housing, it carries risks. One reason for investigating debt is that it might be related to financial distress indicators. These indicators range from skipping debt payments to filing for bankruptcy. Much of the literature from both American and Canadian researchers has used sources from the United States, which provide some insight into the Canadian situation. In 2005, Canada overtook the United States in terms of its consumer debt-to-income ratio and, shortly after, Canada’s bankruptcy rate also overtook that of the United States.Note
Historically, most research into financial distress has focused on bankruptcy,Note partly because few other financial distress indicators are available.Note Although it is an intuitively appealing financial distress indicator, bankruptcy has limitations. For one, it is a measure of extreme financial distress since it is a last resort. A family can be in financial distress well before being in a situation of bankruptcy. Furthermore, the incentives for declaring bankruptcy are sensitive to legislative changes.Note The decline in bankruptcy filings since 2009 does not necessarily indicate improving financial security of Canadian families, but could represent behavioural changes caused by new legislation.Note Moreover, since annual bankruptcy rates are generally quite low, a detailed analysis would be constrained by sample size.
For these reasons, it is important to consider additional financial distress indicators. A recent study looked at asset poverty in Canada, where asset poverty was defined as having assets worth less than three months of spending at a low-income threshold.Note The results revealed a growing rate of asset poverty between 1999 and 2012. Another study analyzed the use of payday loans in Canada. It found that the number of payday loan operators has grown, as has the total volume of loans per operator.Note
Using data from the 2016 Survey of Financial Security (SFS), this study examines financial distress using a variety of indicators that paint a broader picture: skipping or delaying non-mortgage payments, skipping or delaying mortgage payments and using payday loans. The credit ratings of debtors who skip payments are negatively affected, which results in worse terms for future borrowing. In addition, debtors who use a payday loan have to pay much higher interest rates compared with most other commercial borrowing.
This study also examines the relationship between these financial distress indicators and two widely used measures of family indebtedness: the debt-to-asset ratio and the debt-to-income ratio. This paper will summarize some of the socioeconomic characteristics of families experiencing financial distress. Only families who have debt are included in the analysis.
Several considerations make this paper timely. It is especially important to consider debt since debt levels are on the rise, mostly as a result of mortgage debt. Housing prices have been increasing for some time, and interest rates have recently begun to rise. The Office of the Superintendent of Financial Institutions (OSFI) also recently introduced new mortgage rules, which require borrowers to undergo a mortgage stress test in order to verify if they can withstand a sudden increase in interest rates. Understanding how higher debt might affect financial pressures can be useful for people considering how much debt to accumulate.
In publications where researchers used Canadian data,Note none examined the relationship between financial distress and debt using previous waves of the SFS, because the survey had little information about the financial distress of families. The 2016 SFS asked a greater variety of questions about financial security than previous iterations of the survey. The use of payday loans was tracked in previous waves, but indicators of skipping payments were not (see the Data sources, methods and definitions section).
In 2016, more than 1 in 10 families with debt reported skipping or delaying a non-mortgage payment in the previous 12 months
In the 2016 SFS, questions related to financial distress were formulated as follows: (1) “In the last 12 months, have you skipped or delayed a non-mortgage payment?”Note ; (2) “In the last 12 months, have you skipped or delayed a mortgage payment on this [primary residence] property?”; and (3) “In the past 3 years, have you (or anyone in your family) borrowed money through a payday loan?”
Overall, among Canadian families with debt, 11% skipped or delayed a non-mortgage payment in the past year and, among families with mortgage debt, 4% skipped or delayed a mortgage payment in the past year.
Payday loans are short-term loans of a few hundred dollars made by financial institutions that are not banks or credit unions, and are typically used to cover a cash shortfall until the borrower’s next pay day. Although they have higher fees and interest charges than traditional forms of credit such as lines of credit or cash advances on a credit card, they are sometimes used by people who have limited access to more affordable forms of credit. In the SFS, payday loan use is measured by calculating the proportion of families that had at least one member using a payday loan over the past three years—which was reported by 4% of families with debt in 2016 (up from 3% in 2005).Note
The three financial distress indicators are examined across categories of debt-to-asset ratios and debt-to-income ratios. A debt-to-income ratio of 0.25, for instance, indicates that a family has debt corresponding to 25% of the family income. Similarly, a debt-to-asset ratio of 0.25 indicates that a family’s debt level amounts to 25% of its asset level. For the vast majority of Canadian families, their debt-to-asset ratio is lower than their debt-to-income ratio. For the purpose of this study, three groups of families were constructed for the debt-to-asset ratio: families with a debt-to-asset ratio up to 0.25, above 0.25 and up to 0.50, and above 0.50. Similarly, three groups of families were constructed for the debt-to-income ratio: families with a debt-to-income ratio up to 1.5, above 1.5 and up to 3.0, and above 3.0.Note
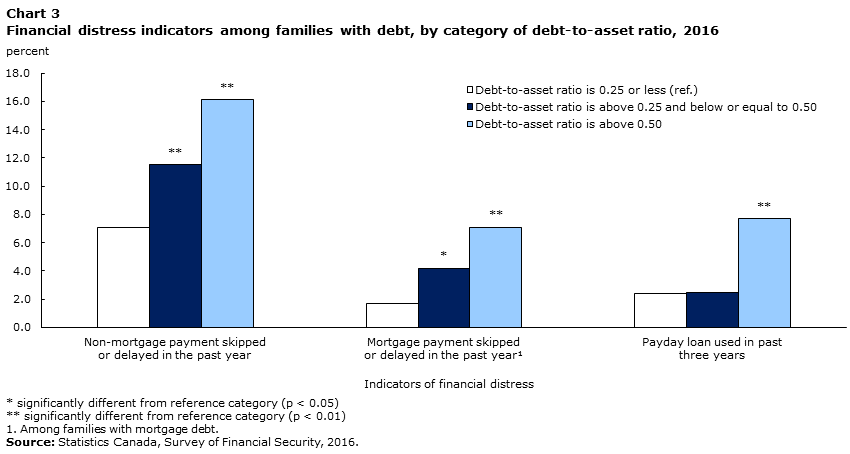
Data table for Chart 3
| Non-mortgage payment skipped or delayed in the past year | Mortgage payment skipped or delayed in the past yearData table Note 1 | Payday loan used in past three years | |
|---|---|---|---|
| percent | |||
| Debt-to-asset ratio is 0.25 or less (ref.) | 7.1 | 1.7 | 2.4 |
| Debt-to-asset ratio is above 0.25 and below or equal to 0.50 | 11.5Note ** | 4.2Note * | 2.5 |
| Debt-to-asset ratio is above 0.50 | 16.1Note ** | 7.1Note ** | 7.7Note ** |
|
|||
Families in higher debt-to-asset categories were more likely to be in financial distress. Around 7% of families with a debt-to-asset ratio up to 0.25 missed or delayed a non-mortgage payment, compared with 16% of those with a ratio above 0.50 (Chart 3). A similar association was seen with skipping or delaying mortgage payments.
Among families in the lowest debt-to-asset category, 2% missed or delayed a mortgage payment, compared with 7% for those in the highest group. Finally, among families in the lowest debt-to-asset category, 2% used payday loans, compared with 8% for those with a ratio greater than 0.50.
The associations were not as clear for the debt-to-income ratio (Chart 4). About 11% of families skipped or delayed a non-mortgage payment if they had a debt-to-income ratio up to 1.5. For families with a ratio above 1.5 and up to 3.0, and above 3.0, the proportions were 8% and 11%, respectively.
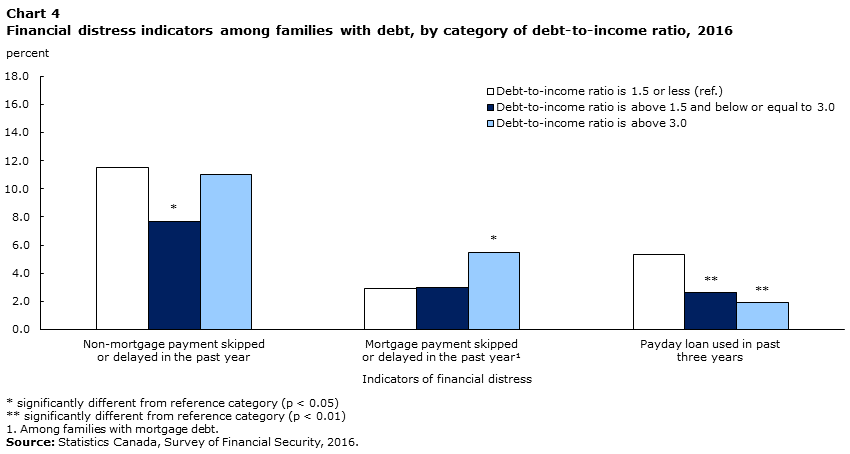
Data table for Chart 4
| Non-mortgage payment skipped or delayed in the past year | Mortgage payment skipped or delayed in the past yearData table Note 1 | Payday loan used in past three years | |
|---|---|---|---|
| percent | |||
| Debt-to-income ratio is 1.5 or less (ref.) | 11.5 | 2.9 | 5.3 |
| Debt-to-income ratio is above 1.5 and below or equal to 3.0 | 7.7Note * | 3.0 | 2.6Note ** |
| Debt-to-income ratio is above 3.0 | 11.0 | 5.5Note * | 1.9Note ** |
|
|||
Among families with a mortgage, around 3% of those with a debt-to-income ratio up to 3.0 skipped or delayed a mortgage payment. However, almost 6% of those with a debt-to-income ratio above 3.0 missed or delayed a payment. On the other hand, those with higher debt-to-income ratios were less likely to use payday loans. Families in the lowest debt-to-income category were more likely to have used payday loans (5%) than those who were in the highest group (2%).
These results can be explained by the fact that those who use payday loans have a high debt-to-asset ratio—largely because of low values of asset holdings, not because of high debts. Indeed, those who take out payday loans have 28% of the assets of the general debtor population, on average. Furthermore, they are less likely to be homeowners, for whom the debt-to-income ratio is typically higher; their average debt-to-income ratio is 59% of that of the general population of debtors. Not only are their debts lower, but payday loan users’ access to credit through credit cards is also more limited compared with the general population. About 17% of those who used a payday loan were refused a credit card, compared with 2% of population of all debtors.
Thus, the debt-to-asset ratio displays a clear pattern that suggests that higher debt levels—for a given value of assets—expose families to greater risk of financial distress. However, the debt-to-income ratio does not tell a similar story.
Families with a higher debt-to-asset ratio are more likely to skip a payment or to use payday loans
The relationships between financial distress and the debt-to-income and debt-to-asset ratios were further analyzed by estimating logistic regression models, which helped to control for various socioeconomic characteristics. The control variables included in the models were family income quintile; home ownership status; family type; region; as well as age, sex and education level of the major income earner. The results are presented as predicted probabilities.
A higher debt-to-asset ratio was associated with a greater probability of missing a non-mortgage payment. Families with a debt-to-asset ratio above 0.50 had a 13% probability of missing a non-mortgage payment (Table 1). In comparison, this probability was 12% for those with a ratio above 0.25 and up to 0.50, and 8% for families with a ratio equal to or below 0.25.Note
| Non-mortgage payment skipped or delayed in the past year | Mortgage payment skipped or delayed in the past yearTable 1 Note 1 | Payday loan used in past three years | |
|---|---|---|---|
| predicted probability | |||
| Debt-to-asset ratio category | |||
| Up to 0.25 (ref.) | 0.080 | 0.016 | 0.027 |
| Above 0.25 and up to 0.50 | 0.122Note ** | 0.042Note ** | 0.031 |
| Above 0.50 | 0.128Note ** | 0.073Note ** | 0.060Note ** |
| Age group of main income earner | |||
| 15 to 34 years | 0.114 | 0.020Note * | 0.034 |
| 35 to 44 years | 0.105 | 0.039 | 0.037 |
| 45 to 54 years (ref.) | 0.125 | 0.042 | 0.047 |
| 55 to 64 years | 0.099 | 0.081Note * | 0.042 |
| Over 64 years | 0.062Note ** | 0.041 | 0.040 |
| Family type | |||
| Unattached | 0.110 | 0.045 | 0.024 |
| Couple with no children (ref.) | 0.083 | 0.024 | 0.035 |
| Couple with children | 0.106 | 0.040 | 0.041 |
| Lone parent | 0.121 | 0.094Note * | 0.084Note ** |
| "Other" family types | 0.116 | 0.045 | 0.063Note ** |
| Education of main income earner | |||
| Less than high school | 0.112 | 0.054 | 0.075Note * |
| High school (ref.) | 0.117 | 0.038 | 0.048 |
| Some postsecondary | 0.121 | 0.046 | 0.041 |
| University diploma or degree | 0.079Note ** | 0.033 | 0.016Note ** |
| Income group | |||
| First quintile (ref.) | 0.128 | 0.068 | 0.037 |
| Second quintile | 0.134 | 0.038 | 0.046 |
| Third quintile | 0.097Note * | 0.048 | 0.038 |
| Fourth quintile | 0.095 | 0.041 | 0.038 |
| Fifth quintile | 0.051Note * | 0.022Note ** | 0.033 |
| Region | |||
| Atlantic | 0.073 | 0.043 | 0.038 |
| Quebec | 0.136Note ** | 0.034 | 0.014Note ** |
| Ontario (ref.) | 0.096 | 0.032 | 0.046 |
| Prairies | 0.106 | 0.068Note ** | 0.056 |
| British Columbia | 0.091 | 0.039 | 0.044 |
| Sex of main income earner | |||
| Male (ref.) | 0.107 | 0.042 | 0.040 |
| Female | 0.103 | 0.038 | 0.037 |
| Home ownership status | |||
| Own without mortgage | 0.078Note ** | Note ...: not applicable | 0.017Note ** |
| Own with mortgage | 0.085Note ** | Note ...: not applicable | 0.019Note ** |
| Do not own (ref.) | 0.140 | Note ...: not applicable | 0.082 |
... not applicable
|
|||
Home ownership status was also an important factor associated with missing a non-mortgage payment. Homeowners, with or without a mortgage, were less likely to be in financial distress. Their probability of missing a non-mortgage payment was around 8%, compared with 14% for those who did not own their principal residence.
Family income was also associated with financial distress indicators. Families in the lowest income quintile had a 13% probability of skipping or delaying a payment. In comparison, the probability was 9% and 5% for those in the fourth and fifth quintiles, respectively.
Other results showed that families where the major income earner was aged 65 or over (6%) were less likely to miss payments, compared with families where the major income earner was aged 45 to 54 (12%). University degree holders (8%) were less likely to miss payments than high school diploma holders (12%). Regionally, the probability of skipping or delaying payments was 14% for families in Quebec, compared with 10% for families in Ontario.
The results obtained for skipping or delaying mortgage payments, which include only families with mortgage debt, were similar, although the probabilities were lower.Note Those in the lowest debt-to-asset ratio category had a 2% probability of skipping or delaying a mortgage payment. This risk increased as the debt-to-asset ratio increased. Among those with ratios above 0.50, the probability of skipping or delaying a mortgage payment was 7%.
As was the case with missing non-mortgage payments, other family characteristics were associated with missing mortgage payments. The probability of missing a mortgage payment for lone-parent families (9%) was higher than for couples without children (2%).
Families where the major income earner was 55 to 64 years old (8%) were more likely to miss a mortgage payment. Families where the major income earner was 15 to 34 years old (2%) were less likely to miss a mortgage payment than families where the major income earner was 45 to 54 years old (4%). Families in the top income quintile had a lower probability (2%) than those in the bottom quintile (7%). Regionally, families in the Prairies were more likely to miss mortgage payments than families in Ontario (7% versus 3%).
Payday loan use is higher among lone-parent families and “other” family types
Debt-to-asset ratios are also associated with payday loan use. Families in the highest debt-to-asset ratio group were twice as likely to have used a payday loan in the past three years, compared with those in the lowest group (6% versus 3%).
Homeowners with or without a mortgage (2%) were significantly less likely to have used a payday loan, compared with non-owners (8%). Generally, a higher level of education was associated with a lower probability of payday loan use—8% for people with less than high school, 5% for high school diploma holders and 2% for those with a university degree (even after accounting for other factors such as income). This result may be related to the fact that people with a higher level of education also have higher rates of financial literacy than those with lower levels of education.Note
Lone-parent families (8%) and “other” family typesNote (6%) were more likely to use payday loans, compared with couples with no children (4%). Quebec residents were the least likely to use payday loans (1%, compared with 5% in Ontario), after accounting for all factors. There are variations in provincial regulations associated with payday loans across Canada, and Quebec has more restrictive regulations than other Canadian provinces.Note Contrary to what was found for skipping or delaying mortgage or non-mortgage payments, income levels were not associated with payday loan use.Note
To test the relationship between the debt-to-income ratio and financial distress indicators, the model was also run with debt-to-income categories instead of debt-to-asset categories. The results indicate that the debt-to-income ratio does not appear to be associated with financial distress, since the results are not statistically significant (Table 2). The relationships between various family characteristics and the three financial distress indicators were similar in the debt-to-income model and the debt-to-asset model.
| Non-mortgage payment skipped or delayed in the past year | Mortgage payment skipped or delayed in the past yearTable 2 Note 1 | Payday loan used in past three years | |
|---|---|---|---|
| predicted probability | |||
| Debt-to-income ratio category | |||
| Up to 1.5 (ref.) | 0.101 | 0.031 | 0.042 |
| Above 1.5 and up to 3.0 | 0.095 | 0.032 | 0.040 |
| Above 3.0 | 0.125 | 0.052 | 0.028 |
| Age group of main income earner | |||
| 15 to 34 years | 0.120 | 0.025 | 0.038 |
| 35 to 44 years | 0.108 | 0.041 | 0.038 |
| 45 to 54 years (ref.) | 0.122 | 0.038 | 0.046 |
| 55 to 64 years | 0.093 | 0.068Note * | 0.039 |
| Over 64 years | 0.057Note ** | 0.030 | 0.033 |
| Family type | |||
| Unattached | 0.109Note * | 0.043 | 0.025 |
| Couple with no children (ref.) | 0.083 | 0.023 | 0.034 |
| Couple with children | 0.107 | 0.041 | 0.041 |
| Lone parent | 0.123 | 0.099Note * | 0.086Note ** |
| "Other" family types | 0.117Note * | 0.045 | 0.062Note ** |
| Education of main income earner | |||
| Less than high school | 0.114 | 0.056 | 0.074Note * |
| High school (ref.) | 0.117 | 0.038 | 0.047 |
| Some postsecondary | 0.122 | 0.047 | 0.042 |
| University diploma or degree | 0.078Note ** | 0.032 | 0.016Note ** |
| Income group | |||
| First quintile (ref.) | 0.129 | 0.065 | 0.041 |
| Second quintile | 0.135 | 0.040 | 0.048 |
| Third quintile | 0.097Note * | 0.049 | 0.037 |
| Fourth quintile | 0.094Note * | 0.041 | 0.036 |
| Fifth quintile | 0.050Note ** | 0.021Note ** | 0.026 |
| Region | |||
| Atlantic | 0.074 | 0.048 | 0.037 |
| Quebec | 0.136Note ** | 0.035 | 0.013Note ** |
| Ontario (ref.) | 0.096 | 0.032 | 0.047 |
| Prairies | 0.108 | 0.072Note ** | 0.060 |
| British Columbia | 0.089 | 0.034 | 0.045 |
| Sex of main income earner | |||
| Male (ref.) | 0.107 | 0.043 | 0.040 |
| Female | 0.103 | 0.038 | 0.038 |
| Home ownership status | |||
| Own without mortgage | 0.066Note ** | Note ...: not applicable | 0.013Note ** |
| Own with mortgage | 0.086Note ** | Note ...: not applicable | 0.022Note ** |
| Do not own (ref.) | 0.146 | Note ...: not applicable | 0.078 |
... not applicable
|
|||
A higher debt-to-asset ratio is associated with a higher probability of skipping payments because of financial difficulties
Skipping or delaying a payment does not always imply that a family is in a difficult financial situation or facing financial problems. Rather, it may simply reflect omitting or inadvertently missing a payment (e.g., in the case of a credit card). Furthermore, most mortgage payments benefit from a grace period whereby the owner incurs no financial penalty if the payment is made before a certain deadline.
The SFS asked respondents who skipped or delayed payments whether they had done so “due to financial difficulties.” Around 67% of respondents who missed non-mortgage payments also responded that they did so because of financial difficulties. Three in four respondents (74%) who skipped mortgage payments reported that they skipped or delayed them because of financial difficulties.
As was the case for the results associated with missing a payment for any reason, there was a relationship between the debt-to-asset ratio and the probability of missing a mortgage payment because of financial difficulties. For example, the probability of skipping or delaying a non-mortgage payment because of financial difficulties was 5% for families with a debt-to-asset ratio up to 0.25, and 10% for those who had a debt-to-asset ratio above 0.50 (Table 3). Likewise, other factors associated with missing a payment because of financial difficulties were largely the same as for those discussed in Table 1.
| Non-mortgage payment skipped or delayed in the past year | Mortgage payment skipped or delayed in the past yearTable 3 Note 1 | |
|---|---|---|
| predicted probability | ||
| Debt-to-asset ratio category | ||
| Up to 0.25 (ref.) | 0.048 | 0.013 |
| Above 0.25 and up to 0.50 | 0.068 | 0.027Note * |
| Above 0.50 | 0.098Note ** | 0.056Note ** |
| Age group of main income earner | ||
| 15 to 34 years | 0.071 | 0.015Note * |
| 35 to 44 years | 0.065Note * | 0.027 |
| 45 to 54 years (ref.) | 0.094 | 0.035 |
| 55 to 64 years | 0.074 | 0.057 |
| Over 64 years | 0.034Note ** | 0.029 |
| Family type | ||
| Unattached | 0.067 | 0.030 |
| Couple with no children (ref.) | 0.054 | 0.019 |
| Couple with children | 0.072 | 0.030 |
| Lone parent | 0.091Note * | 0.077Note * |
| "Other" family types | 0.085Note * | 0.029 |
| Education of main income earner | ||
| Less than high school | 0.083 | 0.044 |
| High school (ref.) | 0.077 | 0.031 |
| Some postsecondary | 0.087 | 0.034 |
| University diploma or degree | 0.042Note ** | 0.021 |
| Income group | ||
| First quintile (ref.) | 0.097 | 0.062 |
| Second quintile | 0.095 | 0.031 |
| Third quintile | 0.057Note ** | 0.028Note * |
| Fourth quintile | 0.054Note ** | 0.032 |
| Fifth quintile | 0.020Note ** | 0.012Note * |
| Region | ||
| Atlantic | 0.049 | 0.037 |
| Quebec | 0.075 | 0.027 |
| Ontario (ref.) | 0.062 | 0.022 |
| Prairies | 0.091Note ** | 0.049Note ** |
| British Columbia | 0.071 | 0.031 |
| Sex of main income earner | ||
| Male (ref.) | 0.071 | 0.030 |
| Female | 0.070 | 0.030 |
| Home ownership status | ||
| Own without mortgage | 0.048Note ** | Note ...: not applicable |
| Own with mortgage | 0.051Note ** | Note ...: not applicable |
| Do not own (ref.) | 0.099 | Note ...: not applicable |
... not applicable
|
||
Conclusion
Using data from the 2016 SFS, this study looked at the association between the debt-to-asset and debt-to-income ratios and financial distress, while controlling for various socioeconomic characteristics. Three financial distress indicators were considered—missing non-mortgage payments, missing mortgage payments and taking out a payday loan.
The varied results call for a nuanced interpretation. The first point to note is that the debt-to-asset ratio tells a more consistent story than the debt-to-income ratio. Across all three distress indicators, people in the highest debt-to-asset groups have a higher probability of reporting distress. However, after controlling for other factors, the debt-to-income ratio is not associated with the measures of financial distress since the results are not statistically significant.
The debt-to-asset ratio might be a more predictive indicator because debtors can often sell assets to make debt payments, even if they do not have the income to make payments. Alternatively, those who own homes often have access to home equity lines of credit. These results are important because they suggest that the debt-to-asset ratio is a better indicator of financial precariousness than the debt-to-income ratio.
Additionally, some demographic groups face relatively higher probabilities of reporting financial distress, including lone-parent families, and “other” family types. Conversely, families whose major income earner had a university degree, were less likely to be in financial distress. Similarly, homeowners with or without a mortgage were less likely to miss payments or take out payday loans.
Financial distress has many dimensions and can take multiple forms. Future measurement should provide additional details, such as the frequency at which specific financial services are used when under financial duress. More research will be needed to better comprehend the extent to which Canadians are facing financial difficulties.
George Marshall is a research analyst with Statistics Canada’s Insights on Canadian Society.
Start of text box
Data sources
Data from the 2016 Survey of Financial Security (SFS) were used in this study. The SFS is a voluntary survey that collects information from a sample of Canadian families on their assets, debts, employment, income and education. Information is collected on the value of all major financial and non-financial assets, and on the money owing on mortgages, vehicles, credit cards, student loans and other debts.
The SFS covers the population living in the 10 provinces. Excluded from the survey coverage are persons living on reserves and in other Aboriginal settlements in the provinces; official representatives of foreign countries living in Canada and their families; members of religious and other communal colonies; members of the Canadian Forces living on military bases or in military camps; and persons living full time in institutions such as inmates of penal institutions and chronic care patients living in hospitals and nursing homes.
Individual characteristics such as age and education reflect those of the major income earner of the family. Families were dropped from the sample if they reported debt-to-asset or debt-to-income ratios of zero.
Three categories of debt-to-asset and debt-to-income ratios were used in this study. The categories were organized to identify the one-quarter of Canadian families that had the highest proportions of debt-to-income and debt-to-asset ratios. In 2016, one-half of families with debt reported a debt-to-asset ratio above 0 and up to 0.25.Note Another 23% had a ratio above 0.25 and up to 0.50, and 28% had a ratio above 0.50. Similarly, 54% of families with debt reported having a debt-to-income ratio above 0 and up to 1.5, 21% had a ratio above 1.5 and up to 3.0, and 25% reported a ratio above 3.0.
Definitions
Family refers to the economic family, defined as families consisting of two or more people living in the same dwelling, related by blood, marriage or adoption, or who are living common law, and single people who are living either alone or with others to whom they are unrelated.
Total debt pertains to total family debt and includes mortgage debt on the principal residence and all other real estate (Canadian and foreign), and consumer debt.
Mortgage debt refers to debt owed by families on the principal residence and all other real estate (Canadian and foreign).
Consumer debt includes debt outstanding on credit cards, personal and home equity lines of credit, and secured and unsecured loans from banks and other institutions (including vehicle loans), and other unpaid bills.
Total assets pertain to total family assets and include real estate (principal residence and all other real estate), employer pension plans (on a termination basis) and all other assets (including RRSPs, RESPs, RRIFs, stocks, bonds, mutual funds, vehicles, household possessions, bank accounts, collectibles, accumulated value of family businesses, and other financial and non-financial assets).
Income quintiles are based on the total after-tax economic family income, adjusted for family size.
Debt-to-income ratio is obtained by dividing total family debt by the total after-tax family income.
Debt-to-asset ratio is obtained by dividing total family debt by total family assets.
End of text box
- Date modified: