Chart A1
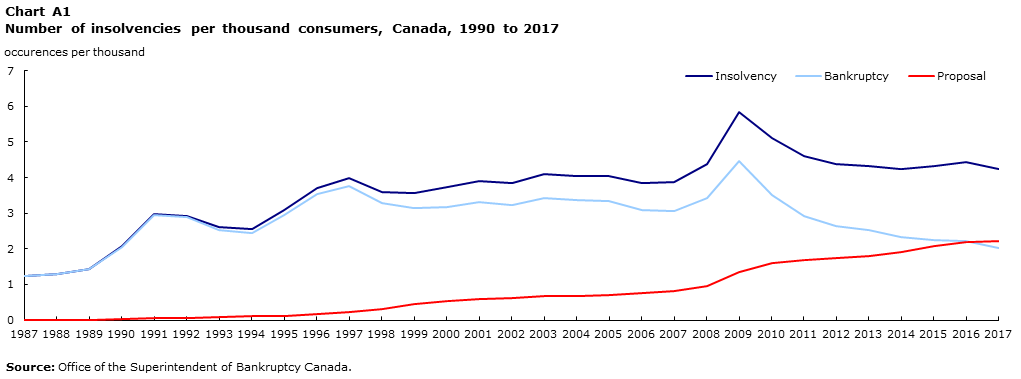
Number of insolvencies per thousand consumers, Canada, 1990 to 2017
Data table for Chart A1
Data table for Chart A1
Table summary
This table displays the results of Data table for Chart A1 Insolvency, Bankruptcy and Proposal, calculated using occurrences per thousand units of measure (appearing as column headers).
Insolvency
Bankruptcy
Proposal
occurrences per thousand
1987
1.252021596
1.236886991
0.015134605
1988
1.302450586
1.286310679
0.016139906
1989
1.439487154
1.422025227
0.017461927
1990
2.079281132
2.051245665
0.028035467
1991
2.986868700
2.940363317
0.046505384
1992
2.933568349
2.884091440
0.049476908
1993
2.619236451
2.518606966
0.100629485
1994
2.551545442
2.446490143
0.105055299
1995
3.076851509
2.949217678
0.127633831
1996
3.711376268
3.544908224
0.166468044
1997
3.978466872
3.752001719
0.226465153
1998
3.604530178
3.281203555
0.323326623
1999
3.581486089
3.139602417
0.441883672
2000
3.730374137
3.188237469
0.542136668
2001
3.908817577
3.321520016
0.587297560
2002
3.842909522
3.218883546
0.624025976
2003
4.088300106
3.419107751
0.669192354
2004
4.043803658
3.377626060
0.666177598
2005
4.050654740
3.339962304
0.710692435
2006
3.834791088
3.085533464
0.749257624
2007
3.889454260
3.066639293
0.822814967
2008
4.389214773
3.434754170
0.954460603
2009
5.827327841
4.470247848
1.357079993
2010
5.113769948
3.511020025
1.602749923
2011
4.598822611
2.916102201
1.682683021
2012
4.369326180
2.638431183
1.730894997
2013
4.322676689
2.521385355
1.801291334
2014
4.246689752
2.332495695
1.914194057
2015
4.325715549
2.255394914
2.070320635
2016
4.427041230
2.228748922
2.198292308
2017
4.249429968
2.015869374
2.233560594
Source: Office of the Superintendent of Bankruptcy Canada.