
Insights on Canadian Society
Living alone in Canada

Archived Content
Information identified as archived is provided for reference, research or recordkeeping purposes. It is not subject to the Government of Canada Web Standards and has not been altered or updated since it was archived. Please "contact us" to request a format other than those available.
by Jackie Tang, Nora Galbraith and Johnny Truong

Skip to text
Text begins
Start of text box

Today, Insights on Canadian Society is releasing a study based on 2016 Census data to examine the characteristics of people living alone in Canada. In addition, this study also uses data from the 2017 General Social Survey on Family to analyze the family relationships and well-being of this particular population.
End of text box
Start of text box
This study uses the Census of Population and the 2017 General Social Survey on Family to examine the characteristics of the population living alone in Canada. The demographic, socioeconomic and housing characteristics of persons who live alone are examined, as well as their conjugal history, family relationships, and well-being indicators.
- The number of persons living alone in Canada has more than doubled over the last 35 years, from 1.7 million in 1981 to 4.0 million in 2016. Solo dwellers represented 14% of the population aged 15 and over living in private households in 2016, up from 9% in 1981.
- In recent decades, the number of persons living alone has grown fastest among adults aged 35 to 64. Reflecting this shift, persons living alone in 2016 were more likely to be male and separated or divorced than in the past.
- The socioeconomic and housing characteristics of the population that lives alone differ from those of the population that lives with others. For instance, persons living alone were more than twice as likely as persons living with others to live in a condominium in 2016.
- Despite living alone in their usual place of residence, solo dwellers may nonetheless have close connections with loved ones: in 2017, the majority of these individuals had at least one child, and one-third of those aged 20 to 34 were in a Living Apart Together (LAT) relationship with a partner.
- Most young adults who lived alone in 2017 intended to either form a union or have a child in the future, suggesting that they consider this lifestyle to be a temporary arrangement.
End of text box
Introduction
The 2016 Census revealed that for the first time in recorded Canadian history, one-person households were the most common household type, overtaking households comprising couples with children.Note Similar trends have been observed in other countries in recent years.Note The increasing popularity of living alone has transformed many aspects of Canadian society, particularly the housing market—where there has been growing demand for smaller, individual living quarters—as well as the retail market, which has expanded the number of consumer goods and services targeted towards solo living.
Along with the increase in solo living, questions have been raised about the possible impacts of this living arrangement on the prevalence of social isolation and loneliness in society, particularly among the senior population. There is some evidence that individuals who live alone are generally more likely to report social isolation or loneliness than those who live with others.Note The baby boom generation is now transitioning into their senior years. It is possible that the forthcoming generation of seniors may be more at risk of experiencing social isolation since baby boomers have had fewer children on average than previous generations. They have also experienced higher rates of union dissolution, which may impact their frequency of contact with their children.Note
As the prevalence of living alone has grown over time, it is expected that the population with this type of arrangement has also become more varied. Individuals who live alone may have very different socioeconomic, housing and family characteristics, depending on their stage in life and whether this living arrangement has come about by choice or by circumstance.Note As the household represents one of the main decision-making units in society,Note trends in the characteristics of persons who live alone may play an increasingly important role in shaping Canada’s society, culture and economy in the coming years.
Building on previous analyses of Canada’s solo-dwelling population,Note this study examines two broad questions: “What are the characteristics of persons who live alone in Canada?” and “How has this population evolved over time?” Data from the Canadian Census of Population and the 2017 General Social Survey (GSS) on Family are used to examine the population living alone in private households. Using census data, the paper first looks at changes in the size and demographic composition of the population living alone over time. The next section compares the socioeconomic and housing situations of persons who live alone with those of persons who live with others. Finally, in an effort to better understand the varied experiences of living alone, data from the 2017 GSS are used to examine the conjugal, fertility and well-being characteristics of individuals with this living arrangement and their intentions for the future. For more information on the design of the study, see the section on Data sources, methods and definitions.
Living alone grew rapidly in prevalence over the 20th century
Since the beginning of the 20th century, the average size of households in Canada has decreased, from 5.0 persons in 1901Note to 2.4 persons in 2016. Along with smaller households, the proportion of and one-person households grew rapidly, from 7% in 1951 to 28% in 2016, the highest level on record. How did this happen?
In the first few decades after Confederation, Canadian households tended to be relatively large and flexible in terms of membership, often including multiple generations of a family, distant relatives, foster children, servants, labourers, boarders and lodgers.Note Gradually, a nuclearization of households occurred, whereby census families became more likely to live by themselves.Note At the same time, persons not in census families increasingly chose to live on their own.Note
Following the Second World War, the period from the start of the 1950s to the end of the 1970s saw the most rapid increases in solo living. Part of this increase was simply due to shifts in the structure of Canada’s population: the large baby boom generation began entering young adulthood when living alone first became possible. In addition, greater improvements in female life expectancy relative to males during this period led to growth in the number of senior women living alone following the death of their spouse. However, most of the rise in the popularity of living alone during this era can be attributed to changing attitudes and preferences.Note Societal shifts such as the introduction of no-fault divorce;Note the emergence of a new interim period between leaving the childhood home and beginning a family; urbanization and the associated rapid growth in the number of high-rise apartments;Note technological developments within the home;Note and the expansion of social welfare and public housing programs permitted more persons to live alone if they so desired.Note
By the mid-1980s, the newfound ability and growing preference to live alone were well ingrained in Canadian society. Many researchers of the phenomenon at the time debated whether the growing trend in one-person households would end once the youngest baby boomers entered adulthood.Note However, as will be described in the sections below, there has been a continued growth in the prevalence of living alone in the decades that followed.
Relatively more men and separated or divorced persons living alone today
The number of persons living alone in Canada more than doubled over the last 35 years, from 1.7 million in 1981 to 4.0 million in 2016. Over the same period, the share of the population aged 15 and over that lived alone in private households increased from 9% to 14%. This growth occurred in all regions of the country, but particularly in Quebec (see the section titled Quebec: The living alone capital of Canada).
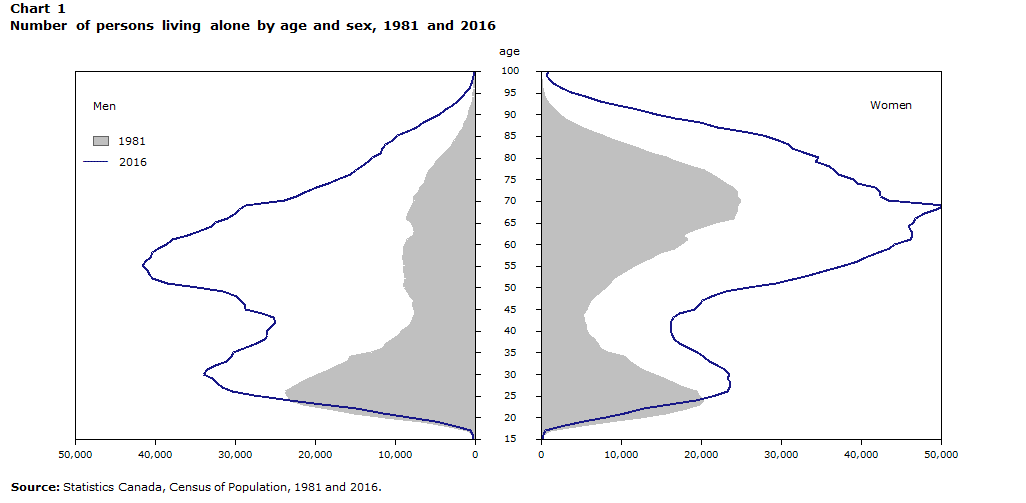
The age and sex composition of the population living alone has also changed considerably over the last several decades (Chart 1). In 1981, over three times as many senior women (aged 65 and over) as senior men were living alone; solo-dwelling women aged 35 to 64 also outnumbered their male counterparts. In the decades that followed, the number of men who were living alone grew at a faster rate than their female counterparts, particularly those aged 35 and over. By 2016, more men aged 35 to 64 were living alone than women living alone in the same age group, and the gender gap in the senior solo-dwelling population declined to a ratio of 2.2 senior women living alone for every senior man living alone.
Data table for Chart 1
| Age | Men | Women | ||
|---|---|---|---|---|
| 1981 | 2016 | 1981 | 2016 | |
| number | ||||
| 15 | 70 | 165 | 65 | 175 |
| 16 | 240 | 290 | 270 | 255 |
| 17 | 895 | 575 | 1130 | 565 |
| 18 | 3125 | 2295 | 4365 | 2455 |
| 19 | 6690 | 4970 | 8585 | 5350 |
| 20 | 11170 | 8200 | 12455 | 8110 |
| 21 | 15115 | 11475 | 15585 | 10490 |
| 22 | 18460 | 14750 | 18165 | 12860 |
| 23 | 21380 | 19080 | 19845 | 16120 |
| 24 | 23125 | 23125 | 20345 | 19335 |
| 25 | 23460 | 27570 | 19630 | 21790 |
| 26 | 23640 | 30260 | 19405 | 23335 |
| 27 | 22860 | 31540 | 17870 | 23595 |
| 28 | 21705 | 32280 | 16465 | 23645 |
| 29 | 20655 | 32820 | 15285 | 23335 |
| 30 | 19540 | 33925 | 14060 | 23500 |
| 31 | 18045 | 33485 | 12525 | 22935 |
| 32 | 17075 | 32440 | 11750 | 22080 |
| 33 | 15910 | 31005 | 11040 | 21050 |
| 34 | 15540 | 30400 | 10420 | 20275 |
| 35 | 12895 | 30130 | 8355 | 19555 |
| 36 | 11610 | 28885 | 7480 | 18560 |
| 37 | 11025 | 27270 | 7110 | 17315 |
| 38 | 10300 | 26250 | 6735 | 16735 |
| 39 | 9510 | 25990 | 6115 | 16470 |
| 40 | 9045 | 25945 | 5685 | 16245 |
| 41 | 8365 | 25455 | 5655 | 16250 |
| 42 | 7970 | 24970 | 5490 | 16145 |
| 43 | 7750 | 25245 | 5325 | 16500 |
| 44 | 7405 | 26575 | 5320 | 17275 |
| 45 | 7570 | 28670 | 5710 | 19140 |
| 46 | 7815 | 28810 | 5935 | 19780 |
| 47 | 7555 | 29270 | 6140 | 20130 |
| 48 | 8095 | 29750 | 6745 | 21340 |
| 49 | 8400 | 31390 | 7435 | 23075 |
| 50 | 8795 | 34705 | 8040 | 25985 |
| 51 | 8825 | 38485 | 8570 | 29365 |
| 52 | 8695 | 40260 | 9020 | 31920 |
| 53 | 8745 | 40715 | 9810 | 33960 |
| 54 | 8980 | 40950 | 10675 | 35645 |
| 55 | 8865 | 41520 | 11630 | 37890 |
| 56 | 8870 | 41240 | 12725 | 39570 |
| 57 | 9045 | 40590 | 13870 | 40605 |
| 58 | 8755 | 40310 | 14920 | 42160 |
| 59 | 8920 | 39600 | 16650 | 43585 |
| 60 | 8685 | 38570 | 17485 | 44130 |
| 61 | 8475 | 37850 | 18325 | 46145 |
| 62 | 7675 | 35965 | 17730 | 46455 |
| 63 | 7555 | 34570 | 18620 | 46255 |
| 64 | 7675 | 32920 | 20280 | 45925 |
| 65 | 7980 | 32435 | 21765 | 46535 |
| 66 | 8520 | 30975 | 24105 | 46780 |
| 67 | 8285 | 29965 | 24285 | 47915 |
| 68 | 8105 | 29380 | 24580 | 49375 |
| 69 | 7815 | 28745 | 24560 | 50500 |
| 70 | 7530 | 23795 | 24900 | 43375 |
| 71 | 7565 | 22365 | 24460 | 42385 |
| 72 | 7115 | 21325 | 24595 | 42450 |
| 73 | 6860 | 19845 | 23940 | 41795 |
| 74 | 6375 | 18375 | 23070 | 39545 |
| 75 | 6130 | 17225 | 22320 | 39055 |
| 76 | 5940 | 15600 | 21355 | 37130 |
| 77 | 5625 | 14975 | 20410 | 36700 |
| 78 | 5210 | 14145 | 18730 | 36085 |
| 79 | 4770 | 13340 | 16855 | 34345 |
| 80 | 4315 | 12840 | 15725 | 34670 |
| 81 | 3810 | 11855 | 13860 | 33210 |
| 82 | 3250 | 11505 | 12215 | 31455 |
| 83 | 2830 | 11215 | 10660 | 30955 |
| 84 | 2510 | 10325 | 9180 | 29680 |
| 85 | 2115 | 9725 | 7640 | 27805 |
| 86 | 1830 | 8490 | 6375 | 25230 |
| 87 | 1470 | 7345 | 5000 | 22045 |
| 88 | 1290 | 6410 | 3870 | 19935 |
| 89 | 995 | 5460 | 2950 | 16790 |
| 90 | 760 | 4475 | 2260 | 14400 |
| 91 | 625 | 3630 | 1635 | 12025 |
| 92 | 460 | 2820 | 1130 | 9655 |
| 93 | 330 | 2200 | 770 | 7410 |
| 94 | 235 | 1580 | 475 | 5605 |
| 95 | 140 | 1130 | 335 | 3800 |
| 96 | 100 | 720 | 215 | 2735 |
| 97 | 65 | 410 | 140 | 1620 |
| 98 | 35 | 290 | 85 | 1060 |
| 99 | 15 | 175 | 70 | 695 |
| 100 and over | 45 | 100 | 120 | 970 |
| Source: Statistics Canada, Census of Population, 1981 and 2016. | ||||
While the number of persons living alone has grown across all age groups over time, the numbers increased most rapidly in middle adulthood (Chart 2). Among persons aged 35 to 64, the proportion that lived alone rose from 8% in 1981 to 13% in 2016. This increase reflects the fact that the population living alone at these ages grew much faster than the population living with others over this period (Chart 3).

Data table for Chart 2
| Age group | 1981 | 2016 |
|---|---|---|
| percent | ||
| 15 and over | 9.2 | 13.9 |
| 20 to 34 | 8.1 | 10.1 |
| 35 to 64 | 7.6 | 12.9 |
| 65 and over | 26.4 | 25.7 |
| Source: Statistics Canada, Census of Population, 1981 and 2016. | ||

Data table for Chart 3
| Age group | Persons living alone | Persons living with others |
|---|---|---|
| percent change | ||
| 15 and over | 136.1 | 48.0 |
| 20 to 34 | 31.1 | 3.3 |
| 35 to 64 | 227.3 | 80.2 |
| 65 and over | 149.4 | 158.2 |
| Source: Statistics Canada, Census of Population, 1981 and 2016. | ||
In contrast, the share of seniors that lived alone decreased slightly over the same period, as the number of seniors that lived with others grew relatively faster. Despite the growing popularity of living alone at younger ages over time, this lifestyle remains most prevalent within the senior population: more than one-quarter (26%) of them lived alone in 2016.
The age patterns of living alone have evolved differently for men and women
Between 1981 and 2016, the share of the population aged 25 to 64 that lived alone increased for both women and men, but growth was faster among men (Chart 4). The share of senior women aged 65 and over that lived alone decreased over the period for all but the very oldest ages, whereas the share of senior men that lived alone generally increased.
Data table for Chart 4
| Age | 1981 | 2016 | ||
|---|---|---|---|---|
| Men | Women | Men | Women | |
| percent | ||||
| 15 | 0.0 | 0.0 | 0.1 | 0.0 |
| 16 | 0.1 | 0.1 | 0.1 | 0.1 |
| 17 | 0.4 | 0.5 | 0.3 | 0.3 |
| 18 | 1.3 | 1.9 | 1.1 | 1.2 |
| 19 | 2.9 | 3.8 | 2.3 | 2.6 |
| 20 | 4.8 | 5.3 | 3.7 | 3.8 |
| 21 | 6.5 | 6.7 | 5.1 | 4.9 |
| 22 | 8.2 | 7.9 | 6.6 | 6.0 |
| 23 | 9.5 | 8.7 | 8.4 | 7.3 |
| 24 | 10.4 | 8.9 | 10.1 | 8.6 |
| 25 | 10.8 | 8.9 | 11.8 | 9.5 |
| 26 | 10.8 | 8.6 | 13.0 | 10.1 |
| 27 | 10.7 | 8.2 | 14.0 | 10.5 |
| 28 | 10.5 | 7.8 | 14.7 | 10.6 |
| 29 | 10.2 | 7.4 | 14.8 | 10.3 |
| 30 | 9.7 | 6.9 | 14.9 | 10.1 |
| 31 | 9.1 | 6.3 | 14.7 | 9.8 |
| 32 | 8.6 | 5.9 | 14.2 | 9.4 |
| 33 | 7.9 | 5.5 | 13.7 | 8.9 |
| 34 | 7.7 | 5.1 | 13.5 | 8.6 |
| 35 | 7.4 | 4.8 | 13.3 | 8.2 |
| 36 | 7.0 | 4.6 | 12.8 | 7.9 |
| 37 | 6.8 | 4.4 | 12.4 | 7.5 |
| 38 | 6.5 | 4.3 | 12.1 | 7.3 |
| 39 | 6.4 | 4.2 | 11.9 | 7.2 |
| 40 | 6.3 | 4.0 | 11.8 | 7.1 |
| 41 | 6.2 | 4.2 | 11.6 | 7.1 |
| 42 | 6.0 | 4.2 | 11.6 | 7.1 |
| 43 | 6.1 | 4.2 | 11.6 | 7.3 |
| 44 | 6.0 | 4.3 | 12.0 | 7.5 |
| 45 | 6.0 | 4.6 | 12.4 | 7.9 |
| 46 | 6.3 | 4.9 | 12.5 | 8.2 |
| 47 | 6.2 | 5.2 | 12.9 | 8.5 |
| 48 | 6.4 | 5.4 | 13.2 | 9.0 |
| 49 | 6.6 | 6.0 | 13.7 | 9.6 |
| 50 | 6.9 | 6.4 | 14.2 | 10.3 |
| 51 | 7.0 | 6.8 | 14.8 | 10.8 |
| 52 | 7.2 | 7.5 | 15.0 | 11.5 |
| 53 | 7.3 | 8.0 | 15.2 | 12.2 |
| 54 | 7.7 | 8.9 | 15.7 | 13.1 |
| 55 | 7.6 | 9.5 | 15.7 | 13.8 |
| 56 | 7.8 | 10.5 | 15.9 | 14.7 |
| 57 | 8.1 | 11.5 | 16.1 | 15.4 |
| 58 | 8.1 | 12.7 | 16.1 | 16.2 |
| 59 | 8.3 | 14.0 | 16.3 | 17.1 |
| 60 | 8.4 | 15.3 | 16.4 | 17.8 |
| 61 | 8.6 | 16.7 | 16.3 | 18.9 |
| 62 | 9.0 | 18.4 | 16.4 | 19.8 |
| 63 | 9.2 | 20.1 | 16.5 | 20.7 |
| 64 | 9.4 | 21.8 | 16.3 | 21.4 |
| 65 | 9.9 | 23.5 | 16.5 | 22.2 |
| 66 | 10.5 | 25.7 | 16.2 | 23.0 |
| 67 | 10.7 | 27.2 | 16.2 | 24.1 |
| 68 | 11.2 | 29.1 | 16.0 | 24.9 |
| 69 | 11.8 | 31.3 | 15.9 | 25.9 |
| 70 | 12.1 | 33.0 | 16.0 | 26.9 |
| 71 | 12.8 | 34.6 | 16.0 | 28.0 |
| 72 | 13.4 | 37.0 | 15.9 | 29.0 |
| 73 | 13.9 | 38.3 | 15.8 | 30.3 |
| 74 | 14.3 | 40.0 | 16.2 | 31.4 |
| 75 | 15.1 | 41.3 | 16.4 | 32.6 |
| 76 | 16.1 | 43.0 | 16.2 | 33.8 |
| 77 | 16.8 | 44.6 | 16.6 | 35.5 |
| 78 | 17.5 | 45.8 | 17.1 | 37.4 |
| 79 | 18.5 | 46.9 | 17.6 | 38.6 |
| 80 | 19.4 | 47.1 | 17.9 | 40.7 |
| 81 | 19.9 | 47.8 | 18.5 | 42.6 |
| 82 | 20.7 | 48.6 | 19.8 | 44.1 |
| 83 | 21.4 | 48.5 | 20.7 | 45.9 |
| 84 | 22.5 | 48.0 | 21.4 | 48.1 |
| 85 and over | 23.4 | 43.3 | 26.8 | 53.9 |
| Source: Statistics Canada, Census of Population, 1981 and 2016. | ||||
These developments reflect two key societal trends that occurred over the 35-year period. The relatively large increase in the prevalence of living alone among men in recent decades relates in part to the increasing rates of union dissolution that occurred during this period. While co-parenting following a separation or divorce is on the rise, children remain more likely to hold primary residence with their mother.Note As a result, post-separation or divorce, fathers are more likely to live alone at least for a period of time. The decrease in the share of senior women living alone relates largely to accelerated improvements in male life expectancy in recent decades, which have resulted in relatively fewer senior women living alone as widows.Note For men, however, improvements in life expectancy have also increased the prevalence of living alone at older ages. As a result, the gap in the prevalence of living alone between the sexes has narrowed for seniors in recent years: in 2016, men accounted for 32% of seniors living alone, up from 23% in 1981.
The trends in improving male life expectancy and rising union dissolution rates have changed the marital status profile of the population living alone. Between 1981 and 2016, the share of solo dwellers who were widowed decreased from 33% to 22%, while the share of those who were separated or divorced increased from 21% to 31%. The growth in separated or divorced solo dwellers was largest within the senior population: between 1981 and 2016, the share of seniors living alone that were separated or divorced more than tripled, from 9% to 32% (Chart 5).
Data table for Chart 5
| Legal marital status | Age group and year | |||||||
|---|---|---|---|---|---|---|---|---|
| 15 and over | 20 to 34 | 35 to 64 | 65 and over | |||||
| 1981 | 2016 | 1981 | 2016 | 1981 | 2016 | 1981 | 2016 | |
| percent | ||||||||
| MarriedData table Note 1 | 2.0 | 2.1 | 1.2 | 1.7 | 2.6 | 2.2 | 2.1 | 2.1 |
| Never married | 44.4 | 45.8 | 81.9 | 93.5 | 37.0 | 52.3 | 14.8 | 13.4 |
| Separated or divorced | 20.6 | 30.5 | 16.6 | 4.4 | 37.1 | 39.2 | 8.7 | 32.3 |
| Widowed | 33.0 | 21.6 | 0.4 | 0.4 | 23.3 | 6.4 | 74.4 | 52.2 |
|
||||||||
Reflecting differences in life expectancy between the sexes and the fact that women tend to marry men older than them, the predominant marital status of seniors who live alone differs by sex. Across all age groups in 2016, male solo dwellers were more likely than their female counterparts to never have married. Widowhood was the most common marital status among senior women who lived alone in 2016 (60%), while being separated or divorced was most common for senior men who lived alone (41%).Note
Young adults who are solo dwellers have relatively high education and labour force participation rates
The socioeconomic profiles of the population living alone and the population living with othersNote differ depending on whether they are measured through education, labour force participation or housing affordability indicators. Within the population that lives alone there are also clear differences in the socioeconomic situation of younger versus older adults, reflecting the diversity of the daily realities and experiences of persons with this living arrangement.
Like the general population, the population living alone has become more educated over time. However, solo dwellers demonstrate different patterns in terms of educational attainment than persons who live with others. Young adults who lived alone in 2016 were more likely to have either college or university qualifications than their counterparts in the same age group who lived with others. This was particularly the case for young females aged 25 to 34,Note among whom 77% of solo dwellers had a college or university certificate or diploma compared with 67% of those who lived with others. In contrast, the opposite situation occurs at older ages, when persons who lived alone were less likely to have a college or university certificate or diploma than those who lived with others, regardless of sex.Note Similar patterns were found for labour force activity: young adults living alone had higher labour force participation ratesNote in 2016 than their counterparts in the same age group who lived with others, while the opposite was true for older adults (Chart 6).
Data table for Chart 6
| Living arrangement | Age group | |||
|---|---|---|---|---|
| 15 and over | 20 to 34 | 35 to 64 | 65 and over | |
| percent | ||||
| Persons living alone | 54.1 | 88.7 | 73.9 | 11.5 |
| Persons living with others | 67.0 | 82.1 | 79.7 | 16.2 |
| Source: Statistics Canada, Census of Population, 2016. | ||||
Young adults who pursue higher education are generally more likely to have their first child at relatively older ages,Note perhaps increasing the likelihood that they will live alone compared with those with lower educational attainment. In contrast, older solo dwellers may be more likely than younger adults to arrive at their living situation as a result of the death of a spouse or unforeseen circumstances such as the dissolution of a union.
Close to one half of young adults living alone had monthly shelter costs considered not affordable
Individuals who live by themselves must manage expenses such as housing, utilities, food and entertainment on a single income in most cases, while those living in a household with others can take advantage of economies of scale in managing these expenses.Note Managing shelter costs may be more of a financial strain for those who live alone than for those who live with others.
The proportion of one-person households with monthly shelter costsNote considered not affordable (meaning 30% or more of average monthly household income) in 2016 was more than double the proportion among other household types (41% versus 17%). Shelter costs were particularly expensive for young adults who lived alone in 2016: close to one-half (48%) of solo dwellers aged 20 to 34 had shelter costs that were considered unaffordable. This pattern may relate in part to the fact that young adults living alone were more likely than their older counterparts to live in urban areas where housing costs tend to be higher.
Among persons living alone in 2016, 1 in 5 resided in a condominium
Persons who live alone demonstrate different housing needs and preferences than persons who live with others. Although single-detached houses were the most common dwelling type in Canada, persons who live alone were more likely to live in apartment buildings of various configurations (Chart 7). As with other characteristics of the population that lives alone, the prominent dwelling type varied by age: seniors who lived alone were more likely to live in a single-detached house (39%) than their counterparts aged 20 to 34 (18%). This likely relates to the fact that many older adults who lived alone were widowed and still occupied the home they once shared with their spouse.Note
Data table for Chart 7
| Dwelling type | Persons living alone | Persons living with others |
|---|---|---|
| percent | ||
| Single-detached house | 32.4 | 63.9 |
| Apartment in a building with five or more storeys | 17.7 | 6.2 |
| Apartment in a building with less than five storeys | 32.6 | 11.0 |
| Apartment or flat in a duplex | 5.9 | 5.5 |
| Other dwellings | 11.2 | 13.4 |
|
Note: "Other dwellings" refer to semi-detached houses, row houses, other single-attached houses and movable dwellings. Source: Statistics Canada, Census of Population, 2016. |
||
Persons who live alone had a lower rate of home ownershipNote than other households in 2016. This difference may reflect greater financial difficulty in accessing home ownership when living solo. Alternatively, this pattern may be a matter of preference: for some individuals who enjoy the greater freedom associated with living alone, renting may be more attractive to them because it is more flexible. That said, home ownership rates for the population that lives alone have increased over time—from 32% in 1981 to 50% in 2016—and this growth has been faster than that of other primary household maintainers (from 70% in 1981 to 75% in 2016). Home ownership grew fastest among female solo dwellers aged 20 to 34, whose rates more than tripled between 1981 (8%) and 2016 (27%), an increase that may relate to the growth of higher educational attainment and labour force participation of young women over this period.
The general increase in home ownership over the past 35 years among persons living alone could be linked to the rise in the supply of condominiumsNote over the period. Condominiums tend to be more economical and offer smaller living quarters than other forms of home ownership, possibly making them more accessible and appealing to individuals who live alone. Among those solo dwellers who owned their homes in 2016, 28% owned condominiums, more than triple the share in 1981 (7%). Overall, one-fifth (20%) of persons living alone resided in a condominium in 2016 whether they owned or rented it, and this housing type was most popular among young adults (Chart 8).

Data table for Chart 8
| Living arrangement | Age group | |||
|---|---|---|---|---|
| 15 and over | 20 to 34 | 35 to 64 | 65 and over | |
| percent | ||||
| Persons living alone | 20.2 | 27.3 | 18.8 | 18.5 |
| Persons living with others | 9.7 | 12.3 | 8.3 | 11.7 |
| Source: Statistics Canada, Census of Population, 2016. | ||||
The census data above show that the characteristics of the population living alone have evolved considerably over the last few decades. Over the same period, families have also become more varied, flexible and complex. The growing prevalence of common-law unions means that legal marital status cannot fully capture the conjugal history of individuals who are currently living alone. The growth in shared parenting following a union dissolution and living apart together (LAT) relationshipsNote , among other trends, have resulted in more individuals alternating their time between two or more residences. As a result of these changes, it is expected that a considerable share of persons who live alone may have close family relationships with people they may live or spend time with on a regular basis (for example, young children or non-coresiding partners). These important social connections undoubtedly impact their day-to-day lives even though they usuallyNote live alone. In addition, as the onset of many milestones such as forming a union or having a child have become increasingly delayed, young adults living alone may be more likely than other solo dwellers to consider living alone a temporary situation.
In the remainder of this article, data from the 2017 General Social Survey on Family are used to examine the conjugal, fertility and parenting characteristics of the population aged 20 and over that lives alone.
Most persons who live alone have previously partnered and have at least one child
According to the 2017 GSS, the majority (72%) of persons aged 20 and over that were living alone had previously lived as part of a married or common-law couple (Table 1). In other words, most individuals living alone in 2017 had not always lived alone. As might be expected, younger solo dwellers aged 20 to 34 were less likely to have ever been part of a couple (35%) than their older counterparts (90% of those aged 65 and over).
| Age group | ||||||||||||
|---|---|---|---|---|---|---|---|---|---|---|---|---|
| 20 and over | 20 to 34 | 35 to 64 | 65 and over | |||||||||
| Proportion | 95% confidence interval | Proportion | 95% confidence interval | Proportion | 95% confidence interval | Proportion | 95% confidence interval | |||||
| From | To | From | To | From | To | From | To | |||||
| percent | ||||||||||||
| Has been in a union (married or common law) | ||||||||||||
| Both sexes | 72.2 | 70.8 | 73.5 | 34.7 | 31.1 | 38.6 | 69.4 | 67.1 | 71.5 | 90.0 | 88.7 | 91.2 |
| Men | 62.5 | 60.1 | 64.7 | 29.8 | 25.3 | 34.7 | 64.7 | 61.5 | 67.7 | 84.8 | 81.5 | 87.5 |
| Women | 79.7Table 1 Note † | 78.1 | 81.3 | 41.4Table 1 Note † | 35.4 | 47.6 | 74.8Table 1 Note † | 71.9 | 77.5 | 92.1Table 1 Note † | 90.6 | 93.3 |
| Has separated or divorced in the last 20 years | ||||||||||||
| Both sexes | 29.9 | 28.6 | 31.3 | 30.1 | 26.6 | 33.9 | 46.4 | 44.1 | 48.8 | 13.2 | 11.9 | 14.7 |
| Men | 34.8 | 32.7 | 37.0 | 25.6 | 21.4 | 30.4 | 46.1 | 43.0 | 49.3 | 20.6 | 17.6 | 23.9 |
| Women | 26.1Table 1 Note † | 24.5 | 27.8 | 36.1Table 1 Note † | 30.2 | 42.4 | 46.8 | 43.6 | 50.1 | 10.3Table 1 Note † | 8.9 | 12.0 |
| Has at least one child | ||||||||||||
| Both sexes | 54.6 | 53.1 | 56.1 | 4.7 | 3.2 | 6.7 | 46.4 | 44.1 | 48.7 | 82.9 | 81.2 | 84.5 |
| Men | 43.1 | 40.7 | 45.4 | 6.3 | 4.2 | 9.5 | 41.9 | 38.8 | 45.0 | 75.3 | 71.5 | 78.7 |
| Women | 63.6Table 1 Note † | 61.7 | 65.6 | 2.5Table 1 Note † | 1.1 | 4.9 | 51.7Table 1 Note † | 48.2 | 55.2 | 85.9Table 1 Note † | 84.0 | 87.7 |
|
||||||||||||
Regardless of age, men who lived alone were significantly less likely than their female counterparts to have ever been part of a couple. Male solo dwellers aged 35 and over were also generally less likely than female solo dwellers in the same age group to have been the birth, step or adoptive parent of at least one child, suggesting they may be at greater risk of social isolation as a result of having fewer connections with close kin (see the section titled Alone, but not necessarily lonely: The relationship between living alone and well-being). Overall, however, most persons living alone in 2017 had parented at least one child (55%). As with conjugal history, seniors living alone were much more likely to have parented at least one child (83%) than younger adult solo dwellers (5%).
Following the dissolution of a union involving young children, it can be challenging for individuals who do not share primary residence with their children to renegotiate time-sharing arrangements, general decision making and financial expenditures, among other important parenting tasks.Note Relatively few young adults and seniors living alone have a dependent child (aged 18 or under) from a previous relationship, but this situation is more common among middle-aged solo dwellers. According to the 2017 GSS, close to one-half (46%) of persons aged 35 to 64 who lived alone had experienced a separation or divorce within the last 20 years. Of these, about 1 in 5 (or 93,460) solo dwellers had at least one dependent child from a previous union. Most (59%) of these individuals indicated that their child lived with them for some period of time in the last 12 months (Chart 9).Note Living with a child, even if only on a periodic basis, is likely to impact the decisions and consumption patterns of solo dwellers regarding housing, furniture, entertainment, food and other daily essentials.

Data table for Chart 9
| Actions | Proportion | 95% confidence interval | |
|---|---|---|---|
| From | To | ||
| percent | |||
| Paid child support | 24.4 | 19.4 | 30.2 |
| Saw their childData table Note 1 at least once a week | 47.5 | 37.5 | 57.7 |
| Made major decisions about their child’s health, religion and/or education together or alternatively with ex-spouse or ex-partner |
50.0 | 39.9 | 60.1 |
| Contacted their childData table Note 1 at least once a week by telephone, text, email or video chat |
74.0 | 64.0 | 82.0 |
| Child lived with them for some period of time | 58.8 | 47.8 | 68.9 |
|
|||
Aside from sharing a home periodically, there are other ways of maintaining involvement and contact with a child following a separation or divorce. Among solo dwellers aged 35 to 64 with a dependent child, a large majority (74%) indicated that they contacted their child at least once a week when their child was not living with them, whether by telephone, text, email or video chat. In addition, close to one-half indicated that they (a) shared in the decision-making processes regarding their dependent child’s health, religion and/or education (50%); or (b) saw their child at least once a week when their child was not living with them (48%). Separated or divorced solo dwellers may also contribute financially to their child’s upbringing: close to one-quarter (24%) of middle-aged separated or divorced individuals with a dependent child paid child support in 2017.
One-third of young adult solo dwellers were in a living apart together (LAT) relationship
Persons living alone may be in a couple relationship with someone who resides elsewhere. In the GSS, individuals who are neither married nor living common law but who are in a couple relationship with someone living in another dwelling at the time of the survey are considered to be in a living apart together (LAT) relationship. According to the 2017 GSS, 17% of solo dwellers aged 20 and over were in a LAT relationship (Table 2). Having a life partner is likely to impact the routines of individuals who usually reside alone—particularly their commuting and consumption behaviours (for example, if they visit their partner throughout the year).
| Age group | ||||||||||||
|---|---|---|---|---|---|---|---|---|---|---|---|---|
| 20 and over | 20 to 34 | 35 to 64 | 65 and over | |||||||||
| Proportion | 95% confidence interval | Proportion | 95% confidence interval | Proportion | 95% confidence interval | Proportion | 95% confidence interval | |||||
| From | To | From | To | From | To | From | To | |||||
| percent | ||||||||||||
| In a (LAT) relationship | ||||||||||||
| Both sexes | 16.5 | 15.4 | 17.7 | 33.4 | 29.4 | 37.5 | 20.2 | 18.2 | 22.1 | 6.2 | 5.2 | 7.3 |
| Men | 22.5 | 20.5 | 24.7 | 33.8 | 28.6 | 39.4 | 23.1 | 20.2 | 26.2 | 12.1 | 9.7 | 15.1 |
| Women | 11.9Table 2 Note † | 10.6 | 13.4 | 32.8 | 27 | 39.2 | 16.8Table 2 Note † | 14.1 | 19.5 | 3.9Table 2 Note † | 3.0 | 4.9 |
|
||||||||||||
LAT relationships are more prevalent among young adultsNote , and this is also true for the population living alone. Among solo dwellers who were neither married nor living common law, 1 in 3 (33%) of those aged 20 to 34 were in a LAT couple, compared with 20% of those aged 35 to 64 and 6% of seniors. While LAT relationships were equally popular among young adults of both sexes, at older ages male solo dwellers were significantly more likely to be in a LAT relationship than their female counterparts. For instance, among senior solo dwellers, men were three times more likely to be in a LAT relationship than women (12% versus 4%).
Most young adults do not intend to continue living alone
While living alone has grown in popularity among young adults in recent years, most young solo dwellers appear to consider their living arrangement temporary. When asked about their future intentions, most individuals aged 20 to 34 who were living alone and not in a couple relationship in 2017 stated that they were open to living in a common-law union in the future (72%) or that they intended to (re)marry in the future (60%) (Table 3). In addition, most young adults living alone stated that they intended to have a child (or another child) (67%)Note some day.Note
| Age group | ||||||||||||
|---|---|---|---|---|---|---|---|---|---|---|---|---|
| 20 and over | 20 to 34 | 35 to 64 | 65 and over | |||||||||
| Proportion | 95% Confidence interval | Proportion | 95% Confidence interval | Proportion | 95% Confidence interval | Proportion | 95% Confidence interval | |||||
| From | To | From | To | From | To | From | To | |||||
| percent | ||||||||||||
| Intend to marry or remarry | ||||||||||||
| Both sexes | 15.8 | 14.6 | 17.2 | 59.7 | 54.5 | 64.7 | 17.5 | 15.5 | 19.8 | 1.9 | 1.4 | 2.7 |
| Men | 23.6 | 21.2 | 26.1 | 57.9 | 51.3 | 64.2 | 21.4 | 18.2 | 24.9 | 4.3 | 2.5 | 6.7 |
| Women | 10.8Table 3 Note † | 9.4 | 12.4 | 62.1 | 53.5 | 70.0 | 13.4Table 3 Note † | 11.0 | 16.2 | 1.2Table 3 Note † | 0.7 | 1.9 |
| Think they could live in a common-law relationship | ||||||||||||
| Both sexes | 33.6 | 32.0 | 35.3 | 72.0 | 66.8 | 76.4 | 46.5 | 43.8 | 49.1 | 11.8 | 10.5 | 13.3 |
| Men | 48.0 | 45.3 | 50.8 | 72.9 | 66.0 | 78.5 | 53.9 | 50.1 | 57.7 | 22.9 | 19.3 | 26.8 |
| Women | 23.8Table 3 Note † | 22.0 | 25.7 | 70.7 | 62.7 | 77.6 | 38.5Table 3 Note † | 35.2 | 42.0 | 7.9Table 3 Note † | 6.6 | 9.4 |
|
||||||||||||
Repartnering—whether after the death of a spouse or partner or following the dissolution of a union—is on the rise among seniors, but rates remain fairly low.Note As noted earlier, most senior solo dwellers have lived as part of a couple in the past. This may explain, to some extent, why seniors living alone were less likely than their younger adult counterparts to have the intention to form a union (whether through marriage or a common-law relationship) in the future. That said, an increasing number of seniors are choosing to form common-law unions when they repartner.Note Reflecting this pattern, seniors living alone were six times as likely to state that they might live in a common-law union in the future (12%) as they were to state that they intended to (re)marry in the future (2%). Among senior solo dwellers, men were significantly more likely than women to intend to form a union in the future.
Conclusion
As the number of persons living alone in Canada has grown over time, the characteristics of this population have become more diverse. In recent decades, living alone has grown in popularity in young and middle adulthood, among men of all ages, and for both sexes following a separation or divorce. With these shifts, pathways to living alone and future intentions have also become more varied. For some individuals, living alone is seen as a transitional situation before forming a family. For others, it has become a more enduring lifestyle that was not necessarily planned or desired, but that occurred as a result of circumstances. Other individuals may see living alone as a preferred way of life. Despite living alone, many individuals have close ties with loved ones, such as children from a previous relationship or partners they do not live with. The day-to-day realities and challenges of living alone vary depending on an individual’s history and their stage of life.
While there are many contrasting experiences among those who live alone, this study found that solo dwellers also share many common experiences. Regardless of age or sex, persons who live alone are less likely to own their home and are more likely to live in a condominium than persons who live with others. Solo dwellers are also more likely to experience financial strains, like unaffordable shelter costs, than persons who can reap the economies of scale associated with living with others. As living alone comes to represent the situation of an increasingly large segment of the Canadian population, housing demands and affordability issues associated with this lifestyle may grow in importance within society.
Will living alone continue to be the predominant household type in the future? While the pace of growth of one-person households has slowed in recent decades,Note there is no strong indication that this living arrangement will decrease in prevalence in the coming years, either in CanadaNote or in other industrialized countries.Note As Canada experiences peak population aging over the next two decades,Note the share of the population that lives alone is likely to continue to increase simply due to the fact that living alone is more predominant among seniors. Furthermore, the age of social media has greatly facilitated this lifestyle, allowing most individuals to communicate easily with the outside world despite living alone.
That said, several societal trends could slow the growth in living alone in the future. As male life expectancy converges with that of females, more seniors may be able to continue living with their spouse or partner until increasingly older ages. As explored in this study, this trend has already led to a substantial decrease in the share of senior women living alone over the last several decades. Moreover, as the characteristics of the senior population become more ethnoculturally diverse,Note alternative arrangements, like living with relatives in a multigenerational household, may grow in popularity. Across all ages, rising housing costs in the country’s urban centres could lead to growth in the popularity of living with roommates as an alternative to living alone out of financial necessity. Overall, however, it is reasonable to expect that, in the coming years, Canadian society will increasingly be shaped around the diverse needs and preferences of individuals who live alone.
Jackie Tang is an analyst, Nora Galbraith is a senior analyst and Johnny Truong is a data production and dissemination officer with the Demography Division at Statistics Canada.
Start of text box
Data sources, methods and definitions
Data sources
Data used in this article are derived from the Census of Population (1981 to 2016) and the 2017 General Social Survey (Cycle 31).
Further information on the census can be found in the Guide to the Census of Population, 2016, Statistics Canada Catalogue no. 98-304-X.
The General Social Survey (GSS) is a voluntary cross-sectional survey whose target population consists of non-institutionalized persons aged 15 and over living in the 10 Canadian provinces. The GSS is collected every year on different themes. The family cycle is generally collected every five years. The overall survey response rate was 52.4%, yielding a sample of 20,602 respondents. This article focuses on the population aged 20 and over, which is represented by a sample of 19,902 respondents. See the 2017 General Social Survey on Family (Cycle 31) for additional information.
Methods
To ensure the confidentiality of responses collected for the Census of Population, a random rounding process is used to alter the values reported in individual cells. As a result, when these data are summed or grouped, the total value may not match the sum of the individual values since the total and subtotals are independently rounded. Similarly, percentage distributions, which are calculated on rounded data, may not necessarily add up to 100%.
To account for the complex sampling design of the GSS, all analyses were weighted using person weights. All of the proportions were evaluated in terms of sampling variance using the replicate weights (standard bootstrap weights) generated by Statistics Canada. The 95% confidence intervals were derived in the SUDAAN PROC CROSSTAB, either using the logit transformation method or, for estimated proportions of 5% and less, using the method for computing small proportion confidence intervals. The confidence intervals are published in tables, as is an indicator signifying when differences are significant with a p-value < 0.05. These indicators are based on testing of the individual hypotheses in SUDAAN PROC DESCRIPT.
With regard to the proportions presented in this article that were derived from the GSS data, proportions were calculated using a denominator that includes all cases of item non-response for the characteristic of interest. Cases of item non-response represented no more than 5% of the unweighted count for the characteristic of interest. Proportions required an unweighted denominator count of at least 15 in order to be released.
Definitions
Unless otherwise stated, statistics in this article derived from the census are restricted to the population aged 15 and over living in private households. Since the population aged 15 to 19 that lives alone is very small, analysis of trends by age group in this article focus on the population aged 20 and over. Similarly, statistics in this article derived from the GSS are restricted to the non-institutionalized population aged 20 and over living in the 10 provinces.
Living arrangements can be examined from the individual, family or household perspective. The number of one-person households is equal to the number of persons living alone.
The census definition of living alone is based on the concepts of usual place of residence and household living arrangements. Each individual is counted as residing at one and only one dwelling and in one household. Part-time living situations are not captured. As a result, many persons categorized as living alone in the census may have family members or other persons staying with them for part of the year. The census takes a snapshot of living arrangements on census day; it does not capture how long an individual has been living alone or whether it is a temporary situation for the individual.
Similar rules regarding usual place of residence are applied in the General Social Survey (GSS) to categorize individuals as living alone. However, using information collected in the GSS on conjugal and parenting history, time spent with children and future intentions in terms of childbearing or union formation, it is possible to gather a more detailed picture of the situation of persons categorized as living alone.
End of text box
Start of text box
Quebec: The living alone capital of Canada
In Quebec, 18% of the population aged 15 and over lived alone in 2016, the highest share for all provinces and territories. Moreover, among them, Quebec has experienced the highest growth in the prevalence of living alone since 1981, moving from below the national average to increasingly above it by 2016 (Chart 10).
Data table for Chart 10
| Year | Canada | Quebec |
|---|---|---|
| percent | ||
| 1981 | 9.2 | 8.7 |
| 1986 | 10.0 | 10.1 |
| 1991 | 10.9 | 12.1 |
| 1996 | 11.7 | 13.7 |
| 2001 | 12.5 | 15.2 |
| 2006 | 13.0 | 15.9 |
| 2011 | 13.5 | 16.9 |
| 2016 | 13.9 | 17.7 |
| Source: Statistics Canada, Census of Population, 1981 to 2016. | ||
An examination of Canada’s subprovincial areas reveals a similar pattern. Among Canada’s census metropolitan areas (CMAs), three in Quebec had the highest proportions of solo living: Trois-Rivières (21%), Sherbrooke (20%) and Québec (20%).
The greater prevalence of living alone in Quebec cannot be attributed solely to its older age structure. In fact, the prevalence of living alone at the oldest ages (85 and over) is relatively low in Quebec: the rates of living in collective dwellings such as retirement homes and assisted living facilities are considerably higher in the province than elsewhere in Canada.Note
Generally, certain economic and social conditions must be present for living alone to become a prevalent lifestyle within a society.Note It has been argued that many of the sociocultural and economic developments that occurred in Quebec beginning in the 20th century, referred to as the Quiet Revolution, included an evolution towards a more individualistic orientation that may have led to more persons living alone by choice.Note Furthermore, shelter costs are relatively low in Quebec’s CMAs,Note which could facilitate solo living among those who choose this option. The province of Quebec also has a tax credit for persons who live alone under certain conditions,Note which may assist the solo lifestyle to some extent.
End of text box
Start of text box
Alone, but not necessarily lonely: The relationship between living alone and well-being
Social connections play an important role in an individual’s life satisfaction and health.Note There is some evidence that individuals who live alone are generally more likely to report social isolation or loneliness than those who live with others.Note Results from the 2017 General Social Survey indicate that persons living alone reported lower levels of self-rated health, mental health and satisfaction with life overall compared with persons living with others, regardless of sex or age group (Table 4).
| Age group | ||||||||||||
|---|---|---|---|---|---|---|---|---|---|---|---|---|
| 20 and over | 20 to 34 | 35 to 64 | 65 and over | |||||||||
| Proportion | 95% confidence interval | Proportion | 95% confidence interval | Proportion | 95% confidence interval | Proportion | 95% confidence interval | |||||
| From | To | From | To | From | To | From | To | |||||
| percent | ||||||||||||
| Both sexes | ||||||||||||
| Rating of health as very good or excellent | ||||||||||||
| Persons living alone | 49.2Table 4 Note † | 47.7 | 50.7 | 62.4 | 58.2 | 66.5 | 49.8Table 4 Note † | 47.6 | 52.1 | 43.3 | 41.1 | 45.5 |
| Persons living with others | 57.8 | 56.8 | 58.8 | 66.1 | 63.9 | 68.3 | 58.2 | 56.8 | 59.5 | 43.2 | 41.3 | 45.2 |
| Rating of mental health as very good or excellent | ||||||||||||
| Persons living alone | 59.8Table 4 Note † | 58.4 | 61.3 | 58.3Table 4 Note † | 54.1 | 62.4 | 57.7Table 4 Note † | 55.4 | 59.9 | 62.7 | 60.5 | 64.7 |
| Persons living with others | 64.9 | 63.9 | 65.9 | 64.9 | 62.7 | 67.1 | 65.5 | 64.1 | 66.9 | 62.9 | 60.9 | 64.9 |
| High satisfaction with life overallTable 4 Note 1 | ||||||||||||
| Persons living alone | 61.0Table 4 Note † | 59.6 | 62.5 | 57.2Table 4 Note † | 52.8 | 61.4 | 54.4Table 4 Note † | 52.1 | 56.6 | 69.3Table 4 Note † | 67.1 | 71.4 |
| Persons living with others | 72.0 | 71.0 | 73.0 | 67.6 | 65.4 | 69.6 | 72.8 | 71.4 | 74.1 | 76.8 | 74.8 | 78.6 |
| Men | ||||||||||||
| Rating of health as very good or excellent | ||||||||||||
| Persons living alone | 50.1Table 4 Note † | 47.8 | 52.5 | 63.5 | 58.1 | 68.5 | 49.4Table 4 Note † | 46.2 | 52.6 | 40.8 | 36.6 | 45.0 |
| Persons living with others | 57.7 | 56.3 | 59.1 | 67.4 | 64.2 | 70.4 | 57.8 | 55.8 | 59.7 | 43.2 | 40.4 | 46.0 |
| Rating of mental health as very good or excellent | ||||||||||||
| Persons living alone | 59.3Table 4 Note † | 56.9 | 61.6 | 62.9 | 57.6 | 67.9 | 57.9Table 4 Note † | 54.7 | 61.0 | 58.9 | 54.8 | 62.9 |
| Persons living with others | 66.4 | 65.0 | 67.8 | 67.7 | 64.6 | 70.8 | 67.2 | 65.3 | 69.0 | 62.2 | 59.3 | 65.0 |
| High satisfaction with life overallTable 4 Note 1 | ||||||||||||
| Persons living alone | 57.0Table 4 Note † | 54.6 | 59.4 | 60.3 | 55.1 | 65.3 | 52.9Table 4 Note † | 49.5 | 56.3 | 62.2Table 4 Note † | 58.1 | 66.1 |
| Persons living with others | 71.7 | 70.2 | 73.1 | 66.4 | 63.3 | 69.4 | 73.1 | 71.1 | 75.0 | 75.8 | 73.1 | 78.4 |
| Women | ||||||||||||
| Rating of health as very good or excellent | ||||||||||||
| Persons living alone | 48.5Table 4 Note † | 46.5 | 50.4 | 61.0 | 54.4 | 67.3 | 50.4Table 4 Note † | 47.2 | 53.5 | 44.2 | 41.6 | 46.9 |
| Persons living with others | 57.9 | 56.5 | 59.3 | 64.9 | 61.8 | 67.8 | 58.6 | 56.8 | 60.4 | 43.2 | 40.4 | 46.2 |
| Rating of mental health as very good or excellent | ||||||||||||
| Persons living alone | 60.3Table 4 Note † | 58.3 | 62.2 | 52.1Table 4 Note †Table 4 Note ‡ | 45.8 | 58.4 | 57.4Table 4 Note † | 54.2 | 60.5 | 64.1Table 4 Note ‡ | 61.5 | 66.7 |
| Persons living with others | 63.4Table 4 Note ‡ | 61.9 | 64.8 | 62.1Table 4 Note ‡ | 58.9 | 65.2 | 63.9Table 4 Note ‡ | 62.0 | 65.7 | 63.7 | 60.8 | 66.6 |
| High satisfaction with life overallTable 4 Note 1 | ||||||||||||
| Persons living alone | 64.2Table 4 Note †Table 4 Note ‡ | 62.2 | 66.1 | 53.0Table 4 Note † | 46.4 | 59.4 | 56.0Table 4 Note † | 52.8 | 59.2 | 72.1Table 4 Note †Table 4 Note ‡ | 69.4 | 74.6 |
| Persons living with others | 72.3 | 70.9 | 73.6 | 68.7 | 65.6 | 71.7 | 72.5 | 70.8 | 74.1 | 77.8 | 75.2 | 80.3 |
|
||||||||||||
However, living alone should not be assumed to cause loneliness or social isolation since the relationships between these phenomena are complex. Other correlated characteristics such as age, marital status, economic situation and cultural setting may play a more instrumental role in an individual’s well-being than their specific living arrangement.Note
Although living alone may be a lonely experience at times for some individuals, isolation can nonetheless be lessened or avoided by maintaining close contact with friends, family and neighbours.Note Results from the GSS do not support the view that female widows are unhappy: among all solo dwellers, senior women were the most likely to report high levels of life satisfaction in 2017 (72%), significantly more than their male counterparts in the same age group (62%). This echoes previous Canadian findingsNote suggesting that many senior women who live alone may avoid social isolation by actively participating in their community and engaging with others on a regular basis. Since seniors who have strong social connections are less likely to require health services, the World Health Organization has advocated for social participation and connectedness as key tools for improving the physical health of seniors.Note
End of text box
- Date modified: