
Insights on Canadian Society
Results from the 2016 Census: Syrian refugees who resettled in Canada in 2015 and 2016

Archived Content
Information identified as archived is provided for reference, research or recordkeeping purposes. It is not subject to the Government of Canada Web Standards and has not been altered or updated since it was archived. Please "contact us" to request a format other than those available.
by René Houle

Skip to text
Text begins
Start of text box

Today, Insights on Canadian Society is releasing a study based on 2016 Census
data in order to examine the demographic situation and socioeconomic conditions of the Syrian refugee population living in Canada in 2016. This study benefited from analytical work done by Nazih Nasrallah on the situation of refugees in Canada.
End of text box
Start of text box
In this study, data from the 2016 Census are used to examine the sociodemographic profile and employment situation of Syrian refugees who resettled in Canada between January 1, 2015, and May 10, 2016, and who were still living in Canada at the time of the census. Data from the 2016 Longitudinal Immigration Database (IMDB) are also used to examine the income situation in 2016 of refugees who were admitted to Canada in November and December 2015.
- According to the 2016 Census, approximately 25,000 Syrian refugees landed between January 1, 2015 and May 10, 2016 and were still living in Canada on Census Day. Among these, 53% were assisted by the government.
- Syrian refugees are younger than refugees from other countries. Also, couples with children accounted for 85% of Syrian refugee families. This compared with 63% among refugee families from other countries.
- About 20% of government-assisted Syrian refugees knew English or French, compared with 67% of privately sponsored refugees. Less than 3% of government-assisted Syrian refugees had a university degree, compared with 25% of those who were privately sponsored.
- At the time of the 2016 Census, 33% of Syrian refugees were living in the Montréal and Toronto census metropolitan areas (CMAs). In comparison, 29% of refugees from other countries lived in these two CMAs.
- In 2016, 24% of male refugees from Syria were employed, compared with 39% among those from other countries. Among Syrian female refugees, 8% were employed, compared with 17% of female refugees from other countries.
- The difference between the employment rates of Syrian refugees and refugees from other countries was mostly due to the admission period, because Syrian refugees landed in Canada more recently than refugees from other countries.
End of text box
Introduction
On September 8, 2015, 4.1 million Syrian refugees were registered with the Office of the United Nations High Commissioner for Refugees (UNHCR), including close to 2 million in Turkey and over 1.1 million in Lebanon.Note Based on the most recent UNHCR data, there were an estimated 6.3 million Syrian refugees at the end of 2017, or 2 million more than in 2015, the majority of whom were still living in Turkey and Lebanon.Note In 2015 and 2017, Syria had the largest population of displaced refugees in the world based on UNHCR criteria and, by the end of 2017, nearly 1 in 10 of the world’s refugees were from Syria.Note
In recent years, Canada welcomed a number of Syrian refugees. According to the Census, Syria was the main source country of refugees who recently landed in Canada (between 2011 and 2016) and who still lived in the country in 2016.Note While the number of Syrian refugees who settled in Canada has increased since then,Note the 2016 Census data enumerated 26,550 Syrian refugees who landed between 2011 and 2016, the majority of whom arrived between December 2015 and February 2016. There is little socioeconomic information about this population—despite ongoing discussion in the media about the difficulties that they can face, for instance in finding employment.Note
This study uses 2016 Census data to obtain a profile of the Syrian refugees who resettled in Canada in 2015 and 2016, and to examine their labour force participation rate. Resettled refugees refer to those “who have been selected abroad while outside of their home country or country where they normally lived and who were granted permanent resident status on the basis of a well-founded fear of returning to that country.”Note The first section of this paper discusses the immigration context of the Syrian refugees who resettled in Canada. The second section examines some of their sociodemographic characteristics, including age and family structure, level of education, and knowledge of official languages. The third section focuses on labour force participation, which is measured by the employment rate at the time of the census.Note
Canada and the Syrian refugee crisis
The war in the Middle East and the refugee crisis it created have led to the wave of Syrian refugees who have immigrated to Canada in the past few years. After it broke out in 2011, the war in Syria rapidly transformed into a complex armed conflict involving, to varying degrees, numerous warring players and several foreign countries.Note The exodus of millions of Syrians to neighbouring countries has been a direct and ongoing consequence of this war. On November 24, 2015, the Government of Canada announced a “plan to resettle 25,000 Syrian refugees” in Canada.Note The selection and welcome plan for Syrian refugees was based on several parameters.Note
First, the plan’s target was to welcome 25,000 Syrian refugees by February 2016, including 10,000 who were expected to land by December 31, 2015, and 15,000 between January 1 and February 29, 2016. It was also expected that there would be more government-assisted refugees than privately sponsored refugees (sponsored by non-governmental organizations, individuals, or groups of individuals).
Second, the plan indicated that Canada would collaborate with the UNHCR and the Turkish government to identify refugees in Jordan, Lebanon and Turkey. More specifically, Canada asked the UNHCR and the Turkish government to “prioritize vulnerable refugees who are a low security risk, such as women at risk and complete families.”Note These conditions applied to government-assisted refugees, but not to those who were privately sponsored; however, the latter still had to be selected according to the conditions set out in the Immigration and Refugee Protection Regulations.Note
Third, it was expected, as per the plan, that after their arrival by chartered flight to Montréal or Toronto, the refugees would be relocated in various areas of the country. Privately sponsored refugees would continue on to where their sponsors lived, while government-assisted refugees would continue on to their new community.Note
In light of the parameters developed in the Syrian refugee selection and welcome plan, the first questions examined in this study are: How many Syrian refugees were government assisted? How many were privately sponsored? How many arrived in 2015 or in 2016?
The second set of questions examined in this study relates to the selection criteria for Syrian refugees. Are there more children and families in the Syrian refugee population than in other refugee populations? Are Syrian refugees more vulnerable than refugees from other countries and, if they are, how so? Are the characteristics of Syrian refugees linked to the admission category? Are their socioeconomic characteristics comparable to those of refugees from other countries admitted during the same period?
The study also sheds light on their place of residence in Canada at the time of the 2016 Census. Where in Canada did the Syrian refugees settle? Are they concentrated in a few large urban areas or have they settled throughout the country? Is their geographic distribution similar to or different than that of refugees from other countries?
Lastly, 2016 Census data are used to assess and understand the economic situation of Syrian refugees by analyzing their employment rate. Because of their vulnerability, Syrian refugees may find themselves at a disadvantage in the labour force. As mentioned above, the issue of employment among Syrian refugees has been raised on several occasions by the national press over the last two years and was also the subject of targeted investigations.Note Government-assisted refugees share two characteristics that can hinder entry into the labour market: limited language skills and lower education levels.Note
Privately sponsored refugees, like government-assisted refugees, are helped by a sponsor during their first year in the country. The private sponsor—be it an organization or a group of individuals—commits to providing financial support, as per the sponsorship program’s requirements. Furthermore, private sponsors may continue to help refugees beyond the one-year requirement. For example, sponsors may help the refugee or refugees find work or offer them extended financial assistance.Note
According to a previous study, privately sponsored refugees were selected differently than government-assisted refugees, and some of them were referred to their sponsor by Syrians who were already established in Canada.Note In contrast, government assistance was based on a set of predefined vulnerability criteria. Consequently, it is expected that privately sponsored refugees will have a different profile than government-assisted refugees.
More than 25,000 Syrian refugees were admitted to Canada in 2015 and 2016
According to Immigration, Refugees and Citizenship Canada (IRCC), 25,555 Syrian refugees landed in Canada between December 1, 2015, and the end of February 2016. Most were admitted in 2016, and the majority were government assisted.Note
The 2016 Census data are not entirely comparable to the administrative data collected by IRCC. The IRCC data provide the exact date of admission (day, month and year) for immigrants and refugees, while the census only asks about the year of admission.Note In addition, the IRCC data focus on immigrants and refugees at the time of their admission. The census, however, shows how many immigrants and refugees still lived in the country on Census Day.
Contrary to administrative data, Census data can provide information on the socioeconomic characteristics of various population groups (such as knowledge of both official languages, level of education, and the employment rate). Since the census collects information from all Canadians, it is particularly useful for comparing population subgroups.Note
The number of Syrian refugees provided by both sources for the same admission period—January 1, 2015, to May 10, 2016—are shown in Table 1. At first glance, this table shows that the census numbers are lower than those from the administrative records. The absolute difference between the two sources is 4,090 refugees, or 15%. This variance is due to the fact that, among other things, the census primarily focuses on the population living only in private households, which excludes populations living in collective dwellings—where refugees sometimes reside temporarily after their arrival in the country—and individuals who died or left Canada before May 10, 2016.
| Data source | Syrian refugees resettled in Canada | ||||
|---|---|---|---|---|---|
| Year of admission | Government-assisted refugees | Privately sponsored refugees | Blended visa office–referred refugees | Total | |
| number | |||||
| Administrative records (IRCC) | 2015 | 2,790 | 4,815 | 485 | 8,095 |
| 2016 | 12,870 | 6,240 | 1,915 | 21,030 | |
| Total | 15,665 | 11,055 | 2,405 | 29,125 | |
| 2016 Census | 2015 | 2,310 | 4,305 | 565 | 7,180 |
| 2016 | 10,915 | 5,200 | 1,745 | 17,850 | |
| Total | 13,225 | 9,505 | 2,305 | 25,035 | |
| Source: Statistics Canada, Census of Population, 2016; Immigration, Refugees and Citizenship Canada (IRCC), permanent resident files. | |||||
However, the data from the IRCC administrative records and the 2016 Census are fairly consistent with regard to the distribution of Syrian refugees by year of admission and refugee category. As such, 72% of Syrian refugees who were admitted during the period were admitted in 2016 according to the administrative records, compared with 71% according to the census data. The administrative records show that 54% of Syrian refugees were government assisted, which is comparable to the census data (53%).
Syrian refugees are young, and many are part of families consisting of a couple with children
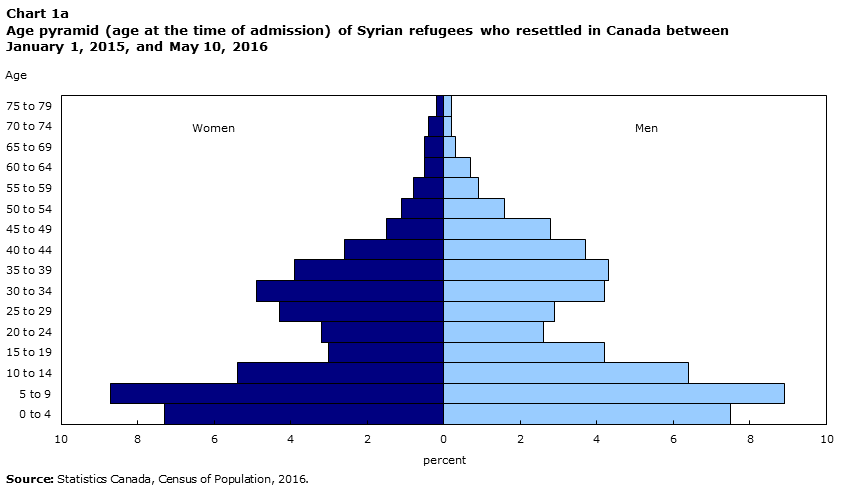
The selection of Syrian refugees abroad was meant to prioritize families and children, which suggests that Syrian refugees are younger than other groups of refugees. One way to examine this issue is to compare the age structure of resettled Syrian refugees, presented in Chart 1a, with that of the resettled refugees from other countries admitted in Canada during the same period, presented in Chart 1b. Both age pyramids are based on the age at admission rather than the age at the time of the census.
Data table for Chart 1A
| Age | Women | Men |
|---|---|---|
| percent | ||
| 0 to 4 | 7.3 | 7.5 |
| 5 to 9 | 8.7 | 8.9 |
| 10 to 14 | 5.4 | 6.4 |
| 15 to 19 | 3.0 | 4.2 |
| 20 to 24 | 3.2 | 2.6 |
| 25 to 29 | 4.3 | 2.9 |
| 30 to 34 | 4.9 | 4.2 |
| 35 to 39 | 3.9 | 4.3 |
| 40 to 44 | 2.6 | 3.7 |
| 45 to 49 | 1.5 | 2.8 |
| 50 to 54 | 1.1 | 1.6 |
| 55 to 59 | 0.8 | 0.9 |
| 60 to 64 | 0.5 | 0.7 |
| 65 to 69 | 0.5 | 0.3 |
| 70 to 74 | 0.4 | 0.2 |
| 75 to 79 | 0.2 | 0.2 |
| Source: Statistics Canada, Census of Population, 2016. | ||

Data table for Chart 1B
| Age | Women | Men |
|---|---|---|
| percent | ||
| 0 to 4 | 4.9 | 6.2 |
| 5 to 9 | 4.2 | 5.4 |
| 10 to 14 | 4.7 | 5.5 |
| 15 to 19 | 5.2 | 6.2 |
| 20 to 24 | 5.7 | 5.1 |
| 25 to 29 | 4.7 | 6.4 |
| 30 to 34 | 3.8 | 4.7 |
| 35 to 39 | 3.4 | 3.8 |
| 40 to 44 | 2.9 | 3.4 |
| 45 to 49 | 2.3 | 2.2 |
| 50 to 54 | 1.6 | 1.3 |
| 55 to 59 | 1.5 | 0.9 |
| 60 to 64 | 0.6 | 0.8 |
| 65 to 69 | 0.5 | 0.7 |
| 70 to 74 | 0.3 | 0.2 |
| 75 to 79 | 0.3 | 0.1 |
| Source: Statistics Canada, Census of Population, 2016. | ||
The age pyramid of Syrian refugees was characterized by a high percentage of children aged 0 to 14 and by a relatively small proportion of people aged 15 to 29. Among refugees from other countries, by contrast, all age groups between the ages of 0 and 29 were relatively similar in size. Over the age of 30, the age distribution of both groups of refugees looked similar, with older age groups having smaller percentages. The concentration of Syrian refugees in younger age groups translated into a lower median age at admission for Syrian refugees (18 years) relative to refugees from other countries (23 years).
Among all refugees who resettled in Canada between January 1, 2015 and May 10, 2016, less than 40% were not of Syrian origin. After Syria, the source country associated with the largest number of refugees was Iraq, with 3,075 refugees. Three other source countries provided at least 1,000 refugees: Afghanistan, Eritrea and the Democratic Republic of the Congo.
Several characteristics of refugees are shown in Table 2 by source country. Syrians, who represented the largest group, stood out by having the highest proportion of refugees admitted in 2016 (71%, compared with an average of 27% for refugees from other countries). The percentage of Syrian refugees who were government assisted (53%) was comparable to the average for refugees from other countries (56%), although the proportion of government-assisted refugees varied considerably across countries (from 15% of refugees from Afghanistan, to 79% of refugees from the Democratic Republic of the Congo).Note
| Source country | Syria | Iraq | Afghanistan | Eritrea | Democratic Republic of the Congo | Other countries | Total, excluding Syria | Total |
|---|---|---|---|---|---|---|---|---|
| number | ||||||||
| Number of refugees | 25,035 | 3,075 | 1,695 | 2,030 | 1,130 | 7,650 | 15,580 | 40,615 |
| age | ||||||||
| Median age | 18 | 26 | 22 | 27 | 21 | 21 | 23 | 21 |
| percent | ||||||||
| Government-assisted refugees | 52.8 | 62.0 | 14.5 | 26.4 | 78.8 | 67.3 | 55.9 | 54.0 |
| Refugees admitted in 2016 | 71.3 | 19.7 | 28.6 | 34.2 | 27.0 | 26.8 | 26.6 | 54.1 |
| Distribution across age groups at the time of admission | ||||||||
| 0 to 14 | 44.2 | 29.3 | 26.0 | 28.1 | 23.9 | 34.6 | 31.0 | 39.1 |
| 15 to 29 | 20.2 | 27.0 | 37.5 | 33.0 | 49.1 | 32.7 | 33.3 | 25.2 |
| 30 to 59 | 32.3 | 36.9 | 31.0 | 38.2 | 23.0 | 30.0 | 32.0 | 32.2 |
| 60 and over | 3.3 | 6.8 | 5.3 | 1.2 | 4.4 | 2.7 | 3.7 | 3.4 |
| Distribution by sex, total population | ||||||||
| Women | 48.6 | 44.9 | 52.2 | 43.2 | 50.9 | 46.8 | 46.9 | 47.9 |
| Men | 51.4 | 55.1 | 48.1 | 56.5 | 48.7 | 53.1 | 53.1 | 52.1 |
| Distribution by sex, population aged 15 to 29 | ||||||||
| Women | 52.2 | 43.0 | 50.4 | 46.3 | 49.5 | 47.4 | 46.9 | 49.6 |
| Men | 47.7 | 57.6 | 49.6 | 53.7 | 51.4 | 52.6 | 53.1 | 50.4 |
| Source: Statistics Canada, Census of Population, 2016. | ||||||||
As mentioned earlier, the Syrian refugee population is young: 44% of its population was under the age of 15 in 2016, more than any other major source country (the average for all refugees from other countries was 31%). However, the percentage of the Syrian population aged 15 to 29 at the time of admission (20%) was below the average for refugees from other countries (33%). Refugees from the Democratic Republic of the Congo had the highest percentage of individuals aged 15 to 29 (49%).
While there were more men (51%) than women in the total Syrian refugee population, women outnumbered men among those aged 15 to 29 (52% versus 48%). By contrast, among refugees from other countries, there were more men than women in this age group (the proportion of men among those aged 15 to 29 varied from 50% among refugees from Afghanistan to 58% among refugees from Iraq).
The demographic characteristics of Syrian refugees are related to their unique family structure (Table 3). The percentage of families consisting of a couple with children among all Syrian families was 85%, which is 20 percentage points more than the average for refugees from other countries (63%). Syrian couples with children had an average of 2.8 children aged 0 to 14, compared with an average of 2.2 children among refugees from other countries. There were also significant variations between source countries in this regard. More than 70% of refugees from Iraq and Afghanistan were couples with children, and Congolese couples with children had an average of 3.0 children, a number even higher than the Syrian average. Syrian refugees, however, had both a large proportion of couples with children, and a relatively high number of children in these families.
| Source country | Household | Census family | |||
|---|---|---|---|---|---|
| Average number of people per household | Proportion of households with only one person | Average number of children aged 0 to 14 among couples with children | Proportion of couples with children in the family | Proportion of persons living outside a census family | |
| number | percent | number | percent | ||
| Syria | 4.8 | 3.6 | 2.8 | 85.4 | 4.2 |
| Iraq | 4.0 | 13.4 | 2.0 | 74.1 | 9.6 |
| Afghanistan | 5.4 | 3.0 | 2.4 | 71.8 | 3.5 |
| Eritrea | 3.5 | 9.8 | 2.2 | 62.0 | 25.3 |
| Democratic Republic of the Congo | 4.4 | 14.3 | 3.0 | 46.5 | 25.7 |
| Other countries | 3.7 | 13.4 | 2.2 | 58.4 | 21.6 |
| Total, excluding Syria | 4.0 | 12.0 | 2.2 | 63.2 | 18.0 |
| Total | 4.4 | 7.1 | 2.6 | 77.2 | 9.5 |
| Source: Statistics Canada, Census of Population, 2016. | |||||
As the Syrian refugee population consisted primarily of couples with children, relatively few of them were living outside a census family (4%). The proportion of households consisting of one individual was also relatively low (4%), at least relative to the average for refugees from other countries (12%).
Such demographic and family indicators reflect the selection process of Syrian refugees. Families with children were prioritized, at the expense of young adults who were less likely, given their age, to be in a couple or to have children.
The majority of Syrian refugees did not know English or French at the time of the 2016 Census
In addition to demographic and family criteria, Syrian refugee selection prioritized the most vulnerable refugees. These refugees often had lower levels of educational attainment and were less likely to speak at least one official language. These two human capital characteristics are associated with immigrants’ economic well-being and can thus serve as indicators of socioeconomic vulnerability. Knowledge of official languages is an asset for entering the labour force upon landing, while level of education becomes an asset only after having lived in the country for a few years.Note Even though most newcomers’ credentials are not immediately transferable to the labour market because of the time needed to obtain recognition of foreign academic credentials and work experience,Note they remain a key element for entering the labour force and are strongly associated with income in the long run.
Chart 2 compares the level of education of Syrian refugees aged 20 to 59 with that of refugees from other countries.Note In general, the educational profile of Syrian refugees was similar to that of refugees from other countries; in both cases, approximately one-half did not have a certificate, diploma or degree. Slightly more Syrian women (15%) than women from other countries (9%) had a university degree. One-half of the women from other countries did not have a certificate, diploma or degree, compared with 47% of Syrian women. In contrast, a greater proportion of Syrian men (52%) did not have a certificate, diploma or degree compared to men from other countries (40%).

Data table for Chart 2
| Sex | Source country | No certificate, diploma or degree | High school education, apprenticeship or trades certificate | College education | University education |
|---|---|---|---|---|---|
| percent | |||||
| Women | Syria | 46.9 | 27.6 | 10.4 | 15.1 |
| Other countries | 50.7 | 30.5 | 9.4 | 9.2 | |
| Men | Syria | 51.6 | 26.0 | 8.4 | 14.1 |
| Other countries | 39.8 | 37.5 | 10.6 | 12.1 | |
| Total | Syria | 49.3 | 26.8 | 9.4 | 14.6 |
| Other countries | 45.1 | 34.1 | 10.0 | 10.7 | |
| Source: Statistics Canada, Census of Population, 2016. | |||||
There were more differences between the two groups of refugees in their knowledge of official languages: the majority of Syrians (55%) did not know English or French, compared with 28% of refugees from other countries (Chart 3). To a certain extent, such differences were expected. Many refugees from other countries landed in Canada before Syrian refugees, which means that they had more time to learn English or French. In addition, unlike Syrian refugees, many refugees from other countries had English or French as a mother tongue or were from countries where one of these languages is the official or national language. This was the case for those from the Democratic Republic of the Congo (French) and Eritrea (English).

Data table for Chart 3
| Sex | Source country | English only | French only | English and French | Neither English nor French |
|---|---|---|---|---|---|
| percent | |||||
| Women | Syria | 34.9 | 3.5 | 5.8 | 55.9 |
| Other countries | 50.7 | 10.6 | 6.5 | 32.4 | |
| Men | Syria | 39.8 | 1.6 | 5.3 | 53.3 |
| Other countries | 60.4 | 8.5 | 6.9 | 24.1 | |
| Total | Syria | 37.4 | 2.5 | 5.5 | 54.6 |
| Other countries | 55.7 | 9.5 | 6.7 | 28.1 | |
| Source: Statistics Canada, Census of Population, 2016. | |||||
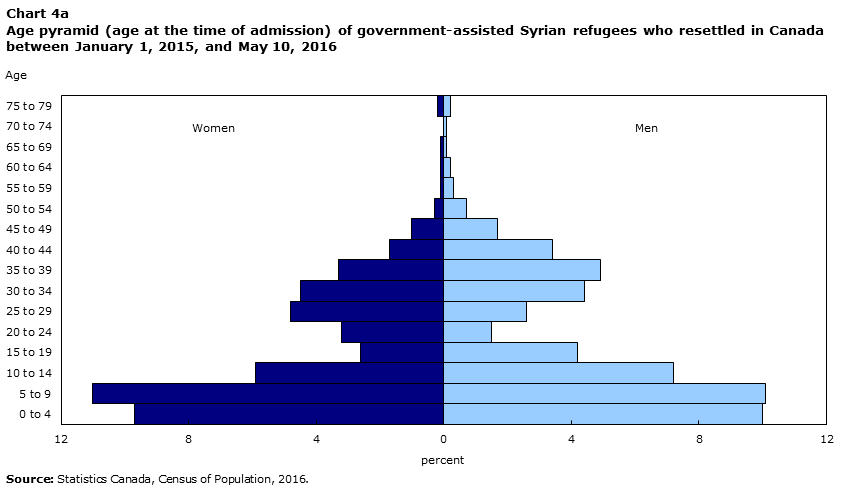
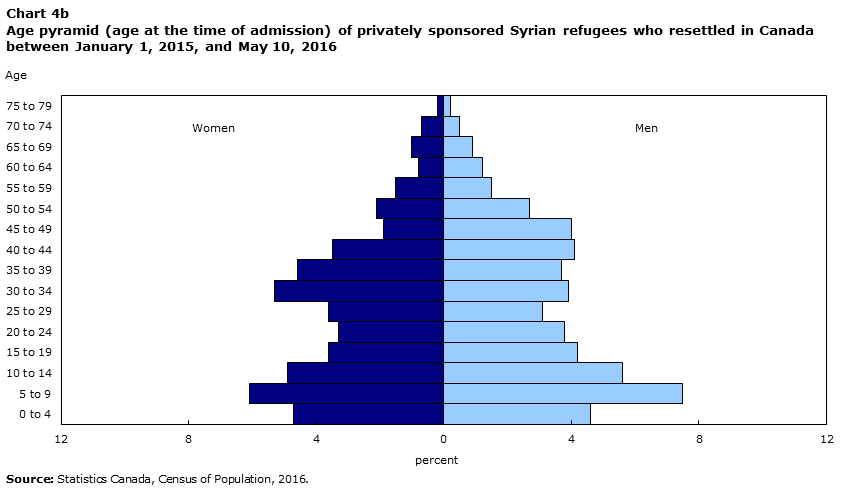
Government-assisted refugees do not have the same profile as privately sponsored refugees
Within the Syrian refugee population, there were significant differences between the characteristics of government-assisted refugees and those who were privately sponsored. On average, government-assisted refugees were younger than those who were sponsored privately, with a median age of 13 for the former and 26 for the latter (Table 4). This is due to the fact that the government-assisted refugee population consisted mainly of couples with children (94%); these couples had, on average, 3.2 children aged 0 to 14, compared with 2.2 children among privately sponsored families.
| Syria | Other countries | |||||
|---|---|---|---|---|---|---|
| Government-assisted refugees | Privately sponsored refugees | All refugees | Government-assisted refugees | Privately sponsored refugees | All refugees | |
| age | ||||||
| Age and family characteristics | ||||||
| Median age at the time of admission | 13 | 26 | 18 | 21 | 25 | 23 |
| percent | ||||||
| Admitted between the ages of 0 and 14 | 53.8 | 33.4 | 44.2 | 33.3 | 28.2 | 31.0 |
| Women among those aged 15 to 29 | 56.0 | 48.5 | 52.2 | 45.9 | 48.4 | 46.9 |
| Couples with children | 94.0 | 77.8 | 85.4 | 59.0 | 69.0 | 63.2 |
| Persons not living in a family | 0.9 | 7.8 | 4.2 | 15.9 | 20.8 | 18.0 |
| average number | ||||||
| Average number of children aged 0 to 14 per family with children | 3.2 | 2.2 | 2.8 | 2.3 | 2.1 | 2.2 |
| percent | ||||||
| Education and knowledge of official languages, womenTable 4 Note 1 | ||||||
| Does not have a high school diploma | 71.5 | 26.7 | 47.0 | 56.1 | 44.4 | 50.8 |
| Has a university degree | 2.2 | 25.6 | 15.0 | 7.5 | 11.3 | 9.2 |
| Knows at least one official language | 16.7 | 66.5 | 44.0 | 67.1 | 68.2 | 67.6 |
| Education and knowledge of official languages, menTable 4 Note 1 | ||||||
| Does not have a high school diploma | 70.6 | 36.2 | 51.6 | 47.9 | 31.5 | 39.8 |
| Has a university degree | 2.3 | 23.5 | 14.0 | 10.8 | 13.2 | 11.9 |
| Knows at least one official language | 21.2 | 67.2 | 46.6 | 69.1 | 83.2 | 76.0 |
|
||||||
Government-assisted Syrian refugees aged 15 to 29 were characterized by a larger female population (56% women), while the privately sponsored refugee population was more evenly distributed between men (51%) and women (49%).
Both populations also differed in terms of socioeconomic characteristics. Government-assisted refugees had a lower level of education (i.e., a lower proportion with a university degree and a higher proportion of individuals without a high school diploma) than privately sponsored refugees. Less than 3% of government-assisted Syrian refugees held a university degree, compared with approximately 25% of those who were privately sponsored. In addition, about 20% of government-assisted Syrian refugees knew English or French, compared with 67% of privately sponsored refugees.
Several aspects of the privately sponsored Syrian refugees’ profile—such as age and sex composition, the percentage of women in the 15 to 29 cohort, and the number of children per couple with children—more closely resembled those of refugees from other countries. On other aspects (such as education), privately sponsored Syrian refugees differed not only from government-assisted Syrian refugees, but also from other refugees. Privately sponsored Syrian refugees, in particular, were more likely to have a university degree than refugees from other countries, even those who were privately sponsored.
By contrast, the profile of government-assisted Syrian refugees (larger families, lower levels of education and lower levels of proficiency in English or French) differed considerably from that of privately sponsored Syrian refugees and refugees from other countries, including those who were government assisted. These results are consistent with the fact that government-assisted refugees were admitted based on pre-established vulnerability selection criteria, as mentioned earlier.
Charts 4a and 4b, which show the age structure for the government-assisted and privately sponsored Syrian refugees, illustrate the differences between both populations. It also shows that the distinct dual pyramid shape of charts 1a and 1b was largely driven by the particular age profile of the government-assisted Syrian refugee population.
Data table for Chart 4A
| Age | Women | Men |
|---|---|---|
| percent | ||
| 0 to 4 | 9.7 | 10.0 |
| 5 to 9 | 11.0 | 10.1 |
| 10 to 14 | 5.9 | 7.2 |
| 15 to 19 | 2.6 | 4.2 |
| 20 to 24 | 3.2 | 1.5 |
| 25 to 29 | 4.8 | 2.6 |
| 30 to 34 | 4.5 | 4.4 |
| 35 to 39 | 3.3 | 4.9 |
| 40 to 44 | 1.7 | 3.4 |
| 45 to 49 | 1.0 | 1.7 |
| 50 to 54 | 0.3 | 0.7 |
| 55 to 59 | 0.1 | 0.3 |
| 60 to 64 | 0.1 | 0.2 |
| 65 to 69 | 0.1 | 0.1 |
| 70 to 74 | 0.0 | 0.1 |
| 75 to 79 | 0.2 | 0.2 |
| Source: Statistics Canada, Census of Population, 2016. | ||
Data table for Chart 4B
| Age | Women | Men |
|---|---|---|
| percent | ||
| 0 to 4 | 4.7 | 4.6 |
| 5 to 9 | 6.1 | 7.5 |
| 10 to 14 | 4.9 | 5.6 |
| 15 to 19 | 3.6 | 4.2 |
| 20 to 24 | 3.3 | 3.8 |
| 25 to 29 | 3.6 | 3.1 |
| 30 to 34 | 5.3 | 3.9 |
| 35 to 39 | 4.6 | 3.7 |
| 40 to 44 | 3.5 | 4.1 |
| 45 to 49 | 1.9 | 4.0 |
| 50 to 54 | 2.1 | 2.7 |
| 55 to 59 | 1.5 | 1.5 |
| 60 to 64 | 0.8 | 1.2 |
| 65 to 69 | 1.0 | 0.9 |
| 70 to 74 | 0.7 | 0.5 |
| 75 to 79 | 0.2 | 0.2 |
| Source: Statistics Canada, Census of Population, 2016. | ||
Syrian refugees are distributed across Canada
At the time of the 2016 Census, one-third of Syrian refugees (8,300) were living in the Montréal and Toronto CMAs (Table 5), compared with 29% of refugees from other countries. At the provincial level, Ontario had the largest number of Syrian refugees (10,210), followed by Quebec (5,295). In some regions, Syrian refugees represented a larger share of the refugee population. For example, 78% of refugees who landed during the period and were living in the Atlantic provinces at the time of the census were of Syrian origin, a proportion almost identical to the Syrian refugee population in the Montréal CMA. In the rest of Quebec, Syrians represented 34% of refugees admitted between January 1, 2015, and May 10, 2016. Elsewhere, the percentage of Syrian refugees ranged from 54% to 68%.
| Region of residence | Number of Syrian refugees | Number of refugees from other countries | Distribution of Syrian refugees | Distribution of refugees from other countries | Proportion of Syrian refugees in the total refugee population | Proportion of Syrian refugees who were government-assisted refugees | Proportion of Syrian refugees admitted in 2015 |
|---|---|---|---|---|---|---|---|
| number | percent | ||||||
| Atlantic provinces | 2,670 | 765 | 10.7 | 4.9 | 77.7 | 85.8 | 6.6 |
| Montréal census metropolitan area | 4,265 | 1,195 | 17.0 | 7.7 | 78.1 | 5.4 | 46.5 |
| Rest of Quebec | 1,030 | 1,970 | 4.1 | 12.6 | 34.3 | 76.7 | 5.3 |
| Toronto census metropolitan area | 4,035 | 3,285 | 16.1 | 21.1 | 55.1 | 30.9 | 37.4 |
| Rest of Ontario | 6,175 | 2,910 | 24.6 | 18.7 | 68.0 | 65.3 | 27.5 |
| Prairies | 4,735 | 4,055 | 18.9 | 26.0 | 53.9 | 64.8 | 24.0 |
| British Columbia | 2,125 | 1,410 | 8.5 | 9.1 | 60.1 | 73.6 | 29.4 |
| Canada | 25,035 | 15,580 | 100.0 | 100.0 | 61.6 | 52.8 | 28.7 |
| Source: Statistics Canada, Census of Population, 2016. | |||||||
The year of admission and admission category of Syrian refugees also varied greatly from one region to another. In the Atlantic provinces, the majority of Syrian refugees were government assisted (86%) and were admitted in 2016 (93%). By contrast, in the CMA of Montréal, just over 5% of Syrian refugees were government assisted and nearly one-half (47%) were admitted in 2015. In the rest of Quebec, the profile was similar to the Atlantic provinces: 77% of Syrian refugees were assisted by the government and close to 95% were admitted in 2016. In other regions, the results by year of arrival were closer to the Canadian average.
CMAs other than Montréal and Toronto also received Syrian refugeesNote . The five main CMAs after Montréal and Toronto were Ottawa–Gatineau (1,705 Syrian refugees), Vancouver (1,680), Calgary (1,220), Edmonton (1,200) and Hamilton (1,150). In most CMAs, except Montréal, Toronto and Calgary, most refugees were government assisted. All Syrian refugees in Fredericton and Moncton were government assisted, as were more than 90% of those in Regina, Saint John and Québec.
Syrian refugees had a lower employment rate than refugees from other countries admitted during the same period
Entering the labour forceNote is an important step for recent immigrants in general, and for refugees in particular, because they face significant challenges due to their specific socioeconomic characteristicsNote and often tragic events that led them to leave their country.Note
In 2016, Syrian refugees were less likely to be employed than refugees from other countries. In particular, 24% of Syrian men were employed at the time of the census, compared with 39% of refugees from other countries. This trend is also observed among women, with 8% of female Syrian refugees reporting being employed in 2016, compared with 17% of female refugees from other countries.
Employment rates varied considerably by year of admission. Among government-assisted Syrian refugees aged 20 to 59 who were admitted in 2016, the employment rateNote was 0.7% for women and 1.9% for men. These employment rates were lower than those of government-assisted refugees from other countries who were admitted in the same year. Among privately sponsored refugees admitted the same year, the employment rate gap between Syrian refugees and refugees from other countries was smaller (charts 5a and 5b).
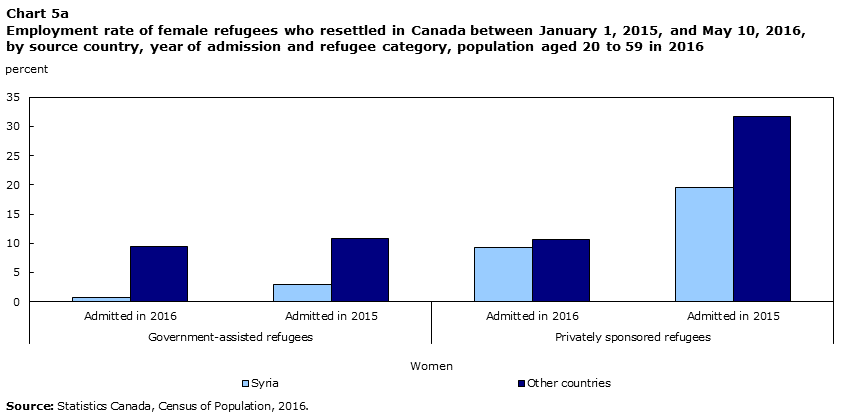
Data table for Chart 5A
| Source country | Government-assisted refugees | Privately sponsored refugees | ||
|---|---|---|---|---|
| Admitted in 2016 | Admitted in 2015 | Admitted in 2016 | Admitted in 2015 | |
| percent | ||||
| Syria | 0.7 | 3.0 | 9.3 | 19.5 |
| Other countries | 9.5 | 10.8 | 10.6 | 31.7 |
| Source: Census of Population, 2016. | ||||
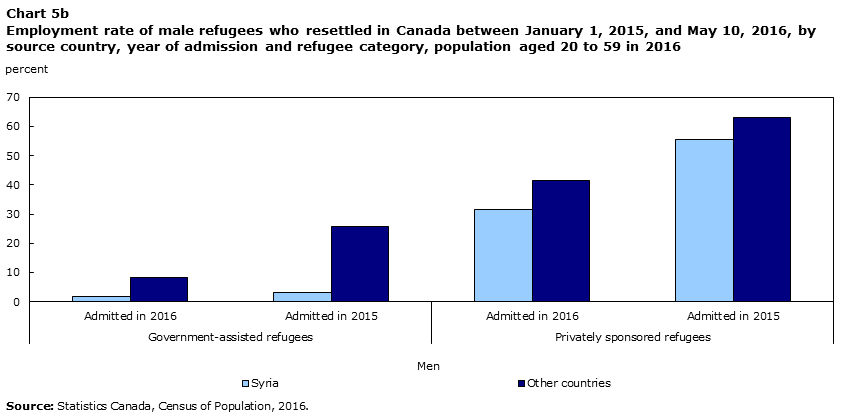
Data table for Chart 5B
| Source country | Government-assisted refugees | Privately sponsored refugees | ||
|---|---|---|---|---|
| Admitted in 2016 | Admitted in 2015 | Admitted in 2016 | Admitted in 2015 | |
| percent | ||||
| Syria | 1.9 | 3.3 | 31.7 | 55.4 |
| Other countries | 8.3 | 25.9 | 41.3 | 63.0 |
| Source: Census of Population, 2016. | ||||
The employment rate was higher for refugees admitted in 2015, which shows that the duration of residence has an impact on the labour force participation rate. This varied, however, depending on the refugee category. Among government-assisted Syrian refugees, employment rates were slightly higher for those admitted in 2015 than those admitted in 2016. In contrast, among privately sponsored refugees, those admitted in 2015 had significantly higher employment rates than those admitted in 2016.
As mentioned previously, Syrian refugees and refugees from other countries had different socioeconomic characteristics, particularly their duration of residence in CanadaNote , which may explain the differences in employment rates between them. To what extent can these differences explain the employment rate differences between the two populations?
In order to answer this question, a logistic regression model with employment as the dependent variable was estimated. Independent variables included the source country and other variables that can have an impact on employment, like the admission period,Note the refugee category, knowledge of official languages, and sociodemographic characteristics such as level of education, age, marital status and region of residence.
Several versions of the model were estimated. The first model (the reference model) includes only the source country as independent variable, in two categories: Syrian and other countries. The remaining models include other independent variables that can also affect the employment rate.Note Results for all models are presented in Table 6 and are expressed as predicted probabilities.
| Variables used in the model | Women | Men | ||
|---|---|---|---|---|
| Other countries | Syria | Other countries | Syria | |
| predicted probabilities | ||||
| (1) Country of origin | 16.9 | 8.0Note * | 39.0 | 24.2Note * |
| (2) Country of origin and admission period | 13.2 | 10.4 | 32.9 | 28.4Note * |
| (3) Country of origin and refugee category | 18.0 | 7.8Note * | 40.1 | 23.2Note * |
| (4) Country of origin and knowledge of official languages | 14.9 | 9.6 | 33.9 | 26.5Note * |
| (5) Country of origin, admission period, refugee category and knowledge of official languages | 14.7 | 10.1Note * | 33.7 | 26.4Note * |
| (6) Country of origin, age, marital status, education and region of residence | 16.1 | 10.1Note * | 35.4 | 25.5Note * |
| (7) Full model | 14.1 | 12.5 | 32.2 | 27.4Note * |
| (8) Full model without admission period | 16.0 | 10.6 | 35.9 | 24.8Note * |
|
||||
Adding variables to the model reduced the gap between the employment rate of Syrian refugees and refugees from other countries, particularly for women. The inclusion of the admission period had the most effect on the employment rate (Model 2), as it reduced the employment rate difference from 9 to 3 percentage points for women, and from 15 to 5 percentage points for men. The predicted employment rate of Syrian women was not statistically different than that of refugees from other countries, which suggests that there is no difference in predicted employment rates when the admission period is taken into account. For men, the gap was smaller, but remained significant. These results reflect the fact that the Syrian refugees were admitted to Canada more recently than the refugees from other countries. At the time of the 2016 Census, Syrian refugees had been in the country for an average of four months, while refugees from other countries had been here for an average of eight months.
Controlling for knowledge of official languages also narrowed the employment rate gap between Syrian refugees and refugees from other countries, but to a lesser extent (Model 4). Controlling for the refugee category, however, widened this gap. This result is explained by the fact that there was a higher percentage of privately sponsored refugees aged 20 to 59 from Syria than from other countries (55% versus 47%).
The other models show the results with additional explanatory variables. In each case, the employment rate gap was smaller than in the reference model. In the full model for women (Model 7), the employment gap was not statistically significant; predicted probabilities were 13% for Syrian refugees and 14% for refugees from other countries. This result means that, for women, the employment rate gap between Syrian refugees and refugees from other countries is attributable to differences in their characteristics. For men, however, the gap persisted even after controlling for all factors, with the predicted employment rate of Syrian refugees (27%) remaining lower than the rate of refugees from other countries (32%).
Conclusion
In 2015, the Canadian government announced a plan to resettle 25,000 Syrian refugees in Canada. The goal of this paper was to provide a profile of the Syrian refugees who resettled in Canada in 2015 and the first few months of 2016.
In Canada, more than one-half of Syrian refugees were government assisted, while the others were privately sponsored. The government-assisted Syrian refugees were characterized by lower levels of education and knowledge of official languages than the privately sponsored refugees and also government-assisted refugees from other countries, which can be explained by the fact that the government selection criteria prioritized families with children and more vulnerable refugees.
Government-assisted Syrian refugees had a relatively low employment rate compared with privately sponsored refugees and refugees from other countries, regardless of whether they were government assisted or privately sponsored.
However, the gap between the employment rate of Syrian refugees and refugees from other countries is due in great part to the admission period, for both women and men. Unlike refugees from other countries, most Syrian refugees were admitted in early 2016, meaning that many of them had been in the country for only a few weeks at the time of the census. Lower levels of education and knowledge of official languages are also significant underlying factors.
That said, there is still a gap between the male Syrian refugees’ employment rate and that of male refugees from other countries. Consequently, other characteristics that were not part of the census may also be explanatory factors. It is possible, for example, that the Syrian refugees suffered severe trauma during the war, which could have hindered their initial entry into the Canadian labour force.
Over time, the differences between the Syrian refugees and the refugees from other countries could disappear, but the government-assisted Syrian refugees’ specific conditions could continue to hinder their future economic integration. Follow-up work with this population is recommended, and will be possible over the next few years using the Canadian Longitudinal Immigration Database and the next census in Canada, in 2021.
René Houle is a Senior Research Analyst at Statistics Canada, Social and Aboriginal Statistics Division.
Start of text box
Data sources, methods and definitions
Data sources
Data from the 2016 Census of Population were used in this analysis. For additional information about the census, immigrant admission categories and refugee categories, see the Guide to the Census of Population, 2016 (Statistics Canada Catalogue no. 98-304-X) and the Dictionary, Census of Population, 2016 (Statistics Canada Catalogue no. 98-301-X).The refugee category definitions used in this study can be found in the Definitions section below. For specific information about the quality and comparability of census data on employment, see the Labour Reference Guide, Census of Population, 2016 (Statistics Canada catalogue no. 98-500-X). Data from the 2016 Longitudinal Immigration Database (IMDB) are also used to examine the income situation in 2016 of refugees who were admitted to Canada in November and December 2015.
Definitions
Resettled refugee: This category includes immigrants who were selected abroad while outside their home country or country where they normally lived and who were granted permanent resident status on the basis of a well-founded fear of returning to that country. The United Nations Refugee Agency, another designated referral organization or a private sponsor referred them for resettlement in Canada. This category includes persons who had a well-founded fear of persecution for reasons of race, religion, nationality, membership in particular social group or political opinion (Geneva Convention refugees), as well as persons who have been seriously and personally affected by civil war or armed conflict, or have suffered a massive violation of human rights.
Government-assisted refugee: This category includes immigrants who were selected abroad while outside their home country or country where they normally lived, who were granted permanent resident status on the basis of a well-founded fear of returning to that country and who received resettlement assistance from the federal government.
Privately sponsored refugee: This category includes immigrants who were selected abroad while outside their home country or country where they normally lived, who were granted permanent resident status on the basis of a well-founded fear of returning to that country and who were privately sponsored by organizations, groups of Canadian citizens and/or permanent residents, or who had the funds to support themselves and any dependants after they arrived in Canada. Private sponsors in Canada referred them for resettlement in Canada.
Blended visa office-referred refugee: This category includes immigrants who were selected abroad while outside their home country or country where they normally lived, who were granted permanent resident status on the basis of a well-founded fear of returning to that country and who received resettlement assistance from both the federal government and private sponsors.
End of text box
Start of text box
Factors associated with employment among refugees
This section presents the results of logistic regressions for four refugee groups: female Syrian refugees; female refugees from other countries; male Syrian refugees; and male refugees from other countries. The goal is to identify the characteristics most closely associated with the employment rate of Syrian refugees, and to see if these characteristics are similar to factors affecting the employment rate of other refugees.
The models include seven independent variables: admission period (three categories); refugee category, which specifies whether the refugee was government assisted or privately sponsored; age group at the time of the census (three categories); marital status (three categories); level of education (three categories); knowledge of official languages (yes or no); and area of residence (five categories). The results are presented in Table 7 and are expressed as predicted probabilities.
Three variables were strongly associated with the employment rate: the admission period, refugee category and knowledge of official languages. The results associated with the admission period were similar for all four refugee groups. At the time of the 2016 Census, the predicted employment rate of refugees who were admitted during the first four months of 2015 was two to three times that of refugees who were admitted during the same period in 2016, even after controlling for other factors. In all four models, the employment rate increases as the amount of time spent in the country increases.
Government-assisted refugees had a lower predicted employment rate than those who were privately sponsored. For Syrian men, the gap between the two refugee categories was particularly pronounced (37% for privately sponsored refugees versus 3% for government-assisted refugees).
| Women | Men | |||
|---|---|---|---|---|
| Syria | Other countries | Syria | Other countries | |
| predicted probabilities | ||||
| Admission period | ||||
| January 1 to May 10, 2016 (ref.) | 6.1 | 10.9 | 18.4 | 23.7 |
| May 11 to December 31, 2015 | 11.3Note * | 16.3 | 28.3Note * | 39.9Note * |
| January 1 to May 10, 2015 | 16.5Note * | 30.3Note * | 36.9Note * | 46.0Note * |
| Refugee category | ||||
| Privately sponsored (ref.) | 11.1Note * | 28.7Note * | 36.7Note * | 53.0Note * |
| Government-assisted | 2.5 | 11.4 | 2.7 | 23.6 |
| Age at time of census | ||||
| 20 to 34 (ref.) | 10.3 | 20.3 | 25.7 | 39.9 |
| 35 to 44 | 4.9Note * | 17.8 | 20.3 | 38.6 |
| 45 to 59 | 10.2 | 18.5 | 22.5 | 28.3Note * |
| Marital status | ||||
| Never married (ref.) | 14.0 | 26.6 | 25.6 | 34.0 |
| Married or in a relationship | 6.7Note * | 13.2Note * | 23.1 | 40.0 |
| Separated, divorced, widowed | 5.6Note * | 18.9 | 8.5 | 38.8 |
| Education | ||||
| No diploma (ref.) | 7.5 | 17.3 | 26.7 | 37.4 |
| High school, apprenticeship | 8.6 | 20.7 | 22.9 | 36.7 |
| College or university | 9.9 | 20.9 | 20.4Note * | 38.8 |
| Official languages | ||||
| No (ref.) | 3.9 | 10.6 | 18.9 | 27.3 |
| Yes | 11.2Note * | 21.8Note * | 25.7Note * | 41.3Note * |
| Region of residence | ||||
| Ontario (ref.) | 12.4 | 18.0 | 27.2 | 36.7 |
| Atlantic | 11.9 | 18.0 | 7.2Note * | 30.9 |
| Quebec | 5.3Note * | 12.3 | 21.3Note * | 19.9Note * |
| Prairies | 9.0 | 23.8 | 19.6Note * | 48.8Note * |
| British Columbia | 9.5 | 26.0 | 26.1 | 42.9 |
|
||||
While knowing an official language was associated with a higher employment rate for all four groups, there is little association between education and employment. Both of these results are consistent with the fact that knowing an official language is an asset for entering the labour force upon landing, while level of education becomes an asset only after having lived in the country for a few years.
The impact of some variables was different for men and women. Married women, in particular, were at least two times more likely to be employed than women who had never married, a result that held for both for Syrian women and those from other countries. Also, geographical differences seemed to have more of an effect on the employment rate of male refugees. Among Syrian men, for example, those living in Quebec or the Atlantic provinces had lower predicted employment rates than those living in Ontario.
End of text box
Start of text box
2016 income of refugees admitted in November and December 2015
In an effort to provide additional information on the financial situation of the Syrian refugees who resettled in Canada, this study presents statistics on their total income using the Longitudinal Immigration Database (IMDB). The analysis focuses on refugees aged 20 to 59 who were admitted in November and December 2015 and had been living in Canada for 12 to 14 months as of December 31, 2016. For comparison purposes, the results are presented for both Syrian refugees and refugees from other countries who were admitted during the same period. Total income consists of earnings (wages and self-employment income), government transfers, and other sources (such as investment income).
Among government-assisted refugees, the average total income of Syrian refugees was slightly higher than that of refugees from other countries. In 2016, Syrian refugees reported an average total income of $20,000, compared with $17,700 for refugees from other countries (Table 8). The opposite was observed among privately sponsored refugees: those from other countries reported a slightly higher average total income ($18,200) than Syrian refugees ($15,600).
| Syria | Other countries | |||
|---|---|---|---|---|
| Government-assisted refugees | Privately sponsored refugees | Government-assisted refugees | Privately sponsored refugees | |
| dollars | ||||
| All | 20,000 | 15,600 | 17,700 | 18,200 |
| Men | 20,400 | 17,700 | 16,400 | 21,000 |
| Women | 19,500 | 13,200 | 19,100 | 14,600 |
| Source: Statistics Canada, Immigration Longitudinal Database, 2016. | ||||
Among men, the differences in income between Syrian refugees and refugees from other countries were more pronounced. Government-assisted Syrian men reported an average total income of $20,400, compared with $16,400 for their counterparts from other countries. Privately sponsored Syrian men reported an average income of $17,000, compared with $21,000 for their counterparts from other countries. Among women, however, the differences in income reported by refugees from Syria and those from other countries were less pronounced.
Government transfers represented the largest source of income of government-assisted refugees from both Syria and other countries. For example, 96% of the total income of government-assisted Syrian refugees came from government transfers, compared with 83% for government-assisted refugees from other countries. Reflecting their higher degree of labour market participation, the income of privately sponsored refugees primarily came from earnings—but a significant proportion of their income also came from government transfers (30% for Syrian refugees and 28% for refugees from other countries).
Over time, the employment and income situation of refugees could change rapidly as they will gradually improve their language proficiency and skills. The next releases of the IMDB will provide more insights into the situation of Syrian refugees.
End of text box
- Date modified: