Insights on Canadian Society
Association between the frequency of cannabis use and selected social indicators
Archived Content
Information identified as archived is provided for reference, research or recordkeeping purposes. It is not subject to the Government of Canada Web Standards and has not been altered or updated since it was archived. Please "contact us" to request a format other than those available.
Skip to text
Text begins
Based on data from the 2015 Canadian Tobacco, Alcohol and Drugs Survey and the 2014 General Social Survey on Victimization, this article examines recent cannabis use in Canada, with a focus on the characteristics of people who use cannabis. It also discusses the harmful effects from cannabis consumption reported by those who use cannabis, as well as the association between frequency of cannabis use and selected social indicators such as self-reported health, confidence in police and the justice system, and victimization.
- At the time of survey collection, about 45% of people aged 15 and over reported that they had ever tried or used cannabis in their lifetime. About 7% said that they had used it in the past month, and 1.5% reported that they had used cannabis daily in the past month.
- In 2015, more than 13% of young adults between the ages of 20 and 29 used cannabis weekly or daily, compared with 2% for those aged 55 and over. Meanwhile, 8% of men and 3% of women aged 15 and over used cannabis weekly or daily.
- One‑quarter of adults in Canada had tried or used cannabis by the time they were 18. Of those who said that they first tried cannabis when they were 14 or under, 31% said that they currently used it at least on a weekly basis.
- There is a link between the presence of a physical or mental health disability and frequent cannabis use. In addition, people who used cannabis more frequently had lower levels of confidence in the police and the justice system and were more likely to report that they had been victim of a violent crime in the past year.
- About 17% of past-year users of cannabis said they also used other illicit drugs. Among them, 21% reported that they had suffered a harm to their physical health due to drug use compared with 5% for those who used cannabis only.
Introduction
Changes to legislation legalizing non-medical cannabis use—legislation that will likely have important societal effects—will take effect in Canada within the coming year. Recent evidenceNote suggests that cannabis consumption has gone through various up-and-down periods between 1960 and 2015 among the various age groups. In the late 1960s and early 1970s, for example, there was a rapid increase in the consumption of cannabis among youth (aged 15 to 24)—a rate that then levelled off before declining in the early 1990s. The cannabis consumption rate of youth increased again until the early 2000s before starting to slowly decline until 2015. Among adults aged 25 to 44, while cannabis consumption is always lower than for the population aged 15 to 24, it does show a slow linear increase over time from the 1970s to 2015. While the population aged 45 to 64 has the lowest consumption rates, theirs also began to climb starting in the early 2000s. Moreover, as another recent study found, cannabis use among youth aged less than 25 has declined or been more or less stable since 2004, while for adults over age 25 it has risen during this same period.Note
The aforementioned pattern notwithstanding, the fact remains that legalizing cannabis could have an effect on consumption patterns and influence the health, life, and well-being of the population. While the literature on the effects of the legalization of cannabis is in its infancy, the most relevant findings from a Canadian perspective come from American states that have already undergone legalization. Those studies, which used data pre- and post-legislation, found that the frequency of cannabis use was not affected by the introduction of legislation to make it legal.Note Evidence on cannabis decriminalization from Australia and the United Kingdom yielded similar results.Note
While we do not yet know the impact of legalizing non-medical cannabis use in Canada, a recent report on drug use among high school students in Ontario found that cannabis is the illicit drug most used by high school students—yearly use rates increase from grade 9 to grade 12. Yet when asked attitudinal questions about their views on cannabis legislation, one-third of students were in favour of legalization, one-third were opposed and one-third were unsure.Note One of the report’s findings was that the majority (close to two-thirds) of Ontario students of high school age said that they did not intend to use cannabis when it becomes legal, while a small proportion (less than 5%) of current users said that they would increase their use of cannabis following legalization.Note These findings are important in view of the fact that the impending legislation will not permit the sale of cannabis for non-medical purposes to people under age 18 or 19 depending on jurisdiction.
The current literature on the impact of cannabis use on its users is mixed: the effects are varied and can be negative, positive, or null.Note For instance, some of the recent research has found that regular use of cannabis during adolescence and into adulthood can negatively impact users’ dependence on the drug, as well as worsen physical health, psychosocial development and mental health.Note Other studies have shown that the onset of cannabis use during adolescence is associated with poor educational outcomes, lower income, greater welfare dependence and generally lower life satisfaction.Note There is also the suggestion that using less harmful drugs like cannabis could lead to using drugs like cocaine or heroin. For that reason, drugs like cannabis are sometimes referred to as gateway drugs.Note Certain studies nonetheless urge a cautious approach to making causal claims linking cannabis use with other illicit drugs.Note
This study uses the 2015 Canadian Tobacco, Alcohol and Drugs Survey (CTADS) and the 2014 General Social Survey (GSS) on Victimization to examine recent cannabis use in Canada (see the Data sources, methods and definitions section for details). Three main issues are examined: (1) the characteristics of people who use cannabis (those who report use for medical and non-medical purposes) Note , including age of first cannabis use; (2) self-reported harms related to cannabis consumption; and (3) the association between frequency of cannabis use and social indicators such as self-reported health, confidence in police and the justice system, and victimization.
There are two main limitations with the CTADS and GSS data: (1) Given the cross-sectional nature of the data, temporal order cannot be established—the results therefore focus on strength of associations, and should not be interpreted as causal;Note and (2) Related to the first limitation, in addition, it is impossible to determine with certainty the impact that other factors related to risky behaviours may have on the relationship between cannabis and the social indicators examined in this paper. For instance, heavy cannabis use may co-vary with other risk behaviours such as heavier consumption of alcohol, and this combined influence may have an impact on the results observed in this paper.
Prevalence of cannabis use varies across personal characteristics
The method used for measuring the prevalence of cannabis use in Canada differs depending on the data source. For example, varying types of questions along with the timeframe respondents are asked about their level of cannabis use will affect estimates. Two common data sources that measure the prevalence of drug use in Canada are the Canadian Community Health Survey (CCHS)Note and the Canadian Tobacco, Alcohol and Drugs Survey (CTADS). Both ask questions on lifetime cannabis use, the number of times it has been used, and use in the past year, and both produce similar estimates on lifetime use and use in the past 12 months.
These surveys differ in that the CCHS asks about frequency of use in the past 12 months, while the CTADS asks about frequency of use in the past 3 months.Note This different timeframe does not allow for direct comparison between the two data sources. For instance, the CCHS reports that across the entire sample of respondents aged 15 and over, 1.8% said they used cannabis daily in the past 12 months, while in the CTADS, the estimate for daily or almost daily use in the past 3 months for the same age group was 2.9%.
A third data source, the General Social Survey (GSS) on victimization, asks about cannabis use in the past month only, and records the frequency of use for those who respond affirmatively. In 2014, the GSS estimated that 1.5% of the population aged 15 and over used cannabis on a daily basis, which is a rate very similar to the finding produced by the CCHS in 2012. Since it is not possible with the GSS to separate non‑users in the past month with those who have never used in their lifetime, the GSS measures of non‑users of cannabis therefore include those who never used as well as those who may have used in the past but not in the past month. In this paper, both the CTADS and GSS are used to get as complete a picture of current cannabis use in Canada as possible.
Chart 1 shows individuals’ cannabis use for their lifetime, in the past year, in the past 3 months, in the past month, and daily. The first three are derived using the 2015 CTADS, while the latter two use data from the 2014 GSS. Across the entire sample of individuals aged 15 and over, about 45% said that they had ever tried or used cannabis; 12% said they used it in the past year; about 9% in the past 3 months; about 7% in the past month; and 1.5% used cannabis daily in the past month. These results correspond closely to those reported using the CCHSNote and the Canadian Alcohol and Drug Use Monitoring Survey (CADUMS) conducted by Health Canada.Note

Data table for Chart 1
| Prevalence of use | Percent |
|---|---|
| LifetimeData table Note 1 | 44.5 |
| Used in the past 12 monthsData table Note 1 | 12.3 |
| Used in the past 3 monthsData table Note 1 | 8.8 |
| Used in the past monthData table Note 2 | 6.8 |
| Used daily in the past monthData table Note 2 | 1.5 |
|
|
Cannabis use, however, is not distributed evenly throughout the population. Age, in particular, is a major factor affecting the likelihood of whether someone has used cannabis. Over 30% of respondents in their 20s said that they used cannabis in the past year, which steadily decreases with each age group to a low of 4% for those aged 55 and over (Chart 2). The proportion of those who use cannabis frequently is also highest among young adults between the ages of 20 and 29, with close to 15% saying that in the last 3 months they used cannabis at least on a weekly basis. Meanwhile, 2% of adults aged 55 and over said they used cannabis with the same frequency.Note

Data table for Chart 2
| Age | Used weekly or daily in past 3 months | Used monthly or less in past 3 months | Used in the past year but not in past 3 months | Not used in past year | Never used |
|---|---|---|---|---|---|
| percent | |||||
| 15 to 19 years | 7.3 | 7.2 | 4.4 | 4.9 | 76.2 |
| 20 to 24 years | 13.3 | 9.2 | 8.7 | 18.1 | 50.7 |
| 25 to 29 years | 13.7 | 9.7 | 7.9 | 30.2 | 38.6 |
| 30 to 34 years | 7.9 | 3.6 | 3.8 | 36.0 | 48.9 |
| 35 to 44 years | 5.6 | 3.1 | 4.8 | 36.3 | 50.3 |
| 45 to 54 years | 3.9 | 2.8 | 2.0 | 35.1 | 56.2 |
| 55 years and over | 1.7 | 1.3 | 0.8 | 23.9 | 72.3 |
| Source: Statistics Canada, Canadian Tobacco, Alcohol and Drugs Survey, 2015. | |||||
Cannabis use also varies by sex, both in terms of lifetime prevalence and frequency of use (Chart 3). Almost half of men (48%) reported that they had used cannabis in their lifetime (compared with 32% for women). Men also reported higher rates of cannabis use in the past year, but the difference was not as large (16% versus 10%). In addition, men used cannabis on a weekly or daily basis at a higher percentage than women: 8% of men and 3% of women reported using cannabis on a weekly or daily basis over the past 3 months.

Data table for Chart 3
| Sex | Used weekly or daily in past 3 months | Used monthly or less in past 3 months | Used in the past year but not in past 3 months | Not used in past year | Never used |
|---|---|---|---|---|---|
| percent | |||||
| Men | 8.1 | 3.9 | 3.6 | 32.7 | 51.6 |
| Women | 3.1 | 3.7 | 3.2 | 22.5 | 67.6 |
| Source: Statistics Canada, Canadian Tobacco, Alcohol and Drugs Survey, 2015. | |||||
Cannabis use also varies by more than just age and sex. When results are adjusted for age and sex differences, individuals with less than a high school education have a significantly lower prevalence of cannabis use in the past month (6%) than those with a high school diploma or a non‑university postsecondary (PSE) diploma (Table 1). Moreover, about 2% of those with a university degree said they used cannabis at least two to six times in the past week, a value significantly lower than the 3% for those with less than a high school education. After taking age and sex differences into account, students were also less likely to use cannabis than those who were employed during the last year.Note
| Prevalence of cannabis use in the past month | ||
|---|---|---|
| At least once | At least 2 to 6 times a week | |
| percent | ||
| Total | 6.8 | 3.3 |
| Highest level of completed education | ||
| Less than high school (ref.) | 6.0 | 3.2 |
| High school only | 8.5Note * | 4.4Note * |
| PSE - Non-university | 7.3Note * | 3.6 |
| PSE - University | 5.0 | 1.7Note * |
| Main activity last year | ||
| Employed (ref.) | 7.7 | 3.7 |
| Student | 4.1Note * | 1.5Note * |
| Caring for children, household work, parental leave | 6.8 | 4.8 |
| Other | 11.5Note * | 7.9Note * |
| Household income | ||
| Less than $40,000 (ref.) | 9.4 | 4.8 |
| $40,000 to $79,999 | 7.2Note * | 3.4Note * |
| $80,000 to $119,000 | 6.9Note * | 3.1Note * |
| $120,000 or more | 4.8Note * | 2.0Note * |
| Not stated | 7.3Note * | 3.8 |
| Marital Status | ||
| Single, never married (ref.) | 8.0 | 3.9 |
| Married, common law | 5.5Note * | 2.4Note * |
| Separated/divorced/widowed | 9.7 | 5.8 |
| Type of work or occupationTable 1 Note 1 | ||
| Management | 6.5 | 2.5 |
| Business, finance and administration | 6.1 | 2.9 |
| Natural and applied sciences and related | 6.6 | 2.1 |
| Health (ref.) | 4.3 | 2.0 |
| Education, law and social, community and government services | 5.3 | 2.0 |
| Art, culture, recreation and sport | 8.5Note * | 4.5Note * |
| Sales and service | 8.1Note * | 3.7Note * |
| Trades, transport and equipment operators and related | 9.2Note * | 5.3Note * |
| Natural resources, agriculture and related | 9.1Note * | 4.0 |
| Manufacturing and utilities | 7.4Note * | 2.7 |
| No occupation | 5.0 | 2.9 |
|
||
With respect to household income, those who live in households earning less than $40,000 annually use cannabis more frequently than those at higher income levels, a finding that holds for those who use on a monthly basis as well as for those who used at least two to six times a week. Furthermore, the married / common law population has a significantly lower rate of cannabis use than the single, never married population. Lastly, cannabis use is not spread evenly across occupation levels. Those in art, culture, recreation and sport, and in sales and service, as well those in trades, natural resources, and manufacturing and utilities use cannabis more frequently than those in health-related professions.
A quarter of Canadian adults had tried cannabis by the age of 18
A great deal of past work shows that the age when drug use begins has an impact on various outcomes including, but not limited to, issues related to dependence and health, as well as concerns associated with learning and educational attainment.Note Chart 4 shows the cumulative probability of first cannabis use by age for the entire sample of individuals aged 15 and over, and separately for men and women.Note One of the main findings is the steep uptake of first cannabis use between the ages of 15 and 18. By age 15, 9% of the population had ever tried or used cannabis. This increased to 15% by the age of 16 and to 25% by 18. Thus, one‑quarter of the adults in Canada had tried or used cannabis by the time they were 18.Note

Data table for Chart 4
| Age when first tried or used cannabis | Total | Men | Women |
|---|---|---|---|
| proportions | |||
| 8 | 0.0003 | 0.0005 | 0.0001 |
| 9 | 0.0006 | 0.0011 | 0.0002 |
| 10 | 0.0016 | 0.0019 | 0.0013 |
| 11 | 0.0033 | 0.0030 | 0.0035 |
| 12 | 0.0100 | 0.0105 | 0.0094 |
| 13 | 0.0239 | 0.0297 | 0.0183 |
| 14 | 0.0500 | 0.0602 | 0.0401 |
| 15 | 0.0862 | 0.1002 | 0.0727 |
| 16 | 0.1500 | 0.1786 | 0.1224 |
| 17 | 0.2034 | 0.2423 | 0.1659 |
| 18 | 0.2492 | 0.2950 | 0.2051 |
| 19 | 0.2789 | 0.3327 | 0.2271 |
| 20 | 0.3156 | 0.3767 | 0.2566 |
| 21 | 0.3305 | 0.3939 | 0.2694 |
| 22 | 0.3493 | 0.4217 | 0.2796 |
| 23 | 0.3580 | 0.4285 | 0.2902 |
| 24 | 0.3636 | 0.4335 | 0.2963 |
| 25 | 0.3762 | 0.4491 | 0.3060 |
| 26 | 0.3800 | 0.4512 | 0.3114 |
| 27 | 0.3848 | 0.4568 | 0.3156 |
| 28 | 0.3871 | 0.4605 | 0.3165 |
| 29 | 0.3885 | 0.4626 | 0.3173 |
| 30 | 0.3994 | 0.4773 | 0.3247 |
| 31 | 0.4020 | 0.4815 | 0.3256 |
| 32 | 0.4039 | 0.4818 | 0.3291 |
| 33 | 0.4060 | 0.4847 | 0.3306 |
| 34 | 0.4065 | 0.4853 | 0.3309 |
| 35 | 0.4120 | 0.4911 | 0.3362 |
| 36 | 0.4159 | 0.4958 | 0.3393 |
| 37 | 0.4164 | 0.4959 | 0.3400 |
| 38 | 0.4174 | 0.4975 | 0.3405 |
| 39 | 0.4183 | 0.4988 | 0.3412 |
| 40 | 0.4197 | 0.5003 | 0.3424 |
| 41 | 0.4213 | 0.5016 | 0.3444 |
| 42 | 0.4217 | 0.5016 | 0.3451 |
| 43 | 0.4236 | 0.5029 | 0.3475 |
| 44 | 0.4260 | 0.5062 | 0.3491 |
| 45 | 0.4283 | 0.5095 | 0.3504 |
| 46 | 0.4302 | 0.5107 | 0.3530 |
| 47 | 0.4322 | 0.5115 | 0.3561 |
| 48 | 0.4349 | 0.5134 | 0.3596 |
| 49 | 0.4406 | 0.5186 | 0.3658 |
| 50 | 0.4467 | 0.5250 | 0.3716 |
| 51 | 0.4481 | 0.5268 | 0.3726 |
| 52 | 0.4534 | 0.5363 | 0.3740 |
| 53 | 0.4554 | 0.5390 | 0.3753 |
| 54 | 0.4581 | 0.5430 | 0.3767 |
| 55 | 0.4605 | 0.5454 | 0.3789 |
| 56 | 0.4653 | 0.5482 | 0.3859 |
| 57 | 0.4675 | 0.5507 | 0.3877 |
| 58 | 0.4702 | 0.5524 | 0.3915 |
| 59 | 0.4730 | 0.5551 | 0.3941 |
| 60 | 0.4756 | 0.5559 | 0.3985 |
| 61 | 0.4782 | 0.5581 | 0.4016 |
| 62 | 0.4822 | 0.5600 | 0.4075 |
| 63 | 0.4866 | 0.5651 | 0.4113 |
| 64 | 0.4904 | 0.5711 | 0.4130 |
| 65 | 0.4919 | 0.5718 | 0.4153 |
| 66 | 0.4941 | 0.5757 | 0.4158 |
| 67 | 0.4962 | 0.5779 | 0.4177 |
| 68 | 0.5018 | 0.5840 | 0.4228 |
| 69 | 0.5041 | 0.5871 | 0.4244 |
| 70 | 0.5100 | 0.5906 | 0.4326 |
| 71 | 0.5126 | 0.5930 | 0.4353 |
| 72 | 0.5137 | 0.5951 | 0.4355 |
| 73 | 0.5183 | 0.6024 | 0.4374 |
| 74 | 0.5220 | 0.6024 | 0.4447 |
| 75 | 0.5241 | 0.6053 | 0.4459 |
| 76 | 0.5314 | 0.6121 | 0.4538 |
| 77 | 0.5385 | 0.6135 | 0.4666 |
| 78 | 0.5396 | 0.6138 | 0.4684 |
| 79 | 0.5424 | 0.6143 | 0.4734 |
| 80 | 0.5434 | 0.6156 | 0.4742 |
| Source: Statistics Canada, Canadian Tobacco, Alcohol and Drugs Survey, 2015. | |||
Differences were seen between men and women, the result of a steeper increase in cannabis initiation after age 16 among men. At age 15 for example, 10% of men had ever tried cannabis while the rate for women was 7%, however, by age 16 this rate increased to 18% for men and 12% for women. This percentage point difference between men and women increases to around 15 points by the time young adults are in their late 20s and remains consistent thereafter.
There is an association between age of first use and frequency of cannabis use as adults.Note Hence, among those who said they first tried cannabis at age 14 or younger, 31% said that they currently used cannabis on a weekly or daily basis (Chart 5). By contrast, among those who first tried cannabis when they were 16 or over, less than 13% said that they currently used this substance on weekly or daily basis.

Data table for Chart 5
| Age when first tried or used cannabis | Frequency of cannabis use | ||
|---|---|---|---|
| Not used in past year | Used monthly or lessData table Note 1 | Used weekly or daily in the past 3 months | |
| percent | |||
| 14 years or under | 51.2 | 17.8 | 31.0 |
| 15 years | 56.9 | 20.9 | 22.2 |
| 16 years | 64.1 | 23.7 | 12.2 |
| 17 years | 74.7 | 14.5 | 10.8 |
| 18 years | 74.6 | 17.4 | 8.0 |
| 19 years | 71.8 | 20.9 | 7.4 |
| 20 years | 80.3 | 13.0 | 6.7 |
| 21 or over | 73.9 | 15.6 | 10.5 |
|
|||
People who use cannabis on a frequent basis are more likely to report harmful effects from cannabis consumption
In the CTADS, information on problems or issues related to the consumption of cannabis is available for those who have ever used cannabis more than once. Results are shown separately for those who first tried cannabis at the age of 14 or under and for those who first tried it after the age of 14, as well as by frequency of use.Note
Among those who ever used cannabis, 9% said that they ever had a strong urge or desire to use cannabis, while about 3% said that they had at some point in their life tried unsuccessfully to control, cut down or stop using cannabis. Meanwhile, about 4% said that their cannabis use had led to health, social, legal or financial problems, while around 7% said that their cannabis use had affected their ability to do expected tasks—and that a friend or relative had expressed concern about their cannabis use.
In addition, given the relationship between the age when cannabis is first tried and a greater prevalence of recent cannabis use, the proportion of those who reported problems related to cannabis use was significantly higherNote in the case of people who began to use cannabis at an earlier age and among those who used it more frequently.
For instance, 23% of people who first tried cannabis when they were aged 14 or under said they had at some point in their life had a strong desire or urge to use it; this rate drops to 7% if they first used cannabis after the age of 14 (Chart 6a). Meanwhile, the corresponding rate for those who use cannabis on a weekly or daily basis was 30%, 9% for those who used it monthly or less, and 5% for those who had not used it in the past year (Chart 6b). Similarly, about 7% of those who first tried cannabis when they were 14 or under said they had ever tried unsuccessfully to control, cut down or stop cannabis use; this compared with 2% among those who first tried cannabis when they were over 14. Moreover, 8% of those who use on a weekly or daily basis said the same, while the rate drops to less than 4% for those who use it monthly or less often, and 1% for those who had not used it in the past year. A similar pattern is noted for each of the harms resulting from cannabis use.
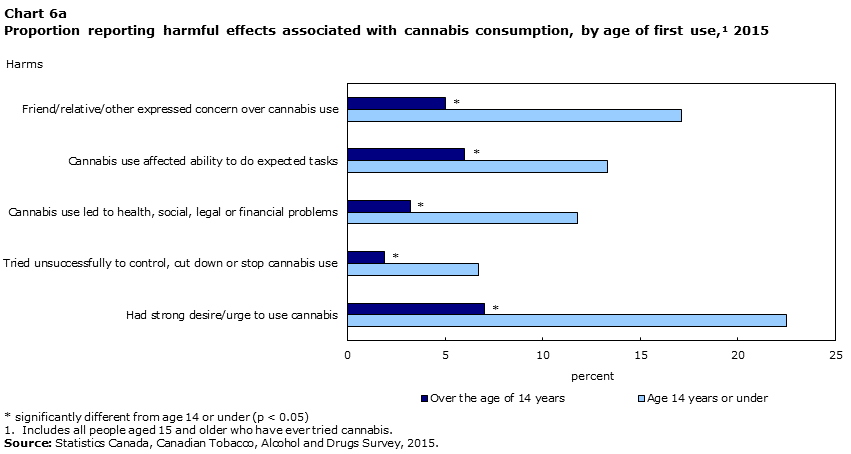
Data table for Chart 6a
| Self-reported harms | Age of first cannabis use | |
|---|---|---|
| Age 14 years or under | Over the age of 14 years | |
| percent | ||
| Friend/relative/other expressed concern over cannabis use | 17.1 | 5.0Note * |
| Cannabis use affected ability to do expected tasks | 13.3 | 6.0Note * |
| Cannabis use led to health, social, legal or financial problems | 11.8 | 3.2Note * |
| Tried unsuccessfully to control, cut down or stop cannabis use | 6.7 | 1.9Note * |
| Had strong desire/urge to use cannabis | 22.5 | 7.0Note * |
|
||
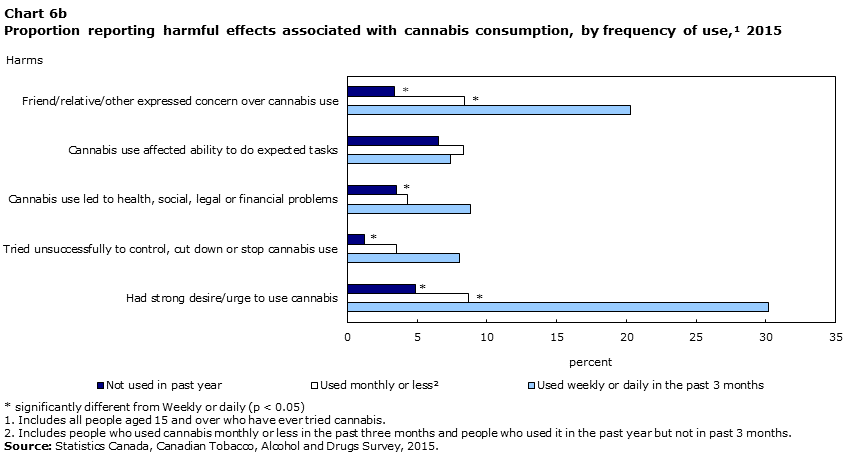
Data table for Chart 6b
| Self-reported harms | Frequency of cannabis use | ||
|---|---|---|---|
| Used weekly or daily in the past 3 months | Used monthly or lessData table Note 2 | Not used in past year | |
| percent | |||
| Friend/relative/other expressed concern over cannabis use | 20.3 | 8.4Note * | 3.4Note * |
| Cannabis use affected ability to do expected tasks | 7.4 | 8.3 | 6.5 |
| Cannabis use led to health, social, legal or financial problems | 8.8 | 4.3 | 3.5Note * |
| Tried unsuccessfully to control, cut down or stop cannabis use | 8.0 | 3.5 | 1.2Note * |
| Had strong desire/urge to use cannabis | 30.2 | 8.7Note * | 4.9Note * |
|
|||
There is a link between the presence of a physical or mental health disability and frequency of cannabis use, particularly among women
Past literature discusses at length the relationship between cannabis use and health. According to a recently published American study,Note for instance, the association between cannabis use and health is complex and research shows mixed results.Note The literature shows that the link appears to be dependent on factors such as the health factor under consideration, the timeframe (long- or short-term) as well as the population of interest. As a result, it is difficult to come up with a simple summary of the relationship between cannabis use and the health of the people who use it.
Nonetheless, in this study, two self-reported measures of disability are examined: (1) presence of a physical disability (which includes daily activities being limited by difficulty with mobility, bending down and picking up things, using fingers, and pain); and (2) an emotional, psychological or mental health disability (that may include anxiety, depression, bipolar disorder, substance consumption problems, anorexia, etc.) that at least sometimes limits daily activities.
Among those who used cannabis every day, 42% of women and 26% of men reported that they had a physical disability. This compared with 19% of women and 13% of men who had not used cannabis in the past month (Chart 7).
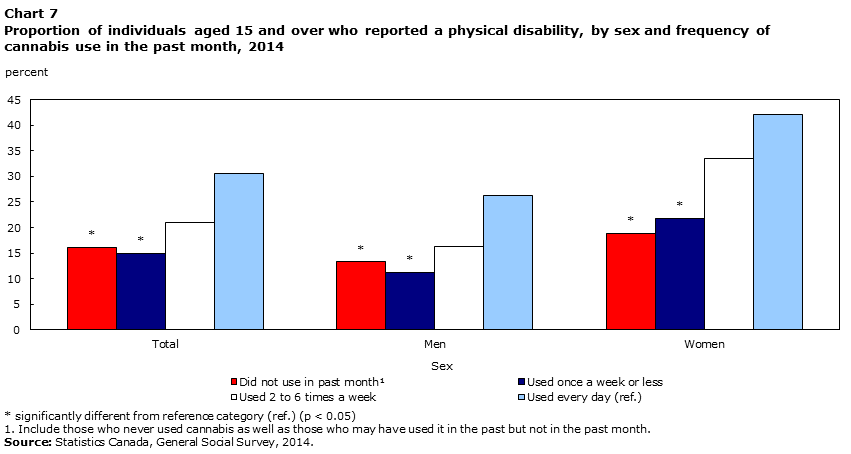
Data table for Chart 7
| Frequency of cannabis use | Total | Men | Women |
|---|---|---|---|
| percent | |||
| Did not use in past monthData table Note 1 | 16.2Note * | 13.3Note * | 18.9Note * |
| Used once a week or less | 15.0Note * | 11.3Note * | 21.8Note * |
| Used 2 to 6 times a week | 21.0 | 16.4 | 33.5 |
| Used every day (ref.) | 30.5 | 26.2 | 42.0 |
|
|||
The presence of a disability related to mental health is also associated with more frequent cannabis use in the past month. About 8% of all women said they had such a condition, while 4% of men said the same. The proportion of those reporting a disability related to mental health was higher among those who used cannabis more frequently, especially among women. For example, among women who had used cannabis every day in the month preceding the survey, 43% reported a disability related to mental health, compared with 7% among those who had not consumed cannabis in the past month (Chart 8).Note In other words, 36 percentage points separated women who had not used cannabis in the past month from those who used it on a daily basis. Among men, the same difference was 7 percentage points. Note

Data table for Chart 8
| Frequency of cannabis use | Total | Men | Women |
|---|---|---|---|
| percent | |||
| Did not use in past monthData table Note 1 | 5.5Note * | 4.0Note * | 6.8Note * |
| Used once a week or less | 11.1Note * | 7.7 | 17.1Note * |
| Used 2 to 6 times a week | 12.6 | 6.7 | 28.3 |
| Used every day (ref.) | 19.5 | 10.6 | 42.6 |
|
|||
Such results do not necessarily suggest that cannabis use leads to detrimental health outcomes. Rather, it could mean that individuals who have health issues use cannabis to alleviate their symptoms. The GSS, however, does not ask respondents about the reasons why cannabis was used; consequently, the results must be interpreted as associations and not as cause and effect relationships.
People who use cannabis frequently had lower confidence in the police and the justice system
Past work has found that in general Canadians have a relatively high level of trust in both the police and the justice system and courts.Note These high levels of confidence are important indicators of a greater sense of belonging to the country and to greater social cohesion.Note Lower levels of confidence, conversely, may point to a disconnection or a general mistrust of these institutions. In this section, the association between cannabis use and confidence in police and the criminal courts is examined. The overall distribution of confidence in these two institutions is split into lower (‘not very much’ and ‘none’) and higher (‘a great deal’ and ‘some’).
In general, men have significantly lower levels of confidence in both the police and the criminal court system. Among all individuals aged 15 and over, about 10% of men and 6% of women said they had a lower level of confidence in the police, while the corresponding figures for lower confidence in the court system are 26% and 21%, respectively.
Among those who used on a daily basis, however, it was the opposite: the proportion of those who had a lower level of confidence in these institutions was higher for women than it was for men. For instance, among those who used cannabis on a daily basis, 38% of women and 34% of men had a lower level of confidence in the police, compared with 6% of women and 9% of men who did not use cannabis in the past month (Chart 9). Similarly, 46% of women who used cannabis on a daily basis had a lower level of confidence in the justice system, compared with 21% of women who did not use cannabis in the past month (Chart 10).Note Among men, the relationship between cannabis use and confidence in the justice system was not significant.
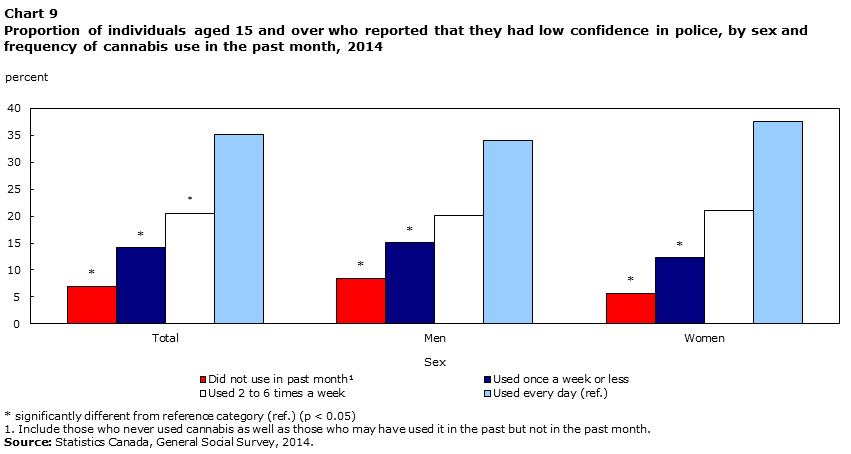
Data table for Chart 9
| Frequency of cannabis use | Total | Men | Women |
|---|---|---|---|
| percent | |||
| Did not use in past monthData table Note 1 | 7.0Note * | 8.5Note * | 5.7Note * |
| Used once a week or less | 14.1Note * | 15.1Note * | 12.3Note * |
| Used 2 to 6 times a week | 20.4Note * | 20.1 | 21.1 |
| Used every day (ref.) | 35.1 | 34.1 | 37.6 |
|
|||
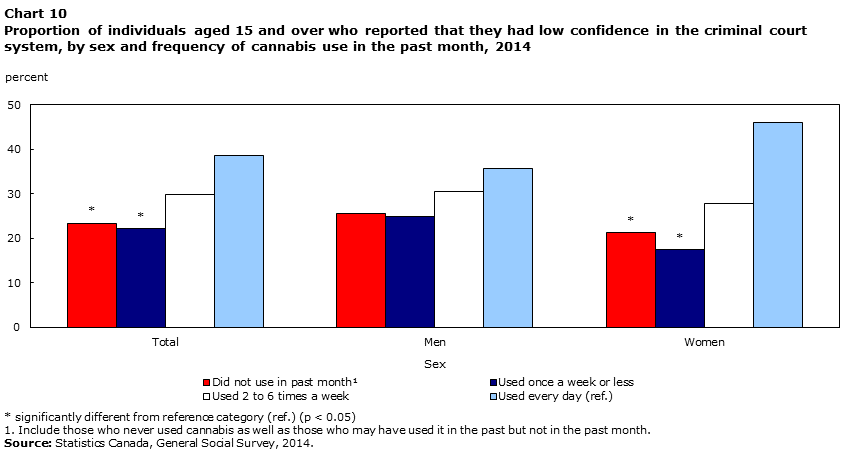
Data table for Chart 10
| Frequency of cannabis use | Total | Men | Women |
|---|---|---|---|
| percent | |||
| Did not use in past monthData table Note 1 | 23.4Note * | 25.5 | 21.3Note * |
| Used once a week or less | 22.2Note * | 24.9 | 17.4Note * |
| Used 2 to 6 times a week | 29.8 | 30.5 | 27.8 |
| Used every day (ref.) | 38.6 | 35.8 | 46.0 |
|
|||
Even after accounting for other factors, those who use cannabis more frequently are more likely to report that they have been victims of a violent crime
Past research has found a significant association between cannabis use and victimization,Note and the relationship may be partially explained by behavioural choices or lifestyles that expose those who use cannabis to greater risk and situations where the probability of violence is higher.Note The exact nature of the relationship cannot be disentangled here given the cross-sectional nature of the data, however, what is revealed is a significant association between cannabis use in the past month and the risk of violent victimization in the past year.Note
To study the relationship between cannabis use and self-reported victimization, the recent use of cannabis categories have been collapsed (due to sample size) into three categories: (1) did not use in the past month; (2) used two to three times a week or once or twice in the past month; and (3) used every day or four to six times a week. In all, about 4% of men and women said they were violently victimized in the past year. However, this rate is higher for both men and women who also said they used cannabis in the past month, especially among those who said they used four to six times a week or more. For example, about 24% of women and 21% of men who used cannabis at least four to six times a week stated that they had also experienced a violent victimization in the past year (Chart 11).
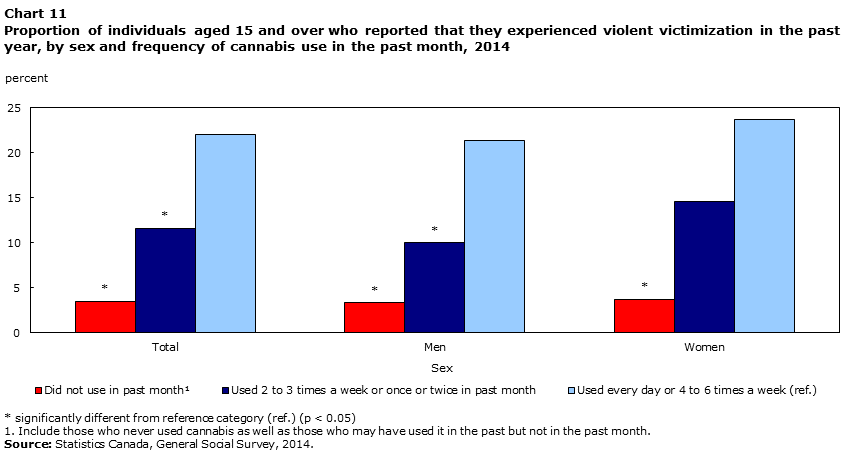
Data table for Chart 11
| Frequency of cannabis use | Total | Men | Women |
|---|---|---|---|
| percent | |||
| Did not use in past monthData table Note 1 | 3.5Note * | 3.3Note * | 3.7Note * |
| Used 2 to 3 times a week or once or twice in past month | 11.6Note * | 10.0Note * | 14.6 |
| Used every day or 4 to 6 times a week (ref.) | 22.0 | 21.3 | 23.7 |
|
|||
There are many factors, ranging from mental health to lifestyle choices that likely have an association with drug use and victimization. These factors are introduced in a series of multivariate logistic regressions, whose results are presented as predicted probabilitiesNote for ease of interpretation (Chart 12). Seven models are used: (1) bivariate; (2) adds age and sex; (3) adds highest level of education, Aboriginal self-identification, visible minority status, country of birth, main activity in the past year (such as being a student or working), household income, and marital status; (4) adds self-reported mental health; (5) adds measures of residential stability including, length of time in the current neighbourhood, number of moves in the past five years, renter or homeowner, and whether one had ever been homeless; (6) adds neighbourhood characteristic variables such as population size, perceived social disorder, and sense of belonging to the neighbourhood; and (7) adds lifestyle measures, including the average number of times in a month that the respondent says they go out to bars, clubs or pubs in the evening, as well as alcohol consumption and other illicit drug use in the past month.Note
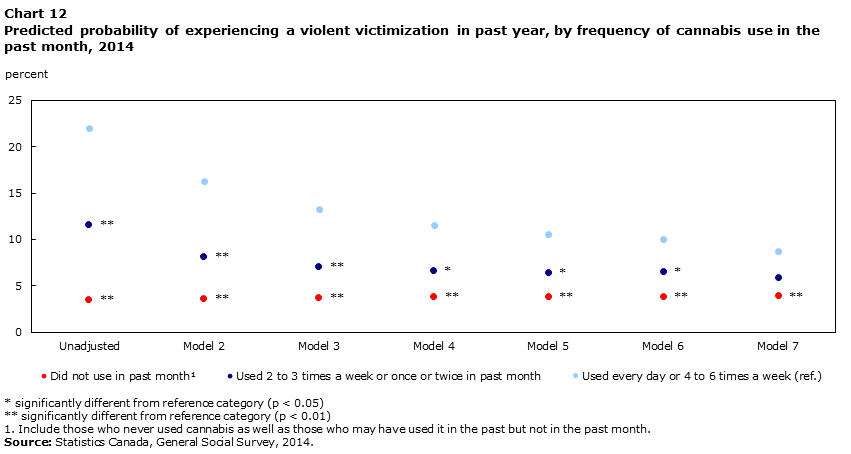
Data table for Chart 12
| Frequency of cannabis use | Unadjusted | Model 2 | Model 3 | Model 4 | Model 5 | Model 6 | Model 7 |
|---|---|---|---|---|---|---|---|
| percent | |||||||
| Did not use in past monthData table Note 1 | 3.5Note ** | 3.6Note ** | 3.7Note ** | 3.8Note ** | 3.8Note ** | 3.8Note ** | 3.9Note ** |
| Used 2 to 3 times a week or once or twice in past month | 11.6Note ** | 8.2Note ** | 7.1Note ** | 6.6Note * | 6.4Note * | 6.5Note * | 5.9 |
| Used every day or 4 to 6 times a week (ref.) | 22.0 | 16.3 | 13.3 | 11.6 | 10.6 | 10.0 | 8.7 |
|
|||||||
At no point is the difference between the highest level of cannabis use frequency (every day / four to six times a week) and other levels of frequency completely removed. For example, in the unadjusted case, there is a 19 percentage point difference between those who frequently used cannabis (every day or 4 to 6 times a week) and those who did not use it. Adding age and sex lowered this difference to 13, while adding mental health lowered it further to 8 percentage points. Even in Model 7, with the most extensive set of covariates, 5 percentage points separated those who used cannabis more frequently from those who did not use it (9% versus 4%).
Thus, for the most part, cannabis use is associated with a higher probability of violent victimization. These results suggest that the relationship between recent cannabis use and the risk of victimization cannot be explained away by factors that may also be associated with drug use and victimization.Note
People who use both cannabis and other illicit drug use are more likely to report adverse effects from drug use
While past work has found that most people who use other illicit drugs (such as cocaine, heroin and methamphetamines) are also users of cannabis, few users of cannabis used these other types of drugs.Note Similar results are found with CTADS data: about 17% of past-year users of cannabis said they also used other illicit drugs in the past year, while almost 90% of those who said that in the past-year they used other illicit drugs also said they used cannabis in the past year. Further work is needed to explore whether these types of findings support the notion that cannabis acts as a gateway drug, whereby its use may lead to a greater risk of using other illicit drugs in the future.Note
Cannabis use in the absence of other illicit drugs has been found to have fewer adverse effects (on social relationships and friendships, physical health, work, educational studies and employment opportunities, financial position, and ability to learn) than when cannabis is used simultaneously with these other drugs.Note Respondents who use other illicit drugs are defined as those who said that in the past year they used any of the following drugs: cocaine, speed/methamphetamine, ecstasy, hallucinogens, heroin, inhalants and salvia.Note ,Note Results are presented separately for those who said they used cannabis in the absence of other illicit drugs and for users of cannabis who also used other illicit drugs. Readers should keep in mind that, across the entire sample (individuals aged 15 and over), close to 90% did not use cannabis or other illicit drugs in the past year, while about 10% used cannabis without other illicit drugs. Moreover, 2% used cannabis and other illicit drugs, while 0.3% used other illicit drugs in the absence of cannabis.Note
Results show that cannabis use in conjunction with other illicit drug use is associated with a higher probability of adverse effects than cannabis use on its own, a finding that likely points more to the detrimental impact of other illicit drugs than to the presence of cannabis.
For example, about 5% of people who used cannabis without using other illicit drugs in the past year said they experienced a harm to their physical health because of drug use—a proportion that was more than 20% among those who used cannabis who also used other illicit drugs (Chart 13). A similar pattern was observed for all five harms examined. For example, close to 15% of people who used cannabis and who also used other illicit drugs said they experienced harm to their friendships, social life or home life, and marriage, compared with about 3% for those who only used cannabis.
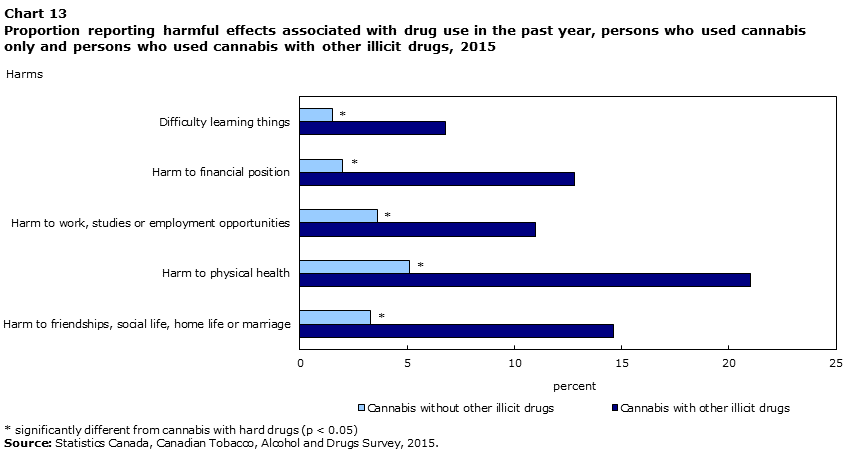
Data table for Chart 13
| Self-reported harms | Drug use in past year | |
|---|---|---|
| Cannabis with other illicit drugs | Cannabis without other illicit drugs | |
| percent | ||
| Difficulty learning things | 6.8 | 1.5Note * |
| Harm to financial position | 12.8 | 2.0Note * |
| Harm to work, studies or employment opportunities | 11.0 | 3.6Note * |
| Harm to physical health | 21.0 | 5.1Note * |
| Harm to friendships, social life, home life or marriage | 14.6 | 3.3Note * |
|
||
Conclusion
Cannabis legislation in Canada within the next year will likely alter the landscape for drug use. The goal of this paper was to use two relatively recent large-scale nationally representative surveys to examine the characteristics associated with cannabis use as well as the relationship between several social indicators and cannabis use—before legislation takes effect. This study found that, in terms of prevalence, almost one‑half of the Canadian population aged 15 and over said they had ever tried or used cannabis at some point in their life. A further 7% said they had used cannabis in the past month, and 1.5% said they had used it on a daily basis over the past month. Prevalence was higher for men, young adults aged 20 to 29, and those with an annual household income of less than $40,000.
The age when cannabis was first used or tried was found to occur most frequently during adolescence. For example, about 9% said they had tried or used cannabis by the age of 15, however, by 18 that percentage increases to about one‑quarter of the Canadian population having tried or used cannabis.Note The age of first cannabis use has implications for recent cannabis use. For instance, those who first tried cannabis at age 14 or younger currently use cannabis in much higher proportions on a weekly or daily basis than those who first tried it after that age. Such results are important because people who use cannabis frequently are more likely to report harmful effects from cannabis consumption, such as a strong desire or urge to use cannabis or an inability to control or stop its use.
Lastly, the study found a link between the presence of a physical or mental health disability and frequency of cannabis use, especially for women. Some people who use cannabis may use the substance in order to alleviate their symptoms; however, this was not something that could be examined with the current data. There is also an association between daily cannabis use and having a self-reported low level of confidence in police and the court system. Frequent cannabis use is also associated with a higher risk of violent victimization for men and women, a finding that remains even after controlling for a wide range of factors also associated with victimization.
The culmination of these results suggests that, even though no causal link can be made, there is an association between frequency of cannabis use and several social indicators. This study also found that cannabis use in conjunction with other illicit drug use (such as cocaine, heroin and methamphetamines) is associated with a higher incidence of adverse effects than cannabis use on its own, from issues related to physical health, friendships, social life, home life and marriage.
Sébastien LaRochelle-Côté is editor-in-chief of Insights on Canadian Society at Statistics Canada, and Darcy Hango is a senior researcher with the same group at Statistics Canada.
Start of text boxData source
This report uses data from the 2015 Canadian Tobacco, Alcohol and Drugs Survey (CTADS) as well as the 2014 General Social Survey (GSS) on Canadians’ Safety (Victimization). The target populations for these two surveys include the non‑institutionalized Canadian population aged 15 and over living in the 10 provinces. The data for CTADS were collected throughout the 2015 calendar year while the GSS data collection period was throughout the 2014 calendar year. Responding to the survey is voluntary and the data are collected directly from the survey respondents (self-declared). The final sample size for CTADS 2015 is 15,154, with a 48.4% overall response rate. For the 2014 GSS the final sample size is 33,127, with a 52.9% overall response rate.
Definitions
Two of the indicators used in this paper are related to physical and mental health disability. These disability measures are based on the Disability Screening Questions (DSQ).Note The DSQ are Statistics Canada’s measures of disability. They provide a measure based on the social model of disability that takes activity limitations into account in order to identify a disability. The DSQ are meant to be included in several general population surveys to allow comparisons of people with and without a disability. The GSS 2014 used a shorter version of the DSQ. This paper uses the derived variables related to physical and mental health disability.
Cannabis measurement in this paper comes from two different surveys: the 2015 CTADS 2015 and the 2014 GSS-27. Each uses a somewhat different method of measurement. In the 2015 CTADS, the exact wording used is as follows: “The next questions are about cannabis. In this next series of questions when we use the term marijuana, we mean the use of marijuana, hashish, hash oil or any other preparation of the cannabis plant.” The following questions were used in the analysis in this paper:
- During your lifetime, have you ever used or tried marijuana? (yes/no)
- Have you used marijuana just once or more than once? (yes/no)
- During the past 12 months have you used marijuana? (yes/no)
- During the past three months have you used marijuana? (yes/no)
- During the past three months how often did you use marijuana? (once or twice/monthly/weekly/daily or almost daily)
- How old were you when you tried or started using marijuana?
In 2014 GSS, the exact wording used is as follows: “The following questions ask about the use of drugs. Please do not include medications that are taken (on a doctor's prescription) or bought over-the-counter.” The following questions were used in the analysis in this paper:
- In the past month, did you use marijuana, hashish, hash oil or other cannabis derivatives? (yes/no)
- How often in the past month, did you use marijuana, hashish, hash oil or other cannabis derivatives? (every day / four to six times a week / two to three times a week / once a week / once or twice in the past month)
Start of text box
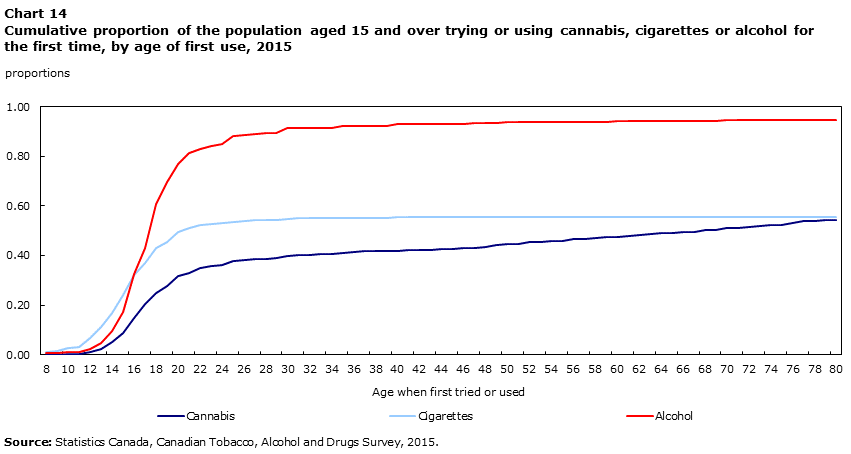
The age of first cannabis use follows a similar pattern to the age of first cigarette and alcohol use, except that at each age the use of cannabis is lower. In all cases, however, the typical age at initial use is during adolescence. Hence, by the age of 15, 9% of the sample had first tried cannabis and 17% had tried alcohol, while 24% had tried a cigarette (Chart 14). By the age of 18, 25% had first tried cannabis, 61% had tried alcohol, and 43% had tried a cigarette. And by the age of 25, 38% had tried cannabis, 88% had tried alcohol, and 54% had tried cigarettes. For the latter two, there are very few–only about 2 percentage points for cigarettes–who try these substances for the first time after turning 25. However, there is a 16 percentage point increase in uptake for cannabis after 25 (from 38% to 54%).
Data table for Chart 14
| Age when first tried or used | Substance | ||
|---|---|---|---|
| Cannabis | Cigarettes | Alcohol | |
| proportions | |||
| 8 | 0.0003 | 0.0099 | 0.0056 |
| 9 | 0.0006 | 0.0152 | 0.0060 |
| 10 | 0.0016 | 0.0256 | 0.0101 |
| 11 | 0.0033 | 0.0325 | 0.0119 |
| 12 | 0.0100 | 0.0680 | 0.0240 |
| 13 | 0.0239 | 0.1128 | 0.0469 |
| 14 | 0.0500 | 0.1690 | 0.0960 |
| 15 | 0.0862 | 0.2412 | 0.1739 |
| 16 | 0.1500 | 0.3199 | 0.3257 |
| 17 | 0.2034 | 0.3704 | 0.4292 |
| 18 | 0.2492 | 0.4290 | 0.6076 |
| 19 | 0.2789 | 0.4557 | 0.6959 |
| 20 | 0.3156 | 0.4946 | 0.7686 |
| 21 | 0.3305 | 0.5125 | 0.8142 |
| 22 | 0.3493 | 0.5224 | 0.8306 |
| 23 | 0.3580 | 0.5259 | 0.8406 |
| 24 | 0.3636 | 0.5297 | 0.8481 |
| 25 | 0.3762 | 0.5370 | 0.8831 |
| 26 | 0.3800 | 0.5399 | 0.8871 |
| 27 | 0.3848 | 0.5433 | 0.8911 |
| 28 | 0.3871 | 0.5443 | 0.8936 |
| 29 | 0.3885 | 0.5448 | 0.8958 |
| 30 | 0.3994 | 0.5489 | 0.9121 |
| 31 | 0.4020 | 0.5493 | 0.9126 |
| 32 | 0.4039 | 0.5503 | 0.9142 |
| 33 | 0.4060 | 0.5511 | 0.9147 |
| 34 | 0.4065 | 0.5512 | 0.9152 |
| 35 | 0.4120 | 0.5520 | 0.9209 |
| 36 | 0.4159 | 0.5521 | 0.9215 |
| 37 | 0.4164 | 0.5525 | 0.9220 |
| 38 | 0.4174 | 0.5525 | 0.9229 |
| 39 | 0.4183 | 0.5526 | 0.9234 |
| 40 | 0.4197 | 0.5552 | 0.9300 |
| 41 | 0.4213 | 0.5552 | 0.9301 |
| 42 | 0.4217 | 0.5552 | 0.9303 |
| 43 | 0.4236 | 0.5552 | 0.9305 |
| 44 | 0.4260 | 0.5552 | 0.9305 |
| 45 | 0.4283 | 0.5553 | 0.9321 |
| 46 | 0.4302 | 0.5553 | 0.9321 |
| 47 | 0.4322 | 0.5553 | 0.9328 |
| 48 | 0.4349 | 0.5553 | 0.9329 |
| 49 | 0.4406 | 0.5553 | 0.9331 |
| 50 | 0.4467 | 0.5556 | 0.9383 |
| 51 | 0.4481 | 0.5557 | 0.9383 |
| 52 | 0.4534 | 0.5557 | 0.9383 |
| 53 | 0.4554 | 0.5557 | 0.9388 |
| 54 | 0.4581 | 0.5557 | 0.9389 |
| 55 | 0.4605 | 0.5557 | 0.9395 |
| 56 | 0.4653 | 0.5557 | 0.9395 |
| 57 | 0.4675 | 0.5557 | 0.9395 |
| 58 | 0.4702 | 0.5557 | 0.9395 |
| 59 | 0.4730 | 0.5557 | 0.9395 |
| 60 | 0.4756 | 0.5557 | 0.9408 |
| 61 | 0.4782 | 0.5557 | 0.9409 |
| 62 | 0.4822 | 0.5557 | 0.9412 |
| 63 | 0.4866 | 0.5557 | 0.9412 |
| 64 | 0.4904 | 0.5557 | 0.9412 |
| 65 | 0.4919 | 0.5557 | 0.9412 |
| 66 | 0.4941 | 0.5557 | 0.9425 |
| 67 | 0.4962 | 0.5557 | 0.9425 |
| 68 | 0.5018 | 0.5557 | 0.9425 |
| 69 | 0.5041 | 0.5557 | 0.9425 |
| 70 | 0.5100 | 0.5557 | 0.9454 |
| 71 | 0.5126 | 0.5557 | 0.9454 |
| 72 | 0.5137 | 0.5557 | 0.9454 |
| 73 | 0.5183 | 0.5557 | 0.9454 |
| 74 | 0.5220 | 0.5557 | 0.9454 |
| 75 | 0.5241 | 0.5557 | 0.9464 |
| 76 | 0.5314 | 0.5557 | 0.9464 |
| 77 | 0.5385 | 0.5557 | 0.9464 |
| 78 | 0.5396 | 0.5557 | 0.9464 |
| 79 | 0.5424 | 0.5557 | 0.9475 |
| 80 | 0.5434 | 0.5557 | 0.9480 |
| Source: Statistics Canada, Canadian Tobacco, Alcohol and Drugs Survey, 2015. | |||
- Date modified:

