
Improvements to the Labour Force Survey (LFS)
The 2023 Revisions of the Labour Force Survey (LFS)
Skip to text
Text begins
1.0 Introduction
The Labour Force Survey (LFS) provides estimates of employment and unemployment, which are among the most timely and important measures of the performance of the Canadian economy. With the release of the survey results only 10 days after the completion of data collection, the LFS estimates are the first of Statistics Canada’s major monthly economic data series to be released.
Periodically, LFS data are revised, either to adopt the most recent geography, industry and occupation classifications; to take advantage of recent observations to fine-tune seasonal adjustment factors; or to introduce methodological enhancements. These revisions ensure that survey estimates accurately reflect the Canadian labour market, while having minimal impact on the comparability of labour market indicators, such as employment, unemployment, and participation rates over time.
The purpose of this publication is to document three aspects of a historical revision of LFS data to be published in January 2023, including:
- Transition to National Occupational Classification (NOC) 2021 V1.0: The full LFS historical series was revised back to its starting point in 1987. Differences in the structure of the classification impact all LFS data by occupation. As such, new data tables have been released to align with the NOC 2021 classification (see Section 2.0 for more details).
- Methodological enhancements to data processing and imputation: The methodology for detecting outliers and selecting donor records were enhanced. These changes were implemented historically, starting with January 2006 (see Section 3.0 for more details).
- Historical revision of seasonal adjustment factors: As is the standard practice, seasonally adjusted Labour Force Survey estimates for previous years have been revised using the latest seasonal factors. To account for updates in the data arising from the transition to the NOC 2021 classification and enhancements to data processing and imputation, revised seasonal adjustment factors have been applied over a longer time span, back to January 2002 (see Section 4.0 for more details).
2.0 Transition to National Occupational Classification (NOC) 2021
LFS historical series, starting in 1987, have been revised to the National Occupation Classification (NOC) 2021 V1.0. LFS was previously using occupational classification NOC 2016 V1.3.
Differences between the two classifications are extensive; for more information refer to the summary of changes from NOC 2016 Version 1.3 to NOC 2021 Version 1.0.
All LFS data tables for occupation have been revised back to the beginning of the series to reflect the NOC 2021 classification. A concordance table for the new and old tables published on the website is available in Appendix B.
2.1 NOC 2021 labour force variant
LFS microdata is coded to NOC 2021 at the 5-digit, unit group level and aggregated for dissemination. Due to LFS sample size limitations and structural differences for managers and professional occupations between the NOC 2016 and 2021 classifications, a variant of the NOC 2021 classification (Appendix A) has been developed. The variant groups occupations with similar characteristics (e.g., wages, tenure and hours worked) to manage LFS sample size limitations while disseminating as many detailed occupations as possible in LFS public tables and public use microdata files (PUMF).
The labour force variant regroups select NOC categories while maintaining all other aspects of the standard classification.
The NOC 2021 labour force variant has three main differences compared with the NOC 2021 standard:
- Middle management occupations from each broad occupational category are grouped with broad category NOC 0 – Legislative and senior management occupations as Management occupations in high-level occupational estimates, equivalent to training education, experience and responsibility (TEER) group 0.
- Professional occupations are disseminated at the 3-digit, sub-major level for occupations available at the 2-digit level in the NOC 2016 classification.
- Select 2-digit, major group categories with small sample sizes and similar characteristics are grouped for dissemination.
2.2 Impact on high-level occupational estimates
In 2022, the largest impacts on employment estimates by occupation were observed for trades, transport and equipment operators and related occupations (+222,000; +8.2%); business, finance and administration occupations (-93,000; -2.8%); natural and applied sciences and related occupations (-71,000; -3.9%) and sales and service occupations (+59,000; +1.4%).
These differences were largely due to the following structural changes between NOC 2021 and NOC 2016:
- Supervisors, mail and message distribution occupations moved from business, finance and administration occupations (NOC 2016 code 1214) to trades, transport and equipment operators and related occupations (NOC 2021 code 72025).
- Mail and message distribution occupations moved from business, finance and administration occupations (NOC 2016 code 151) to trades, transport and equipment operators and related occupations (NOC 2021 codes 741 – Mail and message distribution occupations and 75201 – Delivery service drivers and door-to-door distributors) and sales and service occupations (NOC 2021 code 64401 – Postal services representatives).
- Transportation officers and controllers moved from natural and applied sciences and related occupations (NOC 2016 code 227) to trades, transport and equipment operators and related occupations (NOC 2021 code 726).

Data table for Chart 1-A
| Revised - NOC 2021 | Unrevised - NOC 2016 | |
|---|---|---|
| thousands | ||
| Management occupations | 1,833.4 | 1,867.2 |
| Business, finance and administration occupations, except management | 3,180.1 | 3,272.7 |
| Natural and applied sciences and related occupations, except management | 1,767.3 | 1,838.6 |
| Health occupations, except management | 1,569.4 | 1,549.1 |
| Occupations in education, law and social, community and government services, except management | 2,287.9 | 2,304.2 |
| Occupations in art, culture, recreation and sport, except management | 569.3 | 575.6 |
| Sales and service occupations, except management | 4,323.7 | 4,264.5 |
| Trades, transport and equipment operators and related occupations, except management | 2,930.0 | 2,707.7 |
| Natural resources, agriculture and related production occupations, except management | 379.9 | 374.3 |
| Occupations in manufacturing and utilities, except management | 852.0 | 812.6 |
|
Notes: The revised estimates are calculated using revised data and the NOC 2021 Labour variant. The unrevised estimates are calculated using unrevised data and the NOC 2016 classification standard. Differences between the estimates arise from changes to the classification standard as well as LFS data processing enhancements. Source: Statistics Canada, Labour Force Survey (3701). |
||
3.0 Methodological enhancements to LFS data processing
Following data collection, LFS data are subjected to edit and imputation processes to correct any inconsistent or invalid responses. Enhancements to these processes have been implemented to take full advantage of the processing power available as a result of processing and computer systems changes introduced in January 2019 and to ensure that, consistent with statistical best practice, as much valid respondent data as possible is retained. These changes were implemented historically, starting with January 2006.
3.1 Enhancements to imputation
Imputation is a standard method used by surveys to replace missing data values. Whole record imputation is used when all questionnaire data for a person in a sampled household are missing, while item imputation is used when some, but not all, data are missing. In both cases, the LFS uses donor imputation, where responses from a donor record with similar characteristics are used to replace missing values.
While the overall LFS imputation strategy was not changed, the parameters used, including the list of variables used to create the imputation groups for the donor imputation, have been updated. As a result, the revised imputation system is more efficient at finding appropriate donors, preserving more respondent data and resorting less often to whole record imputation. This results in more efficient imputation for respondents with lower-prevalence characteristics, such as part-time employment and those on temporary layoff.
3.2 Enhancements to outlier detection of wages
Outlier detection is the method used to identify extreme values in data which appear to be inconsistent with the remainder of the dataset, and where respondent data should be replaced using imputation. The LFS uses outlier detection to identify extremely high or low values for wages for employees. As part of the historical revision, the process used for outlier detection of wages was updated to be more responsive to wage growth over time.
The enhancements to outlier detection led to a level shift in LFS wage estimates, phased in over the six months from January to June 2006. Users should use caution when comparing LFS wage estimates for the period immediately before and after January 2006.
Revised average hourly wages were 2.6% higher than unrevised wages over the full revision period from January 2006 to December 2022 (Chart 2-A). More recent average wages were less impacted by the revision, due to changes in the LFS processing system introduced in January 2019. From 2006 to 2018, revised wages were 2.9% higher on average, peaking at 3.5% higher in October 2011. From 2019 to 2022, revised average hourly wages were 2.0% higher than unrevised average hourly wages.
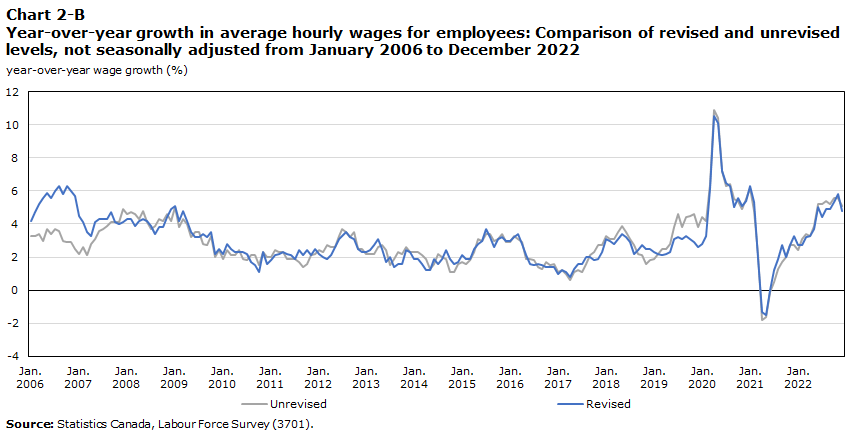
After the initial upward revision to wage estimates in 2006, trends in year-over-year wage growth among employees were equivalent on average in the revised and unrevised wage series (Chart 2-B). The 2023 revision to wages also reduced the impact of the data processing changes introduced in January 2019 on wage growth, leading to a more consistent wage series over the revision period. In December 2022, revised average hourly wages grew 4.8% (+$1.49 to $32.67) year-over-year, slightly less than the unrevised year-over-year increase of 5.1% (+$1.57 to $32.06).
As medians are less impacted by outliers in general, revised median hourly wages were 1.2% higher than the unrevised median hourly wages over the full revision period from 2006 to 2022: +1.5% on average over the period from 2006 to 2018 and +0.3% on average over the period from 2019 to 2022 (Chart 2-A).

Data table for Chart 2-A
| Revised average hourly wage rate | Unrevised average hourly wage rate | Revised median hourly wage rate | Unrevised median hourly wage rate | |
|---|---|---|---|---|
| current dollars ($) | ||||
| 2005 | ||||
| January | 19.02 | 19.02 | 17.00 | 17.00 |
| February | 18.98 | 18.98 | 17.00 | 17.00 |
| March | 19.05 | 19.05 | 17.00 | 17.00 |
| April | 19.09 | 19.09 | 17.00 | 17.00 |
| May | 18.87 | 18.87 | 16.83 | 16.83 |
| June | 18.89 | 18.89 | 16.83 | 16.83 |
| July | 18.76 | 18.76 | 16.48 | 16.48 |
| August | 18.88 | 18.88 | 16.60 | 16.60 |
| September | 19.30 | 19.30 | 17.00 | 17.00 |
| October | 19.33 | 19.33 | 17.00 | 17.00 |
| November | 19.45 | 19.45 | 17.03 | 17.03 |
| December | 19.45 | 19.45 | 17.00 | 17.00 |
| 2006 | ||||
| January | 19.81 | 19.64 | 17.32 | 17.32 |
| February | 19.88 | 19.60 | 17.39 | 17.31 |
| March | 20.05 | 19.69 | 17.50 | 17.35 |
| April | 20.15 | 19.67 | 17.58 | 17.44 |
| May | 19.99 | 19.56 | 17.37 | 17.10 |
| June | 19.94 | 19.53 | 17.31 | 17.00 |
| July | 19.89 | 19.45 | 17.22 | 17.00 |
| August | 20.07 | 19.56 | 17.31 | 17.00 |
| September | 20.42 | 19.87 | 17.80 | 17.50 |
| October | 20.55 | 19.90 | 17.79 | 17.48 |
| November | 20.61 | 20.01 | 17.95 | 17.65 |
| December | 20.55 | 19.93 | 17.95 | 17.50 |
| 2007 | ||||
| January | 20.70 | 20.07 | 18.00 | 17.71 |
| February | 20.70 | 20.11 | 18.00 | 17.79 |
| March | 20.75 | 20.10 | 18.00 | 17.75 |
| April | 20.81 | 20.23 | 18.00 | 18.00 |
| May | 20.80 | 20.17 | 18.00 | 17.82 |
| June | 20.80 | 20.23 | 18.00 | 17.82 |
| July | 20.75 | 20.17 | 18.00 | 17.63 |
| August | 20.93 | 20.33 | 18.00 | 18.00 |
| September | 21.38 | 20.69 | 18.50 | 18.13 |
| October | 21.40 | 20.72 | 18.51 | 18.14 |
| November | 21.43 | 20.83 | 18.60 | 18.27 |
| December | 21.40 | 20.91 | 18.50 | 18.32 |
| 2008 | ||||
| January | 21.58 | 21.00 | 18.83 | 18.47 |
| February | 21.60 | 21.06 | 18.80 | 18.50 |
| March | 21.56 | 21.02 | 18.75 | 18.50 |
| April | 21.69 | 21.10 | 18.96 | 18.50 |
| May | 21.70 | 21.13 | 18.75 | 18.46 |
| June | 21.68 | 21.05 | 18.75 | 18.33 |
| July | 21.55 | 20.91 | 18.50 | 18.15 |
| August | 21.64 | 21.12 | 18.75 | 18.50 |
| September | 22.19 | 21.58 | 19.23 | 19.00 |
| October | 22.22 | 21.59 | 19.23 | 19.00 |
| November | 22.38 | 21.78 | 19.23 | 19.20 |
| December | 22.44 | 21.79 | 19.38 | 19.23 |
| 2009 | ||||
| January | 22.67 | 22.04 | 19.79 | 19.37 |
| February | 22.50 | 21.86 | 19.71 | 19.23 |
| March | 22.59 | 21.92 | 19.78 | 19.23 |
| April | 22.61 | 21.95 | 19.83 | 19.23 |
| May | 22.46 | 21.80 | 19.49 | 19.00 |
| June | 22.37 | 21.78 | 19.30 | 19.20 |
| July | 22.25 | 21.65 | 19.23 | 19.00 |
| August | 22.38 | 21.72 | 19.23 | 19.00 |
| September | 22.89 | 22.17 | 20.00 | 19.57 |
| October | 22.99 | 22.30 | 20.00 | 19.50 |
| November | 22.88 | 22.22 | 20.00 | 19.50 |
| December | 22.99 | 22.31 | 20.00 | 19.75 |
| 2010 | ||||
| January | 23.16 | 22.46 | 20.00 | 20.00 |
| February | 23.12 | 22.39 | 20.00 | 19.84 |
| March | 23.16 | 22.39 | 20.00 | 19.78 |
| April | 23.12 | 22.40 | 20.00 | 19.78 |
| May | 22.97 | 22.33 | 20.00 | 19.54 |
| June | 22.88 | 22.19 | 20.00 | 19.28 |
| July | 22.73 | 22.03 | 19.76 | 19.23 |
| August | 22.77 | 22.18 | 20.00 | 19.25 |
| September | 23.23 | 22.64 | 20.00 | 20.00 |
| October | 23.24 | 22.64 | 20.00 | 20.00 |
| November | 23.41 | 22.74 | 20.00 | 20.00 |
| December | 23.36 | 22.76 | 20.00 | 20.00 |
| 2011 | ||||
| January | 23.58 | 22.90 | 20.00 | 20.00 |
| February | 23.60 | 22.92 | 20.00 | 20.00 |
| March | 23.68 | 22.91 | 20.00 | 20.00 |
| April | 23.66 | 22.92 | 20.00 | 20.00 |
| May | 23.47 | 22.76 | 20.00 | 20.00 |
| June | 23.37 | 22.62 | 20.00 | 19.78 |
| July | 23.17 | 22.44 | 20.00 | 19.50 |
| August | 23.31 | 22.55 | 20.00 | 19.70 |
| September | 23.71 | 22.96 | 20.00 | 20.00 |
| October | 23.80 | 23.00 | 20.19 | 20.00 |
| November | 23.91 | 23.22 | 20.41 | 20.00 |
| December | 23.95 | 23.26 | 20.50 | 20.00 |
| 2012 | ||||
| January | 24.10 | 23.44 | 20.67 | 20.11 |
| February | 24.08 | 23.45 | 20.75 | 20.19 |
| March | 24.13 | 23.53 | 20.57 | 20.19 |
| April | 24.15 | 23.51 | 20.53 | 20.19 |
| May | 24.09 | 23.36 | 20.24 | 20.00 |
| June | 24.09 | 23.37 | 20.33 | 20.00 |
| July | 23.93 | 23.27 | 20.00 | 20.00 |
| August | 24.13 | 23.34 | 20.19 | 20.00 |
| September | 24.48 | 23.70 | 21.00 | 20.33 |
| October | 24.54 | 23.81 | 21.00 | 20.65 |
| November | 24.50 | 23.79 | 21.00 | 20.67 |
| December | 24.50 | 23.84 | 21.00 | 20.85 |
| 2013 | ||||
| January | 24.65 | 23.95 | 21.00 | 21.00 |
| February | 24.66 | 23.96 | 21.00 | 20.96 |
| March | 24.79 | 24.05 | 21.00 | 20.98 |
| April | 24.91 | 24.13 | 21.07 | 20.96 |
| May | 24.69 | 23.98 | 21.00 | 20.60 |
| June | 24.50 | 23.92 | 20.92 | 20.40 |
| July | 24.40 | 23.63 | 20.48 | 20.00 |
| August | 24.46 | 23.79 | 20.67 | 20.19 |
| September | 24.88 | 24.24 | 21.05 | 21.00 |
| October | 24.94 | 24.33 | 21.15 | 21.00 |
| November | 25.08 | 24.40 | 21.25 | 21.00 |
| December | 25.06 | 24.40 | 21.30 | 21.00 |
| 2014 | ||||
| January | 25.12 | 24.49 | 21.54 | 21.09 |
| February | 25.14 | 24.52 | 21.63 | 21.03 |
| March | 25.19 | 24.55 | 21.63 | 21.09 |
| April | 25.20 | 24.58 | 21.63 | 21.37 |
| May | 24.99 | 24.30 | 21.43 | 21.00 |
| June | 24.97 | 24.31 | 21.03 | 21.00 |
| July | 24.79 | 24.15 | 21.00 | 20.98 |
| August | 24.93 | 24.26 | 21.00 | 20.96 |
| September | 25.47 | 24.69 | 22.00 | 21.50 |
| October | 25.41 | 24.60 | 21.80 | 21.25 |
| November | 25.47 | 24.66 | 22.00 | 21.54 |
| December | 25.49 | 24.80 | 21.98 | 21.63 |
| 2015 | ||||
| January | 25.65 | 24.91 | 22.00 | 21.68 |
| February | 25.63 | 24.92 | 22.00 | 21.63 |
| March | 25.66 | 25.00 | 22.00 | 21.77 |
| April | 25.83 | 25.14 | 22.00 | 21.88 |
| May | 25.69 | 25.05 | 22.00 | 21.63 |
| June | 25.73 | 25.04 | 22.00 | 21.75 |
| July | 25.70 | 24.98 | 21.95 | 21.63 |
| August | 25.73 | 25.08 | 22.00 | 21.63 |
| September | 26.14 | 25.43 | 22.44 | 22.00 |
| October | 26.21 | 25.36 | 22.49 | 22.00 |
| November | 26.29 | 25.49 | 22.64 | 22.00 |
| December | 26.26 | 25.52 | 22.56 | 22.00 |
| 2016 | ||||
| January | 26.41 | 25.62 | 22.75 | 22.12 |
| February | 26.45 | 25.73 | 22.73 | 22.10 |
| March | 26.52 | 25.78 | 22.84 | 22.12 |
| April | 26.55 | 25.86 | 23.00 | 22.45 |
| May | 26.22 | 25.53 | 22.00 | 22.00 |
| June | 26.14 | 25.51 | 22.00 | 22.00 |
| July | 26.08 | 25.42 | 22.00 | 21.77 |
| August | 26.13 | 25.43 | 22.00 | 21.87 |
| September | 26.53 | 25.77 | 22.50 | 22.00 |
| October | 26.59 | 25.79 | 22.53 | 22.10 |
| November | 26.65 | 25.86 | 22.83 | 22.44 |
| December | 26.62 | 25.92 | 22.89 | 22.50 |
| 2017 | ||||
| January | 26.68 | 25.90 | 23.00 | 22.57 |
| February | 26.77 | 26.04 | 23.00 | 22.56 |
| March | 26.82 | 26.04 | 23.00 | 22.64 |
| April | 26.77 | 26.01 | 23.00 | 22.50 |
| May | 26.57 | 25.80 | 22.61 | 22.02 |
| June | 26.56 | 25.81 | 22.80 | 22.00 |
| July | 26.49 | 25.71 | 22.12 | 22.00 |
| August | 26.66 | 25.84 | 22.50 | 22.00 |
| September | 27.05 | 26.30 | 23.00 | 23.00 |
| October | 27.08 | 26.39 | 23.00 | 23.00 |
| November | 27.16 | 26.55 | 23.00 | 23.00 |
| December | 27.24 | 26.61 | 23.08 | 23.00 |
| 2018 | ||||
| January | 27.50 | 26.75 | 23.56 | 23.08 |
| February | 27.56 | 26.84 | 23.50 | 23.08 |
| March | 27.57 | 26.86 | 23.50 | 23.00 |
| April | 27.59 | 26.92 | 23.50 | 23.08 |
| May | 27.48 | 26.81 | 23.08 | 23.00 |
| June | 27.41 | 26.72 | 23.08 | 23.00 |
| July | 27.25 | 26.50 | 23.00 | 22.70 |
| August | 27.25 | 26.55 | 23.00 | 23.00 |
| September | 27.70 | 26.89 | 23.59 | 23.08 |
| October | 27.80 | 26.94 | 23.81 | 23.08 |
| November | 27.84 | 26.97 | 23.75 | 23.08 |
| December | 27.91 | 27.10 | 24.00 | 23.47 |
| 2019 | ||||
| January | 28.14 | 27.26 | 24.00 | 23.50 |
| February | 28.17 | 27.44 | 24.00 | 24.00 |
| March | 28.14 | 27.52 | 24.00 | 24.00 |
| April | 28.19 | 27.60 | 24.01 | 24.00 |
| May | 28.12 | 27.57 | 24.00 | 24.00 |
| June | 28.26 | 27.74 | 24.04 | 24.00 |
| July | 28.13 | 27.71 | 24.00 | 24.00 |
| August | 28.09 | 27.57 | 24.00 | 24.00 |
| September | 28.62 | 28.06 | 24.62 | 24.50 |
| October | 28.65 | 28.14 | 24.71 | 24.52 |
| November | 28.65 | 28.22 | 24.65 | 24.73 |
| December | 28.63 | 28.14 | 24.52 | 24.50 |
| 2020 | ||||
| January | 28.94 | 28.46 | 25.00 | 25.00 |
| February | 29.09 | 28.59 | 25.00 | 25.00 |
| March | 29.88 | 29.27 | 25.05 | 25.00 |
| April | 31.14 | 30.62 | 27.00 | 26.92 |
| May | 30.97 | 30.44 | 26.78 | 26.67 |
| June | 30.29 | 29.73 | 26.00 | 25.96 |
| July | 29.96 | 29.45 | 25.36 | 25.27 |
| August | 29.87 | 29.34 | 25.15 | 25.01 |
| September | 30.05 | 29.59 | 25.64 | 25.64 |
| October | 30.26 | 29.66 | 25.77 | 25.64 |
| November | 30.12 | 29.60 | 25.64 | 25.64 |
| December | 30.18 | 29.69 | 26.00 | 26.00 |
| 2021 | ||||
| January | 30.75 | 30.23 | 26.44 | 26.44 |
| February | 30.63 | 29.97 | 26.06 | 26.00 |
| March | 30.46 | 29.89 | 26.00 | 26.00 |
| April | 30.72 | 30.07 | 26.16 | 26.00 |
| May | 30.52 | 29.94 | 26.00 | 25.96 |
| June | 30.29 | 29.70 | 25.81 | 25.50 |
| July | 30.33 | 29.59 | 25.55 | 25.00 |
| August | 30.43 | 29.73 | 25.50 | 25.21 |
| September | 30.87 | 30.10 | 26.15 | 26.00 |
| October | 30.87 | 30.26 | 26.25 | 26.00 |
| November | 30.93 | 30.40 | 26.06 | 26.04 |
| December | 31.18 | 30.49 | 26.44 | 26.07 |
| 2022 | ||||
| January | 31.59 | 30.95 | 27.00 | 26.98 |
| February | 31.47 | 30.89 | 26.89 | 26.67 |
| March | 31.44 | 30.92 | 26.92 | 26.75 |
| April | 31.72 | 31.06 | 27.00 | 26.92 |
| May | 31.64 | 31.12 | 26.92 | 26.92 |
| June | 31.80 | 31.24 | 27.00 | 27.00 |
| July | 31.65 | 31.14 | 26.92 | 26.90 |
| August | 31.91 | 31.33 | 27.00 | 27.00 |
| September | 32.38 | 31.67 | 27.59 | 27.50 |
| October | 32.52 | 31.94 | 27.88 | 27.88 |
| November | 32.71 | 32.11 | 28.00 | 28.00 |
| December | 32.67 | 32.06 | 28.00 | 28.00 |
| Source: Statistics Canada, Labour Force Survey (3701). | ||||
Data table for Chart 2-B
| Revised | Unrevised | |
|---|---|---|
| year-over-year wage growth (%) | ||
| 2006 | ||
| January | 4.2 | 3.3 |
| February | 4.7 | 3.3 |
| March | 5.2 | 3.4 |
| April | 5.6 | 3.0 |
| May | 5.9 | 3.7 |
| June | 5.6 | 3.4 |
| July | 6.0 | 3.7 |
| August | 6.3 | 3.6 |
| September | 5.8 | 3.0 |
| October | 6.3 | 2.9 |
| November | 6.0 | 2.9 |
| December | 5.7 | 2.5 |
| 2007 | ||
| January | 4.5 | 2.2 |
| February | 4.1 | 2.6 |
| March | 3.5 | 2.1 |
| April | 3.3 | 2.8 |
| May | 4.1 | 3.1 |
| June | 4.3 | 3.6 |
| July | 4.3 | 3.7 |
| August | 4.3 | 3.9 |
| September | 4.7 | 4.1 |
| October | 4.1 | 4.1 |
| November | 4.0 | 4.1 |
| December | 4.1 | 4.9 |
| 2008 | ||
| January | 4.3 | 4.6 |
| February | 4.3 | 4.7 |
| March | 3.9 | 4.6 |
| April | 4.2 | 4.3 |
| May | 4.3 | 4.8 |
| June | 4.2 | 4.1 |
| July | 3.9 | 3.7 |
| August | 3.4 | 3.9 |
| September | 3.8 | 4.3 |
| October | 3.8 | 4.2 |
| November | 4.4 | 4.6 |
| December | 4.9 | 4.2 |
| 2009 | ||
| January | 5.1 | 5.0 |
| February | 4.2 | 3.8 |
| March | 4.8 | 4.3 |
| April | 4.2 | 4.0 |
| May | 3.5 | 3.2 |
| June | 3.2 | 3.5 |
| July | 3.2 | 3.5 |
| August | 3.4 | 2.8 |
| September | 3.2 | 2.7 |
| October | 3.5 | 3.3 |
| November | 2.2 | 2.0 |
| December | 2.5 | 2.4 |
| 2010 | ||
| January | 2.2 | 1.9 |
| February | 2.8 | 2.4 |
| March | 2.5 | 2.1 |
| April | 2.3 | 2.1 |
| May | 2.3 | 2.4 |
| June | 2.3 | 1.9 |
| July | 2.2 | 1.8 |
| August | 1.7 | 2.1 |
| September | 1.5 | 2.1 |
| October | 1.1 | 1.5 |
| November | 2.3 | 2.3 |
| December | 1.6 | 2.0 |
| 2011 | ||
| January | 1.8 | 2.0 |
| February | 2.1 | 2.4 |
| March | 2.2 | 2.3 |
| April | 2.3 | 2.3 |
| May | 2.2 | 1.9 |
| June | 2.1 | 1.9 |
| July | 1.9 | 1.9 |
| August | 2.4 | 1.7 |
| September | 2.1 | 1.4 |
| October | 2.4 | 1.6 |
| November | 2.1 | 2.1 |
| December | 2.5 | 2.2 |
| 2012 | ||
| January | 2.2 | 2.4 |
| February | 2.0 | 2.3 |
| March | 1.9 | 2.7 |
| April | 2.1 | 2.6 |
| May | 2.6 | 2.6 |
| June | 3.1 | 3.3 |
| July | 3.3 | 3.7 |
| August | 3.5 | 3.5 |
| September | 3.2 | 3.2 |
| October | 3.1 | 3.5 |
| November | 2.5 | 2.5 |
| December | 2.3 | 2.5 |
| 2013 | ||
| January | 2.3 | 2.2 |
| February | 2.4 | 2.2 |
| March | 2.7 | 2.2 |
| April | 3.1 | 2.6 |
| May | 2.5 | 2.7 |
| June | 1.7 | 2.4 |
| July | 2.0 | 1.5 |
| August | 1.4 | 1.9 |
| September | 1.6 | 2.3 |
| October | 1.6 | 2.2 |
| November | 2.4 | 2.6 |
| December | 2.3 | 2.3 |
| 2014 | ||
| January | 1.9 | 2.3 |
| February | 1.9 | 2.3 |
| March | 1.6 | 2.1 |
| April | 1.2 | 1.9 |
| May | 1.2 | 1.3 |
| June | 1.9 | 1.6 |
| July | 1.6 | 2.2 |
| August | 1.9 | 2.0 |
| September | 2.4 | 1.9 |
| October | 1.9 | 1.1 |
| November | 1.6 | 1.1 |
| December | 1.7 | 1.6 |
| 2015 | ||
| January | 2.1 | 1.7 |
| February | 1.9 | 1.6 |
| March | 1.9 | 1.8 |
| April | 2.5 | 2.3 |
| May | 2.8 | 3.1 |
| June | 3.0 | 3.0 |
| July | 3.7 | 3.4 |
| August | 3.2 | 3.4 |
| September | 2.6 | 3.0 |
| October | 3.1 | 3.1 |
| November | 3.2 | 3.4 |
| December | 3.0 | 2.9 |
| 2016 | ||
| January | 3.0 | 2.9 |
| February | 3.2 | 3.3 |
| March | 3.4 | 3.1 |
| April | 2.8 | 2.9 |
| May | 2.1 | 1.9 |
| June | 1.6 | 1.9 |
| July | 1.5 | 1.8 |
| August | 1.6 | 1.4 |
| September | 1.5 | 1.3 |
| October | 1.4 | 1.7 |
| November | 1.4 | 1.5 |
| December | 1.4 | 1.6 |
| 2017 | ||
| January | 1.0 | 1.1 |
| February | 1.2 | 1.2 |
| March | 1.1 | 1.0 |
| April | 0.8 | 0.6 |
| May | 1.3 | 1.1 |
| June | 1.6 | 1.2 |
| July | 1.6 | 1.1 |
| August | 2.0 | 1.6 |
| September | 2.0 | 2.1 |
| October | 1.8 | 2.3 |
| November | 1.9 | 2.7 |
| December | 2.3 | 2.7 |
| 2018 | ||
| January | 3.1 | 3.3 |
| February | 3.0 | 3.1 |
| March | 2.8 | 3.1 |
| April | 3.1 | 3.5 |
| May | 3.4 | 3.9 |
| June | 3.2 | 3.5 |
| July | 2.9 | 3.1 |
| August | 2.2 | 2.7 |
| September | 2.4 | 2.2 |
| October | 2.7 | 2.1 |
| November | 2.5 | 1.6 |
| December | 2.5 | 1.8 |
| 2019 | ||
| January | 2.3 | 1.9 |
| February | 2.2 | 2.2 |
| March | 2.1 | 2.5 |
| April | 2.2 | 2.5 |
| May | 2.3 | 2.8 |
| June | 3.1 | 3.8 |
| July | 3.2 | 4.6 |
| August | 3.1 | 3.8 |
| September | 3.3 | 4.4 |
| October | 3.1 | 4.5 |
| November | 2.9 | 4.6 |
| December | 2.6 | 3.8 |
| 2020 | ||
| January | 2.8 | 4.4 |
| February | 3.3 | 4.2 |
| March | 6.2 | 6.4 |
| April | 10.5 | 10.9 |
| May | 10.1 | 10.4 |
| June | 7.2 | 7.2 |
| July | 6.5 | 6.3 |
| August | 6.3 | 6.4 |
| September | 5.0 | 5.5 |
| October | 5.6 | 5.4 |
| November | 5.1 | 4.9 |
| December | 5.4 | 5.5 |
| 2021 | ||
| January | 6.3 | 6.2 |
| February | 5.3 | 4.8 |
| March | 1.9 | 2.1 |
| April | -1.3 | -1.8 |
| May | -1.5 | -1.6 |
| June | 0.0 | -0.1 |
| July | 1.2 | 0.5 |
| August | 1.9 | 1.3 |
| September | 2.7 | 1.7 |
| October | 2.0 | 2.0 |
| November | 2.7 | 2.7 |
| December | 3.3 | 2.7 |
| 2022 | ||
| January | 2.7 | 2.4 |
| February | 2.7 | 3.1 |
| March | 3.2 | 3.4 |
| April | 3.3 | 3.3 |
| May | 3.7 | 3.9 |
| June | 5.0 | 5.2 |
| July | 4.4 | 5.2 |
| August | 4.9 | 5.4 |
| September | 4.9 | 5.2 |
| October | 5.3 | 5.6 |
| November | 5.8 | 5.6 |
| December | 4.8 | 5.1 |
| Source: Statistics Canada, Labour Force Survey (3701). | ||
4.0 Historical revision of seasonal adjustment factors
Each January, seasonally adjusted Labour Force Survey estimates for the previous three years are revised using the latest seasonal factors. In 2023, to account for updates in the data arising from the NOC classification and data processing enhancements, revised seasonal adjustment factors have been applied over a longer time span. For more information on seasonal adjustment, see Seasonally adjusted data – Frequently asked questions.
While microdata was revised back to 2006, seasonally adjusted and trend-cycle data for labour market indicators were revised for an additional four years, back to January 2002 and July 2001 respectively, to minimize the possibility of a break in the seasonally adjusted series.
5.0 Impact on labour market estimates
5.1 Impact on employment
Monthly seasonally adjusted employment levels were revised upward slightly (Chart 3-A), averaging 0.3% (+55,000) from 2006 to 2011; 0.7% (+121,000) from 2012 to 2019; and 0.6% (+120,000) from July 2021 to the end of 2022. The revision was essentially a level shift in employment. There was minimal difference in the year-over-year change in employment between the revised and unrevised levels (Chart 3-B).
For the period from March to May 2020, early in the COVID-19 pandemic, employment was revised down slightly (-63,000; -0.4%) as enhancements to the imputation system allowed for more efficient imputation for respondents experiencing job losses and temporary layoffs due to tight public health restrictions resulting in business closures. Between June 2020 and June 2021, the average revision to the number of employed was 0.3% (+64,000) higher than initially released.
The employment rate was also shifted upward on average (+0.3 percentage points) throughout the revision period of 2006 to 2022. However, the magnitude of differences was largely stable over time and did not impact the overall trend observed at the national level over the period. The maximum difference between the revised employment rate and the unrevised rate was +0.6 percentage points, which occurred at several points over the course of the revision: in December 2012 and January 2013; from July to December 2018; and August and September 2022. For example, in September 2022, the revised employment rate was 61.9% compared with the unrevised rate of 61.3%.
On average, the upward revision in employment was distributed proportionally across all provinces, leading to a non-statistically significant increase for each of them. For the period from 2006 to 2022, the average upward revision to employment ranged from +0.4% in Quebec to +0.8% in Nova Scotia and Newfoundland and Labrador.

Data table for Chart 3-A
| Revised | Unrevised | |
|---|---|---|
| thousands | ||
| 2002 | ||
| January | 15,019.4 | 15,018.4 |
| February | 15,042.3 | 15,038.7 |
| March | 15,120.5 | 15,114.2 |
| April | 15,167.8 | 15,165.9 |
| May | 15,222.2 | 15,221.8 |
| June | 15,284.3 | 15,278.9 |
| July | 15,324.2 | 15,327.9 |
| August | 15,406.9 | 15,412.5 |
| September | 15,405.2 | 15,415.9 |
| October | 15,419.1 | 15,422.1 |
| November | 15,467.2 | 15,474.6 |
| December | 15,524.7 | 15,522.9 |
| 2003 | ||
| January | 15,544.2 | 15,542.7 |
| February | 15,601.6 | 15,596.0 |
| March | 15,609.7 | 15,598.9 |
| April | 15,593.2 | 15,593.0 |
| May | 15,574.8 | 15,576.3 |
| June | 15,627.1 | 15,632.7 |
| July | 15,648.4 | 15,650.3 |
| August | 15,638.9 | 15,649.6 |
| September | 15,674.7 | 15,681.3 |
| October | 15,729.5 | 15,731.0 |
| November | 15,778.5 | 15,781.3 |
| December | 15,821.1 | 15,817.0 |
| 2004 | ||
| January | 15,819.7 | 15,819.0 |
| February | 15,826.9 | 15,834.5 |
| March | 15,836.3 | 15,846.8 |
| April | 15,882.7 | 15,885.9 |
| May | 15,900.9 | 15,906.5 |
| June | 15,923.9 | 15,924.5 |
| July | 15,937.6 | 15,936.3 |
| August | 15,945.4 | 15,933.6 |
| September | 15,978.9 | 15,977.0 |
| October | 15,989.6 | 15,986.9 |
| November | 16,008.3 | 16,003.5 |
| December | 16,022.8 | 16,016.7 |
| 2005 | ||
| January | 16,034.0 | 16,031.5 |
| February | 16,047.1 | 16,049.7 |
| March | 16,046.5 | 16,050.1 |
| April | 16,072.3 | 16,075.8 |
| May | 16,076.7 | 16,073.5 |
| June | 16,101.8 | 16,100.1 |
| July | 16,142.2 | 16,140.9 |
| August | 16,186.6 | 16,180.6 |
| September | 16,172.2 | 16,165.9 |
| October | 16,211.7 | 16,206.8 |
| November | 16,241.2 | 16,232.8 |
| December | 16,232.3 | 16,226.4 |
| 2006 | ||
| January | 16,261.0 | 16,218.5 |
| February | 16,292.2 | 16,249.2 |
| March | 16,347.3 | 16,300.2 |
| April | 16,383.5 | 16,333.0 |
| May | 16,450.4 | 16,408.9 |
| June | 16,432.5 | 16,398.1 |
| July | 16,440.4 | 16,406.3 |
| August | 16,435.7 | 16,405.8 |
| September | 16,468.0 | 16,422.3 |
| October | 16,487.5 | 16,441.0 |
| November | 16,487.5 | 16,447.8 |
| December | 16,549.6 | 16,513.8 |
| 2007 | ||
| January | 16,615.0 | 16,576.6 |
| February | 16,636.4 | 16,588.7 |
| March | 16,664.8 | 16,645.4 |
| April | 16,658.6 | 16,611.2 |
| May | 16,682.1 | 16,645.7 |
| June | 16,728.2 | 16,689.7 |
| July | 16,796.2 | 16,739.7 |
| August | 16,817.5 | 16,759.9 |
| September | 16,836.2 | 16,803.8 |
| October | 16,883.7 | 16,855.8 |
| November | 16,904.8 | 16,866.6 |
| December | 16,907.1 | 16,859.2 |
| 2008 | ||
| January | 16,941.7 | 16,910.9 |
| February | 16,972.8 | 16,940.0 |
| March | 16,964.3 | 16,922.9 |
| April | 16,973.7 | 16,939.7 |
| May | 16,987.9 | 16,952.8 |
| June | 16,992.0 | 16,939.6 |
| July | 16,979.5 | 16,927.3 |
| August | 16,997.9 | 16,958.5 |
| September | 17,027.8 | 17,006.6 |
| October | 17,076.7 | 17,049.2 |
| November | 16,979.0 | 16,955.4 |
| December | 16,966.5 | 16,925.9 |
| 2009 | ||
| January | 16,827.0 | 16,792.9 |
| February | 16,784.8 | 16,735.8 |
| March | 16,765.0 | 16,720.9 |
| April | 16,730.5 | 16,666.8 |
| May | 16,741.8 | 16,644.5 |
| June | 16,710.2 | 16,634.8 |
| July | 16,700.2 | 16,643.0 |
| August | 16,696.5 | 16,638.6 |
| September | 16,745.0 | 16,662.5 |
| October | 16,757.6 | 16,665.1 |
| November | 16,822.0 | 16,747.1 |
| December | 16,794.3 | 16,732.2 |
| 2010 | ||
| January | 16,824.3 | 16,758.7 |
| February | 16,821.6 | 16,779.8 |
| March | 16,869.0 | 16,799.2 |
| April | 16,926.4 | 16,872.6 |
| May | 16,948.9 | 16,898.0 |
| June | 17,022.8 | 16,956.7 |
| July | 17,032.2 | 16,970.2 |
| August | 17,064.5 | 16,984.0 |
| September | 17,057.8 | 16,939.0 |
| October | 17,046.4 | 16,965.2 |
| November | 17,088.3 | 16,995.4 |
| December | 17,116.9 | 17,040.5 |
| 2011 | ||
| January | 17,187.5 | 17,099.8 |
| February | 17,181.0 | 17,100.2 |
| March | 17,188.1 | 17,120.9 |
| April | 17,226.2 | 17,150.7 |
| May | 17,207.5 | 17,144.4 |
| June | 17,253.6 | 17,178.2 |
| July | 17,290.4 | 17,201.3 |
| August | 17,306.6 | 17,225.8 |
| September | 17,300.4 | 17,244.0 |
| October | 17,286.8 | 17,212.2 |
| November | 17,280.5 | 17,204.4 |
| December | 17,296.6 | 17,219.4 |
| 2012 | ||
| January | 17,304.1 | 17,201.7 |
| February | 17,291.4 | 17,197.7 |
| March | 17,382.8 | 17,274.8 |
| April | 17,467.2 | 17,370.0 |
| May | 17,454.0 | 17,354.3 |
| June | 17,453.9 | 17,374.7 |
| July | 17,479.4 | 17,366.9 |
| August | 17,527.6 | 17,404.8 |
| September | 17,577.5 | 17,451.2 |
| October | 17,585.1 | 17,446.6 |
| November | 17,614.2 | 17,459.5 |
| December | 17,662.3 | 17,489.5 |
| 2013 | ||
| January | 17,655.2 | 17,508.0 |
| February | 17,714.8 | 17,553.8 |
| March | 17,642.4 | 17,508.4 |
| April | 17,671.2 | 17,533.5 |
| May | 17,734.6 | 17,596.5 |
| June | 17,726.7 | 17,589.0 |
| July | 17,698.9 | 17,585.3 |
| August | 17,727.1 | 17,614.0 |
| September | 17,717.1 | 17,601.9 |
| October | 17,725.9 | 17,607.0 |
| November | 17,735.4 | 17,628.0 |
| December | 17,704.1 | 17,614.4 |
| 2014 | ||
| January | 17,721.0 | 17,629.0 |
| February | 17,719.7 | 17,637.4 |
| March | 17,737.1 | 17,638.4 |
| April | 17,727.6 | 17,629.1 |
| May | 17,730.7 | 17,618.0 |
| June | 17,761.2 | 17,634.1 |
| July | 17,815.2 | 17,688.8 |
| August | 17,771.8 | 17,663.0 |
| September | 17,798.5 | 17,705.9 |
| October | 17,825.5 | 17,736.7 |
| November | 17,826.7 | 17,740.4 |
| December | 17,860.2 | 17,713.9 |
| 2015 | ||
| January | 17,861.9 | 17,740.0 |
| February | 17,878.8 | 17,755.5 |
| March | 17,920.5 | 17,767.7 |
| April | 17,878.7 | 17,750.3 |
| May | 17,897.2 | 17,782.0 |
| June | 17,883.9 | 17,786.2 |
| July | 17,903.0 | 17,827.7 |
| August | 17,926.7 | 17,846.2 |
| September | 17,938.3 | 17,825.7 |
| October | 17,951.7 | 17,843.7 |
| November | 17,917.6 | 17,820.7 |
| December | 17,905.0 | 17,819.3 |
| 2016 | ||
| January | 17,899.2 | 17,819.1 |
| February | 17,929.6 | 17,824.7 |
| March | 17,934.7 | 17,861.6 |
| April | 17,964.0 | 17,873.2 |
| May | 17,992.7 | 17,874.6 |
| June | 18,000.4 | 17,890.3 |
| July | 17,988.4 | 17,870.2 |
| August | 18,046.1 | 17,924.2 |
| September | 18,070.3 | 17,972.0 |
| October | 18,096.6 | 18,015.8 |
| November | 18,114.2 | 18,013.4 |
| December | 18,141.2 | 18,050.8 |
| 2017 | ||
| January | 18,223.2 | 18,133.3 |
| February | 18,251.5 | 18,147.0 |
| March | 18,272.7 | 18,163.4 |
| April | 18,296.7 | 18,182.3 |
| May | 18,332.5 | 18,235.2 |
| June | 18,391.6 | 18,269.1 |
| July | 18,434.1 | 18,290.6 |
| August | 18,460.2 | 18,335.7 |
| September | 18,459.6 | 18,332.8 |
| October | 18,489.2 | 18,371.2 |
| November | 18,567.5 | 18,439.3 |
| December | 18,631.9 | 18,516.1 |
| 2018 | ||
| January | 18,594.9 | 18,435.9 |
| February | 18,585.0 | 18,459.0 |
| March | 18,642.0 | 18,515.4 |
| April | 18,638.3 | 18,501.4 |
| May | 18,641.5 | 18,492.4 |
| June | 18,692.8 | 18,539.4 |
| July | 18,773.1 | 18,605.7 |
| August | 18,725.7 | 18,552.2 |
| September | 18,802.7 | 18,619.2 |
| October | 18,821.3 | 18,630.9 |
| November | 18,897.2 | 18,741.1 |
| December | 18,932.4 | 18,741.0 |
| 2019 | ||
| January | 18,973.9 | 18,822.2 |
| February | 19,025.1 | 18,876.4 |
| March | 18,989.6 | 18,861.7 |
| April | 19,116.4 | 18,971.2 |
| May | 19,132.4 | 19,004.3 |
| June | 19,144.9 | 18,995.7 |
| July | 19,127.9 | 18,965.9 |
| August | 19,178.7 | 19,025.5 |
| September | 19,183.1 | 19,073.1 |
| October | 19,174.3 | 19,063.4 |
| November | 19,128.1 | 19,000.0 |
| December | 19,198.7 | 19,082.4 |
| 2020 | ||
| January | 19,226.1 | 19,116.5 |
| February | 19,223.4 | 19,143.6 |
| March | 18,075.0 | 18,131.4 |
| April | 16,083.6 | 16,145.8 |
| May | 16,395.4 | 16,467.2 |
| June | 17,431.2 | 17,397.7 |
| July | 17,847.6 | 17,801.8 |
| August | 18,072.9 | 17,993.7 |
| September | 18,501.4 | 18,377.7 |
| October | 18,566.1 | 18,467.7 |
| November | 18,602.5 | 18,516.3 |
| December | 18,539.8 | 18,493.4 |
| 2021 | ||
| January | 18,353.0 | 18,285.6 |
| February | 18,622.5 | 18,558.1 |
| March | 18,875.1 | 18,834.4 |
| April | 18,678.1 | 18,635.6 |
| May | 18,619.4 | 18,584.8 |
| June | 18,872.9 | 18,799.4 |
| July | 18,982.0 | 18,879.5 |
| August | 19,052.4 | 18,947.3 |
| September | 19,218.6 | 19,121.8 |
| October | 19,255.1 | 19,141.8 |
| November | 19,394.3 | 19,297.6 |
| December | 19,473.2 | 19,376.2 |
| 2022 | ||
| January | 19,286.0 | 19,176.1 |
| February | 19,643.8 | 19,512.7 |
| March | 19,663.3 | 19,585.2 |
| April | 19,716.2 | 19,600.5 |
| May | 19,747.9 | 19,640.3 |
| June | 19,702.8 | 19,597.1 |
| July | 19,731.1 | 19,566.5 |
| August | 19,706.3 | 19,526.8 |
| September | 19,718.1 | 19,547.9 |
| October | 19,786.4 | 19,656.2 |
| November | 19,813.1 | 19,666.3 |
| December | 19,882.3 | 19,770.3 |
| Source: Statistics Canada, Labour Force Survey (3701). | ||

Data table for Chart 3-B
| Revised | Unrevised | |
|---|---|---|
| year-over-year change in employment (%) | ||
| 2003 | ||
| January | 3.5 | 3.5 |
| February | 3.7 | 3.7 |
| March | 3.2 | 3.2 |
| April | 2.8 | 2.8 |
| May | 2.3 | 2.3 |
| June | 2.2 | 2.3 |
| July | 2.1 | 2.1 |
| August | 1.5 | 1.5 |
| September | 1.7 | 1.7 |
| October | 2.0 | 2.0 |
| November | 2.0 | 2.0 |
| December | 1.9 | 1.9 |
| 2004 | ||
| January | 1.8 | 1.8 |
| February | 1.4 | 1.5 |
| March | 1.5 | 1.6 |
| April | 1.9 | 1.9 |
| May | 2.1 | 2.1 |
| June | 1.9 | 1.9 |
| July | 1.8 | 1.8 |
| August | 2.0 | 1.8 |
| September | 1.9 | 1.9 |
| October | 1.7 | 1.6 |
| November | 1.5 | 1.4 |
| December | 1.3 | 1.3 |
| 2005 | ||
| January | 1.4 | 1.3 |
| February | 1.4 | 1.4 |
| March | 1.3 | 1.3 |
| April | 1.2 | 1.2 |
| May | 1.1 | 1.0 |
| June | 1.1 | 1.1 |
| July | 1.3 | 1.3 |
| August | 1.5 | 1.6 |
| September | 1.2 | 1.2 |
| October | 1.4 | 1.4 |
| November | 1.5 | 1.4 |
| December | 1.3 | 1.3 |
| 2006 | ||
| January | 1.4 | 1.2 |
| February | 1.5 | 1.2 |
| March | 1.9 | 1.6 |
| April | 1.9 | 1.6 |
| May | 2.3 | 2.1 |
| June | 2.1 | 1.9 |
| July | 1.8 | 1.6 |
| August | 1.5 | 1.4 |
| September | 1.8 | 1.6 |
| October | 1.7 | 1.4 |
| November | 1.5 | 1.3 |
| December | 2.0 | 1.8 |
| 2007 | ||
| January | 2.2 | 2.2 |
| February | 2.1 | 2.1 |
| March | 1.9 | 2.1 |
| April | 1.7 | 1.7 |
| May | 1.4 | 1.4 |
| June | 1.8 | 1.8 |
| July | 2.2 | 2.0 |
| August | 2.3 | 2.2 |
| September | 2.2 | 2.3 |
| October | 2.4 | 2.5 |
| November | 2.5 | 2.5 |
| December | 2.2 | 2.1 |
| 2008 | ||
| January | 2.0 | 2.0 |
| February | 2.0 | 2.1 |
| March | 1.8 | 1.7 |
| April | 1.9 | 2.0 |
| May | 1.8 | 1.8 |
| June | 1.6 | 1.5 |
| July | 1.1 | 1.1 |
| August | 1.1 | 1.2 |
| September | 1.1 | 1.2 |
| October | 1.1 | 1.1 |
| November | 0.4 | 0.5 |
| December | 0.4 | 0.4 |
| 2009 | ||
| January | -0.7 | -0.7 |
| February | -1.1 | -1.2 |
| March | -1.2 | -1.2 |
| April | -1.4 | -1.6 |
| May | -1.4 | -1.8 |
| June | -1.7 | -1.8 |
| July | -1.6 | -1.7 |
| August | -1.8 | -1.9 |
| September | -1.7 | -2.0 |
| October | -1.9 | -2.3 |
| November | -0.9 | -1.2 |
| December | -1.0 | -1.1 |
| 2010 | ||
| January | 0.0 | -0.2 |
| February | 0.2 | 0.3 |
| March | 0.6 | 0.5 |
| April | 1.2 | 1.2 |
| May | 1.2 | 1.5 |
| June | 1.9 | 1.9 |
| July | 2.0 | 2.0 |
| August | 2.2 | 2.1 |
| September | 1.9 | 1.7 |
| October | 1.7 | 1.8 |
| November | 1.6 | 1.5 |
| December | 1.9 | 1.8 |
| 2011 | ||
| January | 2.2 | 2.0 |
| February | 2.1 | 1.9 |
| March | 1.9 | 1.9 |
| April | 1.8 | 1.6 |
| May | 1.5 | 1.5 |
| June | 1.4 | 1.3 |
| July | 1.5 | 1.4 |
| August | 1.4 | 1.4 |
| September | 1.4 | 1.8 |
| October | 1.4 | 1.5 |
| November | 1.1 | 1.2 |
| December | 1.0 | 1.0 |
| 2012 | ||
| January | 0.7 | 0.6 |
| February | 0.6 | 0.6 |
| March | 1.1 | 0.9 |
| April | 1.4 | 1.3 |
| May | 1.4 | 1.2 |
| June | 1.2 | 1.1 |
| July | 1.1 | 1.0 |
| August | 1.3 | 1.0 |
| September | 1.6 | 1.2 |
| October | 1.7 | 1.4 |
| November | 1.9 | 1.5 |
| December | 2.1 | 1.6 |
| 2013 | ||
| January | 2.0 | 1.8 |
| February | 2.4 | 2.1 |
| March | 1.5 | 1.4 |
| April | 1.2 | 0.9 |
| May | 1.6 | 1.4 |
| June | 1.6 | 1.2 |
| July | 1.3 | 1.3 |
| August | 1.1 | 1.2 |
| September | 0.8 | 0.9 |
| October | 0.8 | 0.9 |
| November | 0.7 | 1.0 |
| December | 0.2 | 0.7 |
| 2014 | ||
| January | 0.4 | 0.7 |
| February | 0.0 | 0.5 |
| March | 0.5 | 0.7 |
| April | 0.3 | 0.5 |
| May | 0.0 | 0.1 |
| June | 0.2 | 0.3 |
| July | 0.7 | 0.6 |
| August | 0.3 | 0.3 |
| September | 0.5 | 0.6 |
| October | 0.6 | 0.7 |
| November | 0.5 | 0.6 |
| December | 0.9 | 0.6 |
| 2015 | ||
| January | 0.8 | 0.6 |
| February | 0.9 | 0.7 |
| March | 1.0 | 0.7 |
| April | 0.9 | 0.7 |
| May | 0.9 | 0.9 |
| June | 0.7 | 0.9 |
| July | 0.5 | 0.8 |
| August | 0.9 | 1.0 |
| September | 0.8 | 0.7 |
| October | 0.7 | 0.6 |
| November | 0.5 | 0.5 |
| December | 0.3 | 0.6 |
| 2016 | ||
| January | 0.2 | 0.4 |
| February | 0.3 | 0.4 |
| March | 0.1 | 0.5 |
| April | 0.5 | 0.7 |
| May | 0.5 | 0.5 |
| June | 0.7 | 0.6 |
| July | 0.5 | 0.2 |
| August | 0.7 | 0.4 |
| September | 0.7 | 0.8 |
| October | 0.8 | 1.0 |
| November | 1.1 | 1.1 |
| December | 1.3 | 1.3 |
| 2017 | ||
| January | 1.8 | 1.8 |
| February | 1.8 | 1.8 |
| March | 1.9 | 1.7 |
| April | 1.9 | 1.7 |
| May | 1.9 | 2.0 |
| June | 2.2 | 2.1 |
| July | 2.5 | 2.4 |
| August | 2.3 | 2.3 |
| September | 2.2 | 2.0 |
| October | 2.2 | 2.0 |
| November | 2.5 | 2.4 |
| December | 2.7 | 2.6 |
| 2018 | ||
| January | 2.0 | 1.7 |
| February | 1.8 | 1.7 |
| March | 2.0 | 1.9 |
| April | 1.9 | 1.8 |
| May | 1.7 | 1.4 |
| June | 1.6 | 1.5 |
| July | 1.8 | 1.7 |
| August | 1.4 | 1.2 |
| September | 1.9 | 1.6 |
| October | 1.8 | 1.4 |
| November | 1.8 | 1.6 |
| December | 1.6 | 1.2 |
| 2019 | ||
| January | 2.0 | 2.1 |
| February | 2.4 | 2.3 |
| March | 1.9 | 1.9 |
| April | 2.6 | 2.5 |
| May | 2.6 | 2.8 |
| June | 2.4 | 2.5 |
| July | 1.9 | 1.9 |
| August | 2.4 | 2.6 |
| September | 2.0 | 2.4 |
| October | 1.9 | 2.3 |
| November | 1.2 | 1.4 |
| December | 1.4 | 1.8 |
| 2020 | ||
| January | 1.3 | 1.6 |
| February | 1.0 | 1.4 |
| March | -4.8 | -3.9 |
| April | -15.9 | -14.9 |
| May | -14.3 | -13.4 |
| June | -9.0 | -8.4 |
| July | -6.7 | -6.1 |
| August | -5.8 | -5.4 |
| September | -3.6 | -3.6 |
| October | -3.2 | -3.1 |
| November | -2.7 | -2.5 |
| December | -3.4 | -3.1 |
| 2021 | ||
| January | -4.5 | -4.3 |
| February | -3.1 | -3.1 |
| March | 4.4 | 3.9 |
| April | 16.1 | 15.4 |
| May | 13.6 | 12.9 |
| June | 8.3 | 8.1 |
| July | 6.4 | 6.1 |
| August | 5.4 | 5.3 |
| September | 3.9 | 4.0 |
| October | 3.7 | 3.7 |
| November | 4.3 | 4.2 |
| December | 5.0 | 4.8 |
| 2022 | ||
| January | 5.1 | 4.9 |
| February | 5.5 | 5.1 |
| March | 4.2 | 4.0 |
| April | 5.6 | 5.2 |
| May | 6.1 | 5.7 |
| June | 4.4 | 4.2 |
| July | 3.9 | 3.6 |
| August | 3.4 | 3.1 |
| September | 2.6 | 2.2 |
| October | 2.8 | 2.7 |
| November | 2.2 | 1.9 |
| December | 2.1 | 2.0 |
| Source: Statistics Canada, Labour Force Survey (3701). | ||
5.2 Impact on unemployment
On average, unemployment levels were revised upward slightly, particularly over the period from 2006 to 2014 (+21,000; +1.6%). Unemployment rates were little changed on average between the revised and unrevised estimates (Chart 3-C).
During the early part of the pandemic, from March to May 2020, unemployment was revised upward an average of 5.4% (+116,000), increasing the peak unemployment rate observed in May 2020 by 0.7 percentage points to 14.1%. This was caused by enhancements to the imputation system allowing for more efficient imputation for respondents experiencing job losses and temporary layoffs due to tight public health restrictions.
To mitigate misclassification of labour force status in the early months of the pandemic, several survey procedures – including thorough training and supervision of interviewers, and clear instructions to online respondents – were put in place given the ambiguity in the mind of respondents who were absent from work as to whether their job (employer-employee relationship) or self-employment business was still in place, and the possible ambiguity over the concepts of “looking for work” and “availability to work.”
Outside of the larger changes in March to May 2020, the unemployment rate changed by a maximum of 0.2 percentage points at several points during the revision period, most recently in October 2021, from 6.8% to 6.6%. The revised national unemployment rate in December 2022 was unchanged from the unrevised rate at 5.0%.
As with employment, changes in the unemployment rate were observed uniformly across all provinces.

Data table for Chart 3-C
| Revised | Unrevised | |
|---|---|---|
| percent | ||
| 2002 | ||
| January | 8.0 | 8.0 |
| February | 7.9 | 8.0 |
| March | 7.9 | 7.9 |
| April | 7.7 | 7.7 |
| May | 7.8 | 7.8 |
| June | 7.6 | 7.6 |
| July | 7.6 | 7.6 |
| August | 7.4 | 7.4 |
| September | 7.6 | 7.5 |
| October | 7.6 | 7.6 |
| November | 7.5 | 7.4 |
| December | 7.6 | 7.5 |
| 2003 | ||
| January | 7.5 | 7.5 |
| February | 7.5 | 7.5 |
| March | 7.4 | 7.4 |
| April | 7.6 | 7.6 |
| May | 7.8 | 7.8 |
| June | 7.6 | 7.6 |
| July | 7.7 | 7.7 |
| August | 7.8 | 7.8 |
| September | 7.9 | 7.8 |
| October | 7.6 | 7.6 |
| November | 7.4 | 7.4 |
| December | 7.3 | 7.3 |
| 2004 | ||
| January | 7.3 | 7.3 |
| February | 7.3 | 7.3 |
| March | 7.3 | 7.3 |
| April | 7.2 | 7.2 |
| May | 7.1 | 7.1 |
| June | 7.2 | 7.2 |
| July | 7.1 | 7.1 |
| August | 7.0 | 7.0 |
| September | 6.9 | 6.9 |
| October | 7.1 | 7.1 |
| November | 7.2 | 7.2 |
| December | 7.1 | 7.1 |
| 2005 | ||
| January | 6.9 | 7.0 |
| February | 7.0 | 7.0 |
| March | 6.9 | 6.9 |
| April | 6.7 | 6.7 |
| May | 7.0 | 7.0 |
| June | 6.8 | 6.8 |
| July | 6.7 | 6.7 |
| August | 6.7 | 6.7 |
| September | 6.7 | 6.7 |
| October | 6.7 | 6.7 |
| November | 6.3 | 6.4 |
| December | 6.6 | 6.6 |
| 2006 | ||
| January | 6.7 | 6.6 |
| February | 6.6 | 6.4 |
| March | 6.5 | 6.4 |
| April | 6.5 | 6.3 |
| May | 6.2 | 6.1 |
| June | 6.3 | 6.1 |
| July | 6.5 | 6.4 |
| August | 6.5 | 6.4 |
| September | 6.5 | 6.4 |
| October | 6.3 | 6.2 |
| November | 6.5 | 6.4 |
| December | 6.3 | 6.2 |
| 2007 | ||
| January | 6.4 | 6.3 |
| February | 6.3 | 6.2 |
| March | 6.3 | 6.2 |
| April | 6.3 | 6.2 |
| May | 6.2 | 6.0 |
| June | 6.1 | 6.1 |
| July | 6.0 | 6.0 |
| August | 6.0 | 5.9 |
| September | 6.0 | 5.9 |
| October | 6.0 | 5.9 |
| November | 6.1 | 6.1 |
| December | 6.2 | 6.1 |
| 2008 | ||
| January | 6.1 | 5.9 |
| February | 6.1 | 6.0 |
| March | 6.2 | 6.2 |
| April | 6.2 | 6.1 |
| May | 6.2 | 6.1 |
| June | 6.1 | 6.1 |
| July | 6.2 | 6.1 |
| August | 6.2 | 6.1 |
| September | 6.3 | 6.1 |
| October | 6.4 | 6.2 |
| November | 6.7 | 6.6 |
| December | 7.0 | 6.9 |
| 2009 | ||
| January | 7.5 | 7.4 |
| February | 8.1 | 8.0 |
| March | 8.3 | 8.2 |
| April | 8.4 | 8.3 |
| May | 8.6 | 8.7 |
| June | 8.8 | 8.7 |
| July | 8.8 | 8.7 |
| August | 8.8 | 8.6 |
| September | 8.5 | 8.4 |
| October | 8.5 | 8.5 |
| November | 8.6 | 8.5 |
| December | 8.6 | 8.5 |
| 2010 | ||
| January | 8.4 | 8.3 |
| February | 8.4 | 8.3 |
| March | 8.3 | 8.3 |
| April | 8.2 | 8.2 |
| May | 8.1 | 8.1 |
| June | 8.0 | 8.0 |
| July | 8.2 | 8.0 |
| August | 8.2 | 8.1 |
| September | 8.2 | 8.2 |
| October | 8.1 | 8.0 |
| November | 7.8 | 7.7 |
| December | 7.8 | 7.7 |
| 2011 | ||
| January | 7.8 | 7.8 |
| February | 7.8 | 7.7 |
| March | 7.8 | 7.7 |
| April | 7.8 | 7.7 |
| May | 7.7 | 7.6 |
| June | 7.7 | 7.6 |
| July | 7.4 | 7.3 |
| August | 7.4 | 7.3 |
| September | 7.4 | 7.4 |
| October | 7.5 | 7.4 |
| November | 7.6 | 7.6 |
| December | 7.5 | 7.5 |
| 2012 | ||
| January | 7.7 | 7.7 |
| February | 7.6 | 7.5 |
| March | 7.3 | 7.3 |
| April | 7.4 | 7.3 |
| May | 7.5 | 7.4 |
| June | 7.4 | 7.2 |
| July | 7.3 | 7.3 |
| August | 7.4 | 7.3 |
| September | 7.4 | 7.3 |
| October | 7.4 | 7.5 |
| November | 7.3 | 7.4 |
| December | 7.2 | 7.3 |
| 2013 | ||
| January | 7.1 | 7.1 |
| February | 7.0 | 7.1 |
| March | 7.3 | 7.3 |
| April | 7.2 | 7.2 |
| May | 7.0 | 7.0 |
| June | 7.2 | 7.2 |
| July | 7.3 | 7.1 |
| August | 7.2 | 7.1 |
| September | 7.1 | 7.1 |
| October | 7.2 | 7.1 |
| November | 7.1 | 7.0 |
| December | 7.4 | 7.3 |
| 2014 | ||
| January | 7.2 | 7.1 |
| February | 7.2 | 7.1 |
| March | 7.1 | 7.0 |
| April | 7.1 | 7.1 |
| May | 7.3 | 7.1 |
| June | 7.1 | 7.1 |
| July | 7.1 | 7.1 |
| August | 7.0 | 7.0 |
| September | 7.0 | 6.9 |
| October | 6.8 | 6.7 |
| November | 6.8 | 6.7 |
| December | 6.7 | 6.7 |
| 2015 | ||
| January | 6.8 | 6.7 |
| February | 6.9 | 6.8 |
| March | 6.8 | 6.9 |
| April | 6.9 | 6.9 |
| May | 6.8 | 6.9 |
| June | 6.9 | 6.9 |
| July | 6.9 | 6.9 |
| August | 7.0 | 7.0 |
| September | 7.1 | 7.1 |
| October | 7.0 | 6.9 |
| November | 7.1 | 7.1 |
| December | 7.2 | 7.2 |
| 2016 | ||
| January | 7.3 | 7.2 |
| February | 7.3 | 7.3 |
| March | 7.2 | 7.1 |
| April | 7.3 | 7.2 |
| May | 7.0 | 7.0 |
| June | 6.9 | 6.9 |
| July | 6.9 | 7.0 |
| August | 6.9 | 7.0 |
| September | 7.0 | 7.0 |
| October | 6.9 | 7.0 |
| November | 6.8 | 6.9 |
| December | 6.9 | 7.0 |
| 2017 | ||
| January | 6.8 | 6.8 |
| February | 6.6 | 6.6 |
| March | 6.7 | 6.7 |
| April | 6.5 | 6.5 |
| May | 6.6 | 6.6 |
| June | 6.5 | 6.5 |
| July | 6.3 | 6.3 |
| August | 6.2 | 6.2 |
| September | 6.2 | 6.2 |
| October | 6.4 | 6.3 |
| November | 6.1 | 6.0 |
| December | 6.0 | 5.9 |
| 2018 | ||
| January | 5.9 | 6.0 |
| February | 6.0 | 5.9 |
| March | 5.8 | 5.9 |
| April | 5.8 | 5.9 |
| May | 5.9 | 6.0 |
| June | 6.0 | 6.1 |
| July | 5.9 | 5.8 |
| August | 6.0 | 6.0 |
| September | 5.8 | 5.9 |
| October | 5.7 | 5.9 |
| November | 5.7 | 5.7 |
| December | 5.7 | 5.8 |
| 2019 | ||
| January | 5.7 | 5.9 |
| February | 5.8 | 5.9 |
| March | 5.9 | 5.8 |
| April | 5.7 | 5.8 |
| May | 5.4 | 5.4 |
| June | 5.6 | 5.5 |
| July | 5.8 | 5.8 |
| August | 5.8 | 5.8 |
| September | 5.6 | 5.6 |
| October | 5.6 | 5.7 |
| November | 5.9 | 6.0 |
| December | 5.6 | 5.8 |
| 2020 | ||
| January | 5.5 | 5.6 |
| February | 5.7 | 5.7 |
| March | 8.4 | 7.9 |
| April | 13.6 | 13.0 |
| May | 14.1 | 13.4 |
| June | 12.4 | 12.2 |
| July | 11.0 | 10.9 |
| August | 10.2 | 10.3 |
| September | 9.2 | 9.2 |
| October | 9.0 | 9.2 |
| November | 8.7 | 8.7 |
| December | 8.9 | 8.9 |
| 2021 | ||
| January | 9.2 | 9.4 |
| February | 8.5 | 8.3 |
| March | 7.6 | 7.5 |
| April | 8.2 | 8.0 |
| May | 8.2 | 8.0 |
| June | 7.8 | 7.6 |
| July | 7.5 | 7.4 |
| August | 7.2 | 7.1 |
| September | 7.1 | 7.0 |
| October | 6.6 | 6.8 |
| November | 6.2 | 6.1 |
| December | 6.0 | 6.0 |
| 2022 | ||
| January | 6.5 | 6.5 |
| February | 5.4 | 5.5 |
| March | 5.3 | 5.3 |
| April | 5.3 | 5.2 |
| May | 5.2 | 5.1 |
| June | 4.9 | 4.9 |
| July | 4.9 | 4.9 |
| August | 5.3 | 5.4 |
| September | 5.2 | 5.2 |
| October | 5.2 | 5.2 |
| November | 5.1 | 5.1 |
| December | 5.0 | 5.0 |
| Source: Statistics Canada, Labour Force Survey (3701). | ||
5.3 Impact on labour force participation
The size of the labour force was revised upward, by an average of 0.4% (+77,000) from 2006 to 2011; +0.7% (+131,000) from 2012 to 2019; and +0.6% (+126,000) from July 2021 to the end of 2022, as a result of similar revisions to employment.
Throughout most of the revision period, the participation rate was on average 0.4 percentage points higher. The largest change, +0.6 percentage points, occurred at several points over the course of the revision period, including from November 2012 to April 2013; May 2014; from July to December 2018; as well as July and August 2022. In August 2022, the revised participation rate was 65.4%, compared with the unrevised rate of 64.8%.
Of the three main labour market indicators (employment, unemployment and participation rates), the participation rate was impacted the least by the initial shock of tight public health restrictions to the labour market in March to May 2020. In fact, during the early part of the COVID-19 pandemic, the average revision to the labour force (+52,000; +0.3%) and the participation rate (+0.2 percentage points) were smaller than during the rest of the revision period from 2006 to 2022.
Appendix A: Variant of the National Occupation Classification (NOC) 2021 for the labour force
| Codes | Occupation |
|---|---|
| 00, 10, 20, 30, 40, 50, 60, 70, 80, 90 | Management occupations |
| 00 | Legislative and senior management occupations |
| 10, 20, 30, 40, 50 | Specialized middle management occupations |
| 60 | Middle management occupations in retail and wholesale trade and customer services |
| 70, 80, 90 | Middle management occupations in trades, transportation, production and utilities |
| 11-14 | Business, finance and administration occupations, except management |
| 11 | Professional occupations in finance and business |
| 111 | Professional occupations in finance |
| 112 | Professional occupations in business |
| 12 | Administrative and financial supervisors and specialized administrative occupations |
| 13 | Administrative occupations and transportation logistics occupations |
| 14 | Administrative and financial support and supply chain logistics occupations |
| 21-22 | Natural and applied sciences and related occupations, except management |
| 21 | Professional occupations in natural and applied sciences |
| 211 | Professional occupations in natural sciences |
| 212 | Professional occupations in applied sciences (except engineering) |
| 213 | Professional occupations in engineering |
| 22 | Technical occupations related to natural and applied sciences |
| 31-33 | Health occupations, except management |
| 31 | Professional occupations in health |
| 311 | Health treating and consultation services professionals |
| 312 | Therapy and assessment professionals |
| 313 | Nursing and allied health professionals |
| 32 | Technical occupations in health |
| 33 | Assisting occupations in support of health services |
| 41-45 | Occupations in education, law and social, community and government services, except management |
| 41 | Professional occupations in law, education, social, community and government services |
| 411 | Professional occupations in law |
| 412 | Professional occupations in education services |
| 413 | Professional occupations in social and community services |
| 414 | Professional occupations in government services |
| 42 | Front-line public protection services and paraprofessional occupations in legal, social, community, education services |
| 421 | Occupations in front-line public protection services |
| 422 | Paraprofessional occupations in legal, social, community and education services |
| 43 | Assisting occupations in education and in legal and public protection |
| 44-45 | Care providers and public protection support occupations and student monitors, crossing guards and related occupations |
| 51-55 | Occupations in art, culture, recreation and sport, except management |
| 51 | Professional occupations in art and culture |
| 52 | Technical occupations in art, culture and sport |
| 53 | Occupations in art, culture and sport |
| 54-55 | Support occupations in art, culture and sport |
| 62-65 | Sales and service occupations, except management |
| 62 | Retail sales and service supervisors and specialized occupations in sales and services |
| 63 | Occupations in sales and services |
| 64 | Sales and service representatives and other customer and personal services occupations |
| 65 | Sales and service support occupations |
| 72-75 | Trades, transport and equipment operators and related occupations, except management |
| 72 | Technical trades and transportation officers and controllers |
| 73 | General trades |
| 74 | Mail and message distribution, other transport equipment operators and related maintenance workers |
| 75 | Helpers and labourers and other transport drivers, operators and labourers |
| 82-85 | Natural resources, agriculture and related production occupations, except management |
| 82-83 | Supervisors and occupations in natural resources, agriculture and related production |
| 84-85 | Workers and labourers in natural resources, agriculture and related production |
| 92-95 | Occupations in manufacturing and utilities, except management |
| 92-93 | Supervisors, central control and process operators in processing, manufacturing and utilities and aircraft assemblers and inspectors |
| 94 | Machine operators, assemblers and inspectors in processing, manufacturing and printing |
| 95 | Labourers in processing, manufacturing and utilities |
Appendix B: Concordance between previous and new data tables for occupation
| Previous table number | New table number | Table title |
|---|---|---|
| 14100299 | 14100408 | Usual hours worked by occupation, annual |
| 14100301 | 14100409 | Actual hours worked by occupation, annual |
| 14100303 | 14100410 | Multiple jobholders by occupation, annual |
| 14100305 | 14100411 | Job tenure by occupation, annual |
| 14100309 | 14100412 | Employees working overtime (weekly) by occupation, annual |
| 14100316 | 14100413 | Weekly wage distributions by occupation, annual |
| 14100318 | 14100414 | Hourly wage distributions by occupation, annual |
| 14100319 | 14100415 | Union status by occupation, annual |
| 14100335 | 14100416 | Labour force characteristics by occupation, annual |
| 14100340 | 14100417 | Employee wages by occupation, annual |
| 14100370 | 14100418 | Average hourly and weekly wages and average usual weekly hours by Indigenous group |
| 14100382 | 14100419 | Employment by occupation, census metropolitan areas , annual |
| 14100389 | 14100420 | Employment by occupation, economic regions, annual |
| 14100296 | 14100421 | Labour force characteristics by occupation, monthly, unadjusted for seasonality |
| 14100298 | 14100422 | Usual hours worked by occupation, monthly, unadjusted for seasonality |
| 14100300 | 14100423 | Actual hours worked by occupation, monthly, unadjusted for seasonality |
| 14100302 | 14100424 | Multiple jobholders by occupation, monthly, unadjusted for seasonality |
| 14100304 | 14100425 | Job tenure by occupation, monthly, unadjusted for seasonality |
| 14100306 | 14100426 | Employee wages by occupation, monthly, unadjusted for seasonality |
| 14100308 | 14100427 | Employees working overtime (weekly) by occupation, monthly, unadjusted for seasonality |
| 14100315 | 14100428 | Weekly wage distributions by occupation, monthly, unadjusted for seasonality |
| 14100317 | 14100429 | Hourly wage distributions by occupation, monthly, unadjusted for seasonality |
| 14100381 | 14100430 | Employment by occupation, census metropolitan areas, three-month moving average, unadjusted for seasonality |
| 14100386 | 14100431 | Employment by occupation, economic regions, three-month moving average, unadjusted for seasonality |
| 14100285 | 14100437 | Work absence of full-time employees by occupation, annual |
| Source: Statistics Canada, Labour Force Survey. | ||
- Date modified: