
Transition of Labour Force Survey Data Processing to the Social Survey Processing Environment (SSPE)

Archived Content
Information identified as archived is provided for reference, research or recordkeeping purposes. It is not subject to the Government of Canada Web Standards and has not been altered or updated since it was archived. Please "contact us" to request a format other than those available.
Overview of LFS processing
Each month, the production of statistics from the Labour Force Survey (LFS) involves three broad sets of activities: 1) data collection, during which interviews are conducted with approximately 50,000 households over a 10-day period, 2) data processing, during which data are verified and corrected when required to produce microdata files, and 3) the production of statistical tables and analytical products, during which products including The Daily are prepared and loaded to the Statistics Canada website within 10 days after the end of collection.
LFS data processing consists of several steps. Some of these are carried out on a daily basis, concurrently with data collection, while others are done once per month, on the day after the completion of data collection. The daily steps include:
- Receipt of data from collection.
- Coding of responses to questions with “Other – specify” answer categories.
- Editing of demographic data (age, sex, family relationships) to ensure validity and consistency.
- Imputation of educational data.
- Editing of labour force data.
- Coding of industry and occupation responses.
Once collection is complete, the following monthly processing steps are carried out:
- Imputation of remaining demographic data.
- Imputation of labour force data.
- Calculation of derived variables.
- Weighting and variance estimation.
Imputation is the replacement of missing data with plausible values. When individual data items are missing, an effort is made to find a suitable donor. Donors are records that are judged similar based on a series of characteristics, and that have valid and consistent data that could be used to reasonably replace the recipient record’s missing value. If a suitable donor cannot be found, a larger block of the recipient’s data may be stricken out and replaced with a donor’s block of data; for this ‘whole-record imputation’, the criteria of similarity is typically relaxed until the best possible donor is found.
LFS processing systems
The computer system currently involved in LFS data processing—known as the Head Office Processing System (HOPS)—has been in place for more than 25 years. During this time, a number of modifications have been introduced and the system has been maintained to ensure the continued accuracy and robustness of LFS production. Beginning in January 2019, LFS processing will be transitioned from HOPS to the Social Survey Processing Environment (SSPE), a generalized survey data processing system used by a number of other Statistics Canada surveys. This transition of LFS data processing to SSPE offers a number of advantages:
- Whereas the design of HOPS is relatively complex and integrated, with changes in one step having potential impacts on others, SSPE allows for a flexible and modular approach to LFS processing, with individual steps being easier to isolate, analyse and enhance as required.
- While HOPS is used only by LFS, SSPE is used by most of Statistics Canada’s social surveys and experience in data processing using SSPE is relatively broad. As a result, transition to SSPE reduces LFS reliance on system-specific and person-specific knowledge, thereby reducing risks related to staff retention and turnover.
- Because SSPE is by design integrated with other generalized systems—including the Canadian Census Edit and Imputation System (CANCEIS) for imputation and the Common Coding Environment (CCE) for coding—overall resources required for systems development and maintenance are reduced.
Development and testing of LFS processing using SSPE
The project to transition LFS data processing began in April 2015. The major phases of the project included:
- Designing ‘processing maps’ for daily and monthly LFS processing. Within the SSPE generalized environment, a generic set of instructions is available for each step in data processing (for example, receiving data from the collection systems into the processing system). For each of these steps, survey-specific instructions and rules must be developed and a set of steps or a ‘map’ must be designed to determine and manage the sequencing and execution of steps.
- Modular testing of each processing step, to ensure that at each processing step, data was input, modified or transformed, and output as expected.
- Integrated testing, to evaluate the cumulative impact of all processing steps on LFS estimates.
- Operational readiness testing, to ensure that LFS data processing could be completed within existing time and resource constraints; for example, that each morning of daily processing, data could be received from collection and transferred to the group responsible for industry and occupation coding within an acceptable timeframe.
Design of LFS processing map
The LFS has a very high standard for data quality, and unique editing challenges and opportunities exist since respondents are interviewed for six months in a row. For example, in cases where a sampled household responds to LFS in a given month and is a non-respondent the following month, data from the first month may, if specific conditions are satisfied, be used to complete the missing data in the second month.
In designing the SSPE processing maps, every effort was made to retain these underlying conditions and rules, or processing methodology, thereby minimising the impact of the transition on the quality of LFS data and the level of LFS estimates. In some situations, opportunities existed to streamline or improve the underlying methodology without affecting LFS estimates (for example, the replacement of some manual editing of records with deterministic edit rules) while in others is was necessary to slightly modify some aspects of the methodology (for example, the specific conditions under which a partial record as opposed to an entire record is corrected through imputation).
Modular testing of LFS processing steps
Each step in the SSPE daily and monthly processes map was developed and tested in a modular fashion. The objective of modular testing was to ensure that each for each step data was input, transformed and output according to specifications.
The LFS Redesign team conducted modular testing from April 2016 to April 2017. During this period, each module was tested independently and validated against specification documentation. After the success of the modular testing, approval was granted to begin fully integrated testing in May 2017.
Integrated testing of LFS processing maps
The primary objective of integrated testing was to generate test data by running all processing steps in sequence and then evaluating whether transitioning LFS processing would introduce any discontinuities in LFS time series. Doing so involved overcoming a number of operational challenges, including:
- Comparing a given month of LFS estimates using two processing systems (HOPS and SSPE) involves a non-negligible investment of time to copy and configure large datasets and to then execute a large number of sequential processing steps. It was necessary to develop test strategies which made efficient use of the time available.
- Some daily LFS processing steps—notably coding of “Other – specify” responses, manual correction of demographic data and manual coding of industry and occupation responses—are manual processes which: 1) involve significant human input and decision-making each month, and 2) have a non-negligible impact on LFS estimates. It was necessary to develop test strategies which included an evaluation of the impact of changing the systems used to execute these steps while respecting time and resource constraints.
- Under some conditions some information (such as industry and occupation of employment) is collected in the first month that a household is interviewed and is carried forward to subsequent months. The impact of SSPE transition therefore had to be evaluated both in terms of its impact on the first month post-transition and on possible impacts in the months following transition.
- Many key LFS estimates are seasonally adjusted to permit analyses controlling for the impact of large seasonal variations. It was necessary to develop approaches to evaluate not only the short-term impact of transition to SSPE but the long-term impact on seasonal patterns.
To overcome these challenges, a combination of types of integrated testing were completed, including:
- Multi-year testing, in which more than nine years of data (January 2008 to May 2017) were produced by using outputs of HOPS daily processing as inputs to the monthly SSPE processing map. This was evaluated as being an efficient and effective means of evaluating the impact of SSPE transition on:
- the imputation of labour force information
- long-term seasonal patterns.
- Key findings from this testing included:
- During initial testing, some differences in the level of some LFS estimates were observed. This resulted in further examination and adjustment of imputation parameters. Testing following these changes indicated no unacceptable impact on estimates. More detail on this matter is presented in the “Results and analysis” section of this document.
- No impact of transition month (data were produced using various transition months and carried forward for six months each; there was no evidence that SSPE behaved differently depending on the starting month).
- No impact on seasonal patterns.
- Multi-month testing – Phase 1, in which data were produced by executing both the daily and monthly SSPE processing maps, with the exception of steps involving manual inputs or human decision-making. For these steps, inputs and outputs were simulated using HOPS values. Twenty consecutive months of data (from January 2016 to August 2017) were produced (data produced in winter 2018).
- Key findings from this testing included:
- Some differences in HOPS and SSPE estimates of wages. This led to examination of causes of these differences and adjustments to editing and imputation parameters.
- Differences between estimates obtained using SSPE and those obtained using HOPS were acceptable.
- Differences between SSPE and HOPS were not systematically positive or negative and did not exhibit a pattern, indicating that transition to SSPE does not introduce bias.
- No impact on the sampling variances associated with LFS estimates.
- Multi-month testing – Phase 2, in which data were produced in the same way as Multi-month Testing - Phase 1 but with adjustments made to editing and imputation parameters affecting the estimation of wages. Nine consecutive months of data (October 2017 to April 2018) were produced in summer 2018.
- Key findings from this testing included:
- No significant differences in wage estimates produced by HOPS and SSPE.
- No change in the impact associated with SSPE transition introduced by a change in transition date.
- Fully-integrated testing, in which data were produced by executing both the daily and monthly SSPE processing maps, including steps involving manual inputs or human decision-making.
- The first of these tests was conducted in the summer of 2017 and produced data for three months (March 2017 to May 2017). The primary objective of this testing was to test the flow of data through all steps in the daily and monthly processing maps. Testing led to identification of a number of areas where refinements and enhancements were required.
- A second round of fully-integrated testing was completed in the summer of 2018. Four separate months of LFS data were processed using the full SSPE daily and monthly processing maps, with the exception of industry and occupation, with approximately half of records being coded using SSPE and the remainder being simulated using HOPS data. Whereas in multi-month testing a single transition month was simulated and SSPE data were used in subsequent months, in each of the four months of fully-integrated testing, the first month of SSPE was simulated.
- Key findings of this second round of fully-integrated testing included:
- Differences in estimates obtained using HOPS and SSPE were acceptable (further details are presented in the “Results and analysis” section).
- Consistency in the impact of SSPE transition across the 4 months.
Operational readiness testing
The fully-integrated testing conducted in the summer of 2018 also served as an operational readiness test, to evaluate whether, from an operational point of view, LFS data processing could be transitioned to SSPE without jeopardising the timeliness or robustness of the LFS production process. Specific criteria were evaluated including the adequacy of documentation and procedures manuals, the training of staff to execute LFS processing using SSPE, and the stability and performance of IT infrastructure.
This testing revealed that all conditions were satisfied and that from an operational point of view LFS data processing could be transitioned to SSPE beginning in January 2019.
Results and analysis
Using the data from the various types of integrated testing, the impact of transitioning LFS processing to SSPE on the following was evaluated:
- For a given month, estimates of levels (e.g., total number of self-employed persons) and of rates (e.g., unemployment rate);
- Estimates of month-to-month changes;
- Estimates of year-over-year changes;
- Seasonally adjusted time series;
- Measures of the precision of estimates.
Some estimates, like the unemployment rate and the total number of employed persons, are considered key estimates and were therefore scrutinized in greater detail. Their results were compared at more disaggregated levels, based on key analytical domains. The list of key estimates, as well as the list of key domains, are provided in “Appendix A”.
The results presented here are typical of the very large number of analyses that were carried out (see “Appendix A” for a list of key estimates and domains). Figure 1 shows the number of self-employed persons in Manitoba from January 2008 to May 2017. This data series is based on Multi-year testing (where the main goal was to evaluate the impact of SSPE transition on the imputation of labour force information). The estimates have not been seasonally adjusted. The solid black line represents the HOPS estimates, and the dashed black lines represent the 95% confidence intervals of the HOPS estimates. The solid red line represents the corresponding SSPE estimates. Since the confidence intervals around the SSPE estimates had the same width as the ones around the HOPS estimates, they are not shown.

Data table for Figure 1
| Date | HOPS | SSPE | HOPS (upper bound of 95% CI) | HOPS (lower bound of 95% CI) |
|---|---|---|---|---|
| persons | ||||
| 2008 | ||||
| January | 84,700 | 86,800 | 91,168 | 78,232 |
| February | 83,400 | 84,300 | 89,672 | 77,128 |
| March | 83,100 | 86,600 | 89,372 | 76,828 |
| April | 84,000 | 84,700 | 90,076 | 77,924 |
| May | 86,200 | 87,200 | 92,668 | 79,732 |
| June | 85,500 | 86,900 | 91,968 | 79,032 |
| July | 86,900 | 88,300 | 93,368 | 80,432 |
| August | 85,400 | 85,700 | 91,868 | 78,932 |
| September | 84,900 | 84,600 | 90,780 | 79,020 |
| October | 83,600 | 83,500 | 89,872 | 77,328 |
| November | 83,800 | 84,100 | 90,464 | 77,136 |
| December | 85,200 | 83,800 | 92,256 | 78,144 |
| 2009 | ||||
| January | 85,100 | 85,100 | 91,764 | 78,436 |
| February | 84,300 | 85,600 | 91,356 | 77,244 |
| March | 83,100 | 81,100 | 89,764 | 76,436 |
| April | 83,400 | 80,700 | 90,064 | 76,736 |
| May | 86,000 | 83,100 | 92,860 | 79,140 |
| June | 85,300 | 85,100 | 92,356 | 78,244 |
| July | 85,200 | 84,200 | 91,864 | 78,536 |
| August | 84,200 | 81,600 | 91,060 | 77,340 |
| September | 80,600 | 82,800 | 86,872 | 74,328 |
| October | 83,500 | 84,300 | 89,772 | 77,228 |
| November | 85,600 | 84,800 | 92,264 | 78,936 |
| December | 85,300 | 84,900 | 91,768 | 78,832 |
| 2010 | ||||
| January | 89,600 | 87,800 | 96,656 | 82,544 |
| February | 87,800 | 86,900 | 94,464 | 81,136 |
| March | 92,000 | 89,400 | 99,056 | 84,944 |
| April | 93,700 | 91,500 | 100,756 | 86,644 |
| May | 94,400 | 94,800 | 101,260 | 87,540 |
| June | 92,000 | 94,600 | 99,448 | 84,552 |
| July | 95,100 | 95,900 | 102,156 | 88,044 |
| August | 93,100 | 94,300 | 100,156 | 86,044 |
| September | 90,500 | 91,300 | 97,164 | 83,836 |
| October | 91,100 | 93,100 | 97,960 | 84,240 |
| November | 90,200 | 88,200 | 96,668 | 83,732 |
| December | 87,800 | 89,200 | 94,464 | 81,136 |
| 2011 | ||||
| January | 84,500 | 84,600 | 91,164 | 77,836 |
| February | 86,400 | 85,100 | 93,064 | 79,736 |
| March | 85,100 | 85,800 | 91,568 | 78,632 |
| April | 87,700 | 87,400 | 94,168 | 81,232 |
| May | 85,200 | 85,200 | 91,080 | 79,320 |
| June | 82,700 | 82,400 | 88,580 | 76,820 |
| July | 88,000 | 86,600 | 94,468 | 81,532 |
| August | 88,100 | 87,700 | 95,548 | 80,652 |
| September | 85,200 | 86,200 | 92,256 | 78,144 |
| October | 87,100 | 87,200 | 94,352 | 79,848 |
| November | 84,600 | 81,300 | 91,852 | 77,348 |
| December | 85,200 | 85,000 | 92,256 | 78,144 |
| 2012 | ||||
| January | 83,000 | 82,500 | 90,056 | 75,944 |
| February | 83,500 | 84,600 | 90,556 | 76,444 |
| March | 84,700 | 83,800 | 91,364 | 78,036 |
| April | 86,200 | 85,900 | 93,060 | 79,340 |
| May | 86,700 | 84,000 | 93,168 | 80,232 |
| June | 81,900 | 82,900 | 88,172 | 75,628 |
| July | 83,800 | 82,600 | 90,268 | 77,332 |
| August | 84,200 | 82,400 | 90,472 | 77,928 |
| September | 81,400 | 80,100 | 87,476 | 75,324 |
| October | 80,600 | 79,800 | 86,676 | 74,524 |
| November | 82,300 | 80,000 | 88,180 | 76,420 |
| December | 82,300 | 83,700 | 88,180 | 76,420 |
| 2013 | ||||
| January | 84,600 | 83,500 | 90,676 | 78,524 |
| February | 82,700 | 82,900 | 88,776 | 76,624 |
| March | 84,400 | 84,600 | 90,868 | 77,932 |
| April | 84,800 | 85,200 | 91,072 | 78,528 |
| May | 87,900 | 87,700 | 93,976 | 81,824 |
| June | 87,200 | 87,200 | 93,276 | 81,124 |
| July | 90,200 | 89,400 | 96,668 | 83,732 |
| August | 88,300 | 87,400 | 94,768 | 81,832 |
| September | 90,700 | 89,500 | 97,364 | 84,036 |
| October | 87,100 | 85,100 | 93,764 | 80,436 |
| November | 86,700 | 84,700 | 93,364 | 80,036 |
| December | 85,100 | 82,300 | 91,764 | 78,436 |
| 2014 | ||||
| January | 84,000 | 83,800 | 90,860 | 77,140 |
| February | 82,900 | 83,900 | 89,760 | 76,040 |
| March | 79,500 | 83,400 | 86,556 | 72,444 |
| April | 80,700 | 82,400 | 87,364 | 74,036 |
| May | 83,300 | 85,100 | 90,160 | 76,440 |
| June | 83,300 | 83,000 | 90,160 | 76,440 |
| July | 84,400 | 82,900 | 92,044 | 76,756 |
| August | 84,300 | 87,400 | 91,356 | 77,244 |
| September | 81,500 | 83,800 | 88,556 | 74,444 |
| October | 82,700 | 86,000 | 89,364 | 76,036 |
| November | 85,300 | 84,700 | 92,356 | 78,244 |
| December | 84,300 | 86,400 | 90,768 | 77,832 |
| 2015 | ||||
| January | 83,000 | 85,300 | 89,664 | 76,336 |
| February | 82,200 | 84,500 | 88,864 | 75,536 |
| March | 85,800 | 85,200 | 92,660 | 78,940 |
| April | 85,000 | 86,200 | 91,468 | 78,532 |
| May | 85,100 | 86,400 | 91,176 | 79,024 |
| June | 83,300 | 85,600 | 88,984 | 77,616 |
| July | 87,500 | 86,900 | 93,968 | 81,032 |
| August | 89,400 | 87,500 | 96,064 | 82,736 |
| September | 85,300 | 87,500 | 91,768 | 78,832 |
| October | 87,300 | 87,900 | 93,768 | 80,832 |
| November | 87,000 | 87,600 | 93,272 | 80,728 |
| December | 87,000 | 86,300 | 93,272 | 80,728 |
| 2016 | ||||
| January | 82,700 | 84,300 | 88,776 | 76,624 |
| February | 81,400 | 85,000 | 87,868 | 74,932 |
| March | 84,000 | 84,400 | 90,468 | 77,532 |
| April | 83,700 | 87,100 | 90,168 | 77,232 |
| May | 84,900 | 83,300 | 91,564 | 78,236 |
| June | 84,800 | 85,700 | 91,464 | 78,136 |
| July | 87,400 | 89,400 | 94,260 | 80,540 |
| August | 92,000 | 95,800 | 99,056 | 84,944 |
| September | 90,300 | 92,300 | 97,356 | 83,244 |
| October | 87,800 | 89,500 | 94,464 | 81,136 |
| November | 88,700 | 89,800 | 95,168 | 82,232 |
| December | 83,700 | 85,600 | 90,364 | 77,036 |
| 2017 | ||||
| January | 83,200 | 86,300 | 89,472 | 76,928 |
| February | 84,200 | 85,900 | 90,276 | 78,124 |
| March | 83,900 | 84,500 | 89,976 | 77,824 |
| April | 84,200 | 83,400 | 90,276 | 78,124 |
| May | 86,200 | 85,500 | 92,668 | 79,732 |
| Source: Statistics Canada, Labour Force Survey. | ||||
Figure 1 demonstrates that the labour force imputation did not have a dramatic effect on the estimates, as the SSPE estimates track well with those from HOPS, staying within the 95% confidence intervals throughout the 9-year series.
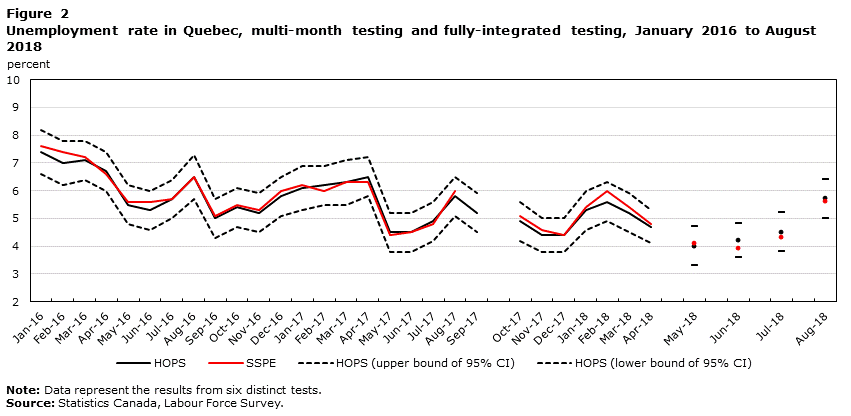
Figure 2 represents the unemployment rate in Quebec, using data from Multi-month testing. Once again, the black lines represent the HOPS estimates and their 95% confidence intervals, while the red line represents the SSPE estimates. The first section, from January 2016 to August 2017, represents Phase 1 of Multi-month testing. Following the gap in September 2017, data is from Phase 2 and represents a fresh start in October 2017 (previous month data generated from HOPS), carried through until April 2018. The final four sets of points represent four individual starts associated with Fully-integrated testing (May 2018 until August 2018).
Data table for Figure 2
| Date | HOPS | SSPE | HOPS (upper bound of 95% CI) | HOPS (lower bound of 95% CI) |
|---|---|---|---|---|
| percent | ||||
| Multi-month testing 1 | ||||
| 2016 | ||||
| January | 7.4 | 7.6 | 8.2 | 6.6 |
| February | 7.0 | 7.4 | 7.8 | 6.2 |
| March | 7.1 | 7.2 | 7.8 | 6.4 |
| April | 6.7 | 6.6 | 7.4 | 6.0 |
| May | 5.5 | 5.6 | 6.2 | 4.8 |
| June | 5.3 | 5.6 | 6.0 | 4.6 |
| July | 5.7 | 5.7 | 6.4 | 5.0 |
| August | 6.5 | 6.5 | 7.3 | 5.7 |
| September | 5.0 | 5.1 | 5.7 | 4.3 |
| October | 5.4 | 5.5 | 6.1 | 4.7 |
| November | 5.2 | 5.3 | 5.9 | 4.5 |
| December | 5.8 | 6.0 | 6.5 | 5.1 |
| 2017 | ||||
| January | 6.1 | 6.2 | 6.9 | 5.3 |
| February | 6.2 | 6.0 | 6.9 | 5.5 |
| March | 6.3 | 6.3 | 7.1 | 5.5 |
| April | 6.5 | 6.3 | 7.2 | 5.8 |
| May | 4.5 | 4.4 | 5.2 | 3.8 |
| June | 4.5 | 4.5 | 5.2 | 3.8 |
| July | 4.9 | 4.8 | 5.6 | 4.2 |
| August | 5.8 | 6.0 | 6.5 | 5.1 |
| September | 5.2 | Note ...: not applicable | 5.9 | 4.5 |
| Multi-month testing 2 | ||||
| 2017 | ||||
| October | 4.9 | 5.1 | 5.6 | 4.2 |
| November | 4.4 | 4.6 | 5.0 | 3.8 |
| December | 4.4 | 4.4 | 5.0 | 3.8 |
| January | 5.3 | 5.4 | 6.0 | 4.6 |
| February | 5.6 | 6.0 | 6.3 | 4.9 |
| March | 5.2 | 5.4 | 5.9 | 4.5 |
| April | 4.7 | 4.8 | 5.3 | 4.1 |
| Fully-integrated testing 2A | ||||
| 2018 | ||||
| May | 4.0 | 4.1 | 4.7 | 3.3 |
| Fully-integrated testing 2B | ||||
| 2018 | ||||
| June | 4.2 | 3.9 | 4.8 | 3.6 |
| Fully-integrated testing 2C | ||||
| 2018 | ||||
| July | 4.5 | 4.3 | 5.2 | 3.8 |
| Fully-integrated testing 2D | ||||
| 2018 | ||||
| August | 5.7 | 5.6 | 6.4 | 5.0 |
|
... not applicable Note: Data represent the results from six distinct tests. Source: Statistics Canada, Labour Force Survey. |
||||
The conclusions are the same as with the data shown in Figure 1: the SSPE data is not significantly different from the HOPS data, staying within the 95% confidence intervals generated by the bootstrap method on the HOPS data.
Some LFS data are seasonally adjusted, in order to remove seasonal patterns and provide a better representation of trends. The associated seasonal adjustment models—which are external to HOPS and therefore not affected by the transition to SSPE—were applied to the SSPE test data, and a series of comparisons were carried out. The analysis revealed no structural changes in the data, and the seasonality of the SSPE data was captured well by the existing seasonal adjustment models. Figure 3 shows that the seasonally-adjusted series of employment in Canada from January 2015 to June 2017, based on SSPE, is statistically equivalent to the analogous LFS data.

Data table for Figure 3
| Date | Canada, HOPS | Canada, SSPE |
|---|---|---|
| persons | ||
| 2015 | ||
| January | 17,876,300 | 17,875,400 |
| February | 17,888,000 | 17,882,500 |
| March | 17,905,600 | 17,913,100 |
| April | 17,896,400 | 17,897,300 |
| May | 17,946,200 | 17,945,800 |
| June | 17,947,800 | 17,947,500 |
| July | 17,965,600 | 17,966,900 |
| August | 17,984,500 | 17,982,000 |
| September | 17,982,300 | 17,983,800 |
| October | 18,016,900 | 18,010,900 |
| November | 17,985,100 | 17,985,500 |
| December | 18,003,600 | 18,005,100 |
| 2016 | ||
| January | 17,996,800 | 18,010,800 |
| February | 17,997,800 | 18,020,500 |
| March | 18,033,200 | 18,042,900 |
| April | 18,039,300 | 18,053,800 |
| May | 18,048,100 | 18,055,500 |
| June | 18,053,400 | 18,065,900 |
| July | 18,030,500 | 18,030,000 |
| August | 18,069,600 | 18,079,100 |
| September | 18,136,500 | 18,130,800 |
| October | 18,184,600 | 18,173,000 |
| November | 18,184,100 | 18,191,700 |
| December | 18,234,900 | 18,233,600 |
| 2017 | ||
| January | 18,278,400 | 18,265,000 |
| February | 18,290,700 | 18,270,000 |
| March | 18,315,600 | 18,325,300 |
| April | 18,323,100 | 18,322,400 |
| May | 18,371,900 | 18,376,700 |
| June | 18,410,900 | 18,413,300 |
| Source: Statistics Canada, Labour Force Survey. | ||
Month-to-month changes are of particular interest for many analysts of LFS data. Figure 4 shows the monthly change in total full-time employment in Canada in 2016. The graphic demonstrates that the discrepancies between the two series are not significant enough to imply a change in the story told by the data.

Data table for Figure 4
| Date | HOPS, full-time employment | SSPE, full-time employment |
|---|---|---|
| persons | ||
| 2016 | ||
| Jan.-Feb. | -61,500 | -35,700 |
| Feb.-Mar. | 53,900 | 32,700 |
| Mar.-Apr. | 138,600 | 167,300 |
| Apr.-May | 543,700 | 532,200 |
| May-Jun. | 225,900 | 201,400 |
| Jun.-Jul. | 63,200 | 78,800 |
| Jul.-Aug. | 67,200 | 77,400 |
| Aug.-Sep. | -440,700 | -481,700 |
| Sep.-Oct. | -120,800 | -106,500 |
| Oct.-Nov. | -138,000 | -167,000 |
| Nov.-Dec. | -18,200 | -28,300 |
| Source: Statistics Canada, Labour Force Survey. | ||
Estimates of particular interest
Although integrated testing indicates that for most LFS estimates differences between HOPS and SSPE estimates are very small, users of LFS data should be aware of some specific testing results:
- Full-time and part-time employment: While the underlying LFS processing methodology will not change with the transition to SSPE, the CANCEIS system used for imputation with SSPE is more efficient than HOPS at finding appropriate imputation donors. As a result, SSPE tends to preserve more respondent data while HOPS tends to resort more often to whole-record imputation. This results in more efficient imputation in SSPE for respondents with lower-prevalence characteristics, such as part-time employment. Testing indicates that this could result in a slight increase in part-time employment and a corresponding decrease in full-time employment. Related estimates such as the average number of hours worked could decrease slightly.
- Firm size: As a result of correcting a specific edit in HOPS, the distribution of employment by firm size could be affected by the transition to SSPE, with an increase of approximately 3% in the number of employees working for firms having more than 500 employees. As shown in Figure 5, estimates calculated using data from Multi-month testing are consistently higher than those from HOPS, often falling just outside of the 95% confidence intervals.

Data table for Figure 5
| Date | HOPS | SSPE | HOPS (upper bound of 95% CI) | HOPS (lower bound of 95% CI) |
|---|---|---|---|---|
| persons | ||||
| Multi-month testing 1 | ||||
| 2016 | ||||
| January | 1,951,000 | 1,981,100 | 2,017,444 | 1,884,556 |
| February | 2,045,300 | 2,124,700 | 2,117,428 | 1,973,172 |
| March | 2,078,500 | 2,118,600 | 2,147,492 | 2,009,508 |
| April | 2,032,400 | 2,115,100 | 2,101,000 | 1,963,800 |
| May | 1,984,700 | 2,094,600 | 2,054,280 | 1,915,120 |
| June | 1,993,900 | 2,123,100 | 2,064,068 | 1,923,732 |
| July | 1,890,900 | 2,050,500 | 1,960,872 | 1,820,928 |
| August | 1,952,600 | 2,061,900 | 2,024,140 | 1,881,060 |
| September | 1,980,500 | 2,090,100 | 2,049,688 | 1,911,312 |
| October | 2,035,200 | 2,127,100 | 2,105,368 | 1,965,032 |
| November | 2,078,900 | 2,167,300 | 2,150,636 | 2,007,164 |
| December | 2,105,500 | 2,184,000 | 2,175,864 | 2,035,136 |
| 2017 | ||||
| January | 2,100,300 | 2,179,000 | 2,169,880 | 2,030,720 |
| February | 2,097,800 | 2,189,600 | 2,166,204 | 2,029,396 |
| March | 2,079,600 | 2,172,800 | 2,147,416 | 2,011,784 |
| April | 2,104,100 | 2,183,700 | 2,173,288 | 2,034,912 |
| May | 2,105,800 | 2,200,800 | 2,176,360 | 2,035,240 |
| June | 2,042,800 | 2,142,800 | 2,111,988 | 1,973,612 |
| July | 2,022,700 | 2,137,800 | 2,092,084 | 1,953,316 |
| August | 2,047,000 | 2,124,400 | 2,116,972 | 1,977,028 |
| September | Note ...: not applicable | Note ...: not applicable | Note ...: not applicable | Note ...: not applicable |
| Multi-month testing 2 | ||||
| 2018 | ||||
| October | 2,068,800 | 2,105,300 | 2,141,516 | 1,996,084 |
| November | 2,101,900 | 2,156,100 | 2,175,008 | 2,028,792 |
| December | 2,168,300 | 2,247,200 | 2,242,780 | 2,093,820 |
| January | 2,082,800 | 2,189,900 | 2,155,516 | 2,010,084 |
| February | 2,118,500 | 2,210,700 | 2,194,352 | 2,042,648 |
| March | 2,109,500 | 2,236,600 | 2,181,040 | 2,037,960 |
| April | 2,135,000 | 2,225,800 | 2,211,048 | 2,058,952 |
| Fully-integrated testing 2A | ||||
| 2018 | ||||
| May | 2,087,800 | 2,147,200 | 2,155,616 | 2,019,984 |
| Fully-integrated testing 2B | ||||
| 2018 | ||||
| June | 2,131,100 | 2,187,200 | 2,199,504 | 2,062,696 |
| Fully-integrated testing 2C | ||||
| 2018 | ||||
| July | 2,154,800 | 2,226,100 | 2,226,144 | 2,083,456 |
| Fully-integrated testing 2D | ||||
| 2018 | ||||
| August | 2,082,700 | 2,153,300 | 2,156,396 | 2,009,004 |
|
... not applicable Note: Data represent the results from six distinct tests. Source: Statistics Canada, Labour Force Survey. |
||||
The impact of transition to SSPE on these estimates will be monitored and, if appropriate, an historical revision of the series will be included in the planned 5-year rebasing of LFS estimates, currently planned for January 2020.
Conclusions
Based on extensive testing, the transitioning of LFS data processing from the current system (HOPS) to the Social Survey Processing Environment (SSPE) is expected to have minimal impact on LFS estimates and to be transparent to users of LFS data.
Appendix A
Key estimates
These estimates are considered the most important estimates published from LFS data.
| Estimate | Group |
|---|---|
| Total, labour force | 1 |
| Total, employment | 1 |
| Total, unemployment | 1 |
| Total, not in labour force | 1 |
| Unemployment rate | 1 |
| Participation rate | 1 |
| Employment rate | 1 |
| Total, full-time employment | 2 |
| Total, part-time employment | 2 |
| Total, employees | 2 |
| Total, public sector employees | 2 |
| Total, private sector employees | 2 |
| Total, self-employed | 2 |
| Total, employees by industry (16 levels) | 2 |
| Total, employees by occupation (10 levels) | 2 |
| Average wages | 2 |
| Average hours | 3 |
| Total, multiple job holders | 3 |
| Total, employees by unionization status (2 levels) | 3 |
| Total, employees by job permanence (2 levels) | 3 |
| Total, employees by firm size (4 levels) | 3 |
| Source: Statistics Canada, Labour Force Survey. | |
Key variables labelled ‘group 1’ were evaluated for all key domains. Those labelled ‘group 2’ or ‘group 3’ were formally evaluated at aggregate levels and for limited levels of disaggregation.
Key domains
These are the major geographic and demographic domains for which estimates are published.
| Domain | Components |
|---|---|
| Geography | Provinces and territories |
| Economic regions (ERs) | |
| Census metropolitan areas (CMAs) | |
| Employment Insurance economic regions (EIERs) | |
| Age | 15 years and over |
| Youth: 15 to 24 years, 15 to 19 years, 20 to 24 years | |
| Core-aged: 25 to 54 years | |
| Senior: 55 years and over, 55 to 64 years, 65 to 69 years, 70 years and over | |
| Sex | Men, 15 years and over |
| Women, 15 years and over | |
| Aboriginal and Immigrant status | Aboriginal population, 15 years and over |
| Immigrant population, 15 years and over | |
| Source: Statistics Canada, Labour Force Survey. | |
- Date modified: