
Methodology of the Canadian Labour Force Survey
Appendix E
Provincial maps
Map 1 – Newfoundland and Labrador
CMACA, EI-EIER Intersection Boundaries
Description for Map 1 – Newfoundland and Labrador
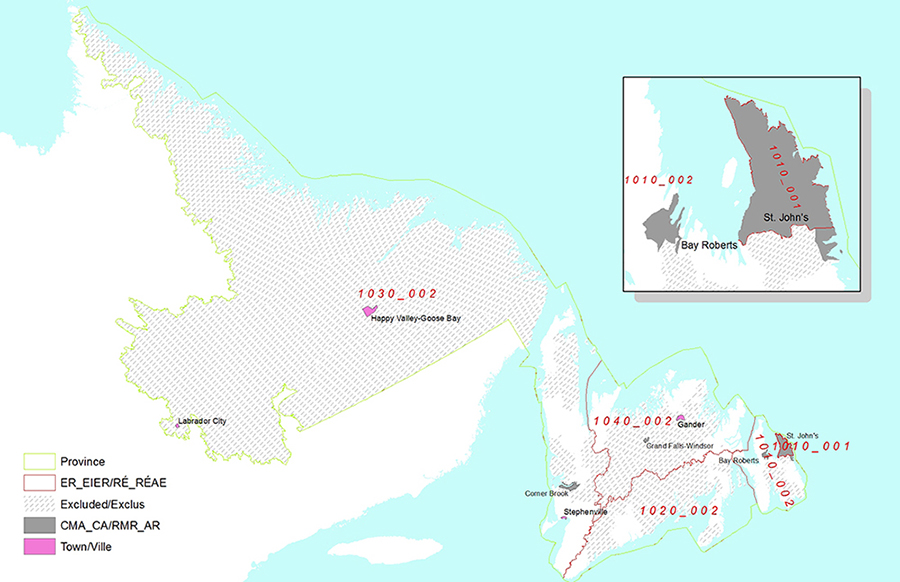
This is a reference map of Newfoundland and Labrador, which includes an inset map of St. John’s and Bay Roberts area, for the 2015 LFS design CMA\CA-ER-EIER Intersection Boundaries.
Highlights of what is displayed visually, the goal of map, text within the map:
There are a total of five ER-EIER regions displayed within the map. They are identified by their label (‘4-digit-number-ER-code’_’3-digit-number-EIER-code’). The maps also show the areas associated with the CMA of St. John’s, and the CA of the province.
1010_001: ER of Avalon Peninsula, EIER of St. John’s
1010_002: ER of Avalon Peninsula, EIER of Newfoundland and Labrador
1020_002: ER of South Coast – Burin Peninsula, EIER of Newfoundland and Labrador
1030_002: ER of West Coast – Northern Peninsula – Labrador, EIER of Newfoundland and Labrador
1040_002: ER of Notre Dame – Central Bonavista Bay, EIER of Newfoundland and Labrador
Legend:
The green line displayed on the map outlines the province of Newfoundland and Labrador. The red lines outline the ER-EIER intersection boundaries, while the grey lines outline the CMA\CA\town boundaries. The grey dots represent excluded areas, while the grey shaded areas represent CMA\CA and the pink shaded areas represent towns.
Source:
Map produced by the Labour Force Survey and Household Survey Sampling Infrastructure Methods Section, Household Survey Methods Division, Statistics Canada, 2016.
Source: 2011 Census of Population, Statistical Registers and Geography Division, Statistics Canada.
Map 2 – Prince Edward Island
CMACA, EI-EIER Intersection Boundaries
Description for Map 2 – Prince Edward Island
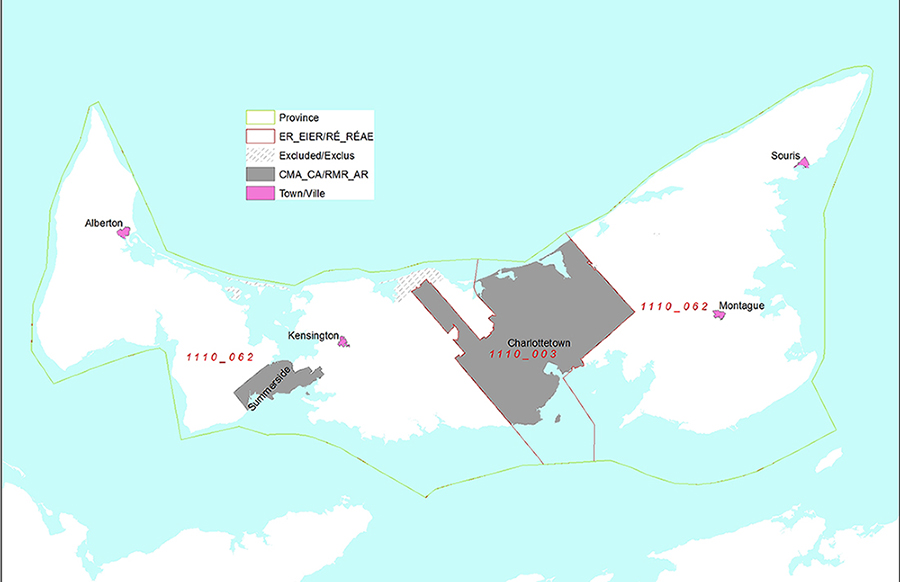
This is a reference map of Prince Edward Island for the 2015 LFS design CMA\CA-ER-EIER Intersection Boundaries.
Highlights of what is displayed visually, the goal of map, text within the map:
There are a total of two ER-EIER regions displayed within the map. They are identified by their label (‘4-digit-number-ER-code’_’3-digit-number-EIER-code’). The maps also show the areas associated with the CA of Charlottetown and Summerside.
1110_003: ER of Prince Edward Island, EIER of Charlottetown
1110_062: ER of Prince Edward Island, EIER of Prince Edward Island
Legend:
The green line displayed on the map outlines the province of Prince Edward Island. The red lines outline the ER-EIER intersection boundaries, while the grey lines outline the CMA\CA\town boundaries. The grey dots represent excluded areas, while the grey shaded areas represent CMA\CA and the pink shaded areas represent towns.
Source:
Map produced by the Labour Force Survey and Household Survey Sampling Infrastructure Methods Section, Household Survey Methods Division, Statistics Canada, 2016.
Source: 2011 Census of Population, Statistical Registers and Geography Division, Statistics Canada.
Map 3 – Nova Scotia
CMACA, EI-EIER Intersection Boundaries

Description for Map 3 – Nova Scotia
This is a reference map of Nova Scotia for the 2015 LFS design CMA\CA-ER-EIER Intersection Boundaries.
Highlights of what is displayed visually, the goal of map, text within the map:
There are a total of seven ER-EIER regions displayed within the map. They are identified by their label (‘4-digit-number-ER-code’_’3-digit-number-EIER-code’). The maps also show the areas associated with the CMA of Halifax, and the CA of the province.
1210_004: ER of Cape Breton, EIER of Eastern Nova Scotia
1220_004: ER of North Shore, EIER of Eastern Nova Scotia
1220_005: ER of North Shore, EIER of Western Nova Scotia
1230_005: ER of Annapolis Valley, EIER of Western Nova Scotia
1240_005: ER of Southern, EIER of Western Nova Scotia
1250_004: ER of Halifax, EIER of Eastern Nova Scotia
1250_006: ER of Halifax, EIER of Halifax
Legend:
The green line displayed on the map outlines the province of Nova Scotia. The red lines outline the ER-EIER intersection boundaries, while the grey lines outline the CMA\CA\town boundaries. The grey dots represent excluded areas, while the grey shaded areas represent CMA\CA and the pink shaded areas represent towns.
Source:
Map produced by the Labour Force Survey and Household Survey Sampling Infrastructure Methods Section, Household Survey Methods Division, Statistics Canada, 2016.
Source: 2011 Census of Population, Statistical Registers and Geography Division, Statistics Canada.
Map 4 – New Brunswick
CMACA, EI-EIER Intersection Boundaries
Description for Map 4 – New Brunswick
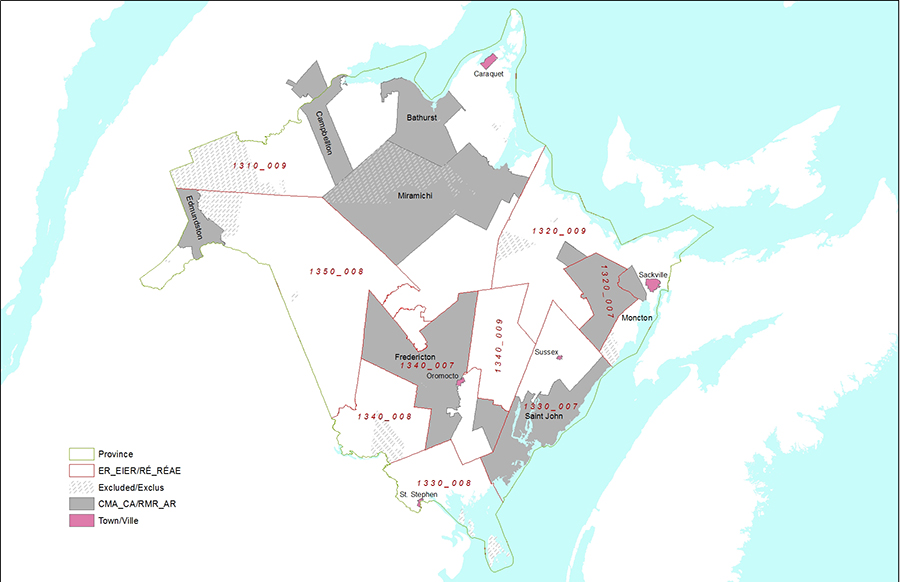
This is a reference map of New Brunswick for the 2015 LFS design CMA\CA-ER-EIER Intersection Boundaries.
Highlights of what is displayed visually, the goal of map, text within the map:
There are a total of nine ER-EIER regions displayed within the map. They are identified by their label (‘4-digit-number-ER-code’_’3-digit-number-EIER-code’). The maps also show the areas associated with the CMA of Moncton and Saint John, and the CA of the province.
1310_009: ER of Campbellton – Miramichi, EIER of Restigouche - Albert
1320_007: ER of Moncton - Richibucto, EIER of Fredericton – Moncton – Saint John
1320_009: ER of Moncton - Richibucto, EIER of Restigouche - Albert
1330_007: ER of Saint John – St. Stephen, EIER of Fredericton – Moncton – Saint John
1330_008: ER of Saint John – St. Stephen, EIER of Madawaska - Charlotte
1340_007: ER of Fredericton - Oromocto, EIER of Fredericton – Moncton – Saint John
1340_008: ER of Fredericton - Oromocto, EIER of Madawaska - Charlotte
1340_009: ER of Fredericton - Oromocto, EIER of Restigouche - Albert
1350_008: ER of Edmundston - Woodstock, EIER of Madawaska - Charlotte
Legend:
The green line displayed on the map outlines the province of New Brunswick. The red lines outline the ER-EIER intersection boundaries, while the grey lines outline the CMA\CA\town boundaries. The grey dots represent excluded areas, while the grey shaded areas represent CMA\CA and the pink shaded areas represent towns.
Source:
Map produced by the Labour Force Survey and Household Survey Sampling Infrastructure Methods Section, Household Survey Methods Division, Statistics Canada, 2016.
Source: 2011 Census of Population, Statistical Registers and Geography Division, Statistics Canada.
Map 5a – Quebec North
CMACA, EI-EIER Intersection Boundaries
Description for Map 5a – Quebec North
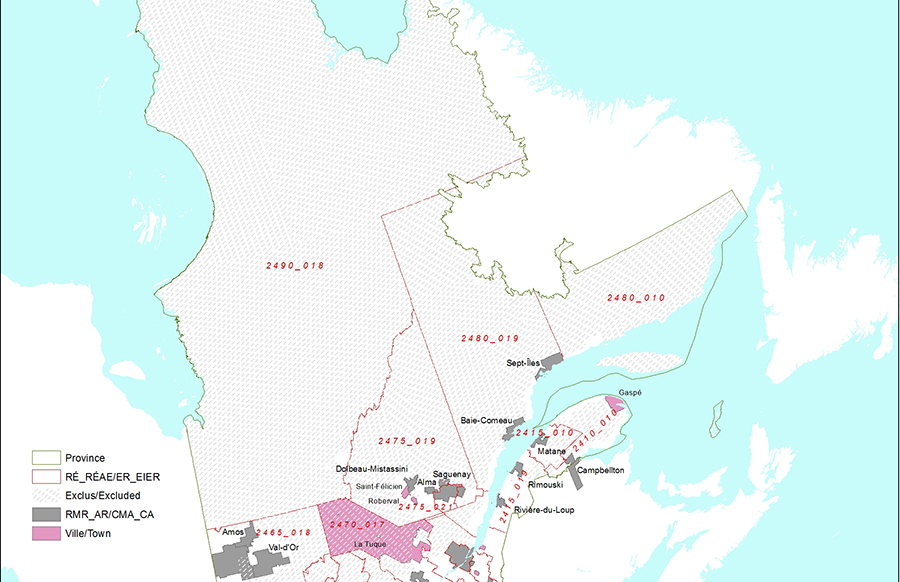
This is a reference map of the north of the province of Quebec for the 2015 LFS design CMA\CA-ER-EIER Intersection Boundaries.
Highlights of what is displayed visually, the goal of map, text within the map:
There are a total of ten ER-EIER regions displayed within the map. They are identified by their label (‘4-digit-number-ER-code’_’3-digit-number-EIER-code’). The maps also show the areas associated with the CMA of Saguenay, and the CA in the north of the province of Quebec.
2410_010: ER of Gaspésie – Îles-de-la-Madeleine, EIER of Gaspésie – Îles-de-la-Madeleine
2415_010: ER of Bas-Saint-Laurent, EIER of Gaspésie – Îles-de-la-Madeleine
2415_019: ER of Bas-Saint-Laurent, EIER of Bas-Saint-Laurent – Côte-Nord
2465_018: ER of Abitibi - Témiscamingue, EIER of Northwestern Quebec
2470_017: ER of Mauricie, EIER of Central Quebec
2475_019: ER of Saguenay – Lac-Saint-Jean, EIER of Bas-Saint-Laurent – Côte-Nord
2475_021: ER of Saguenay – Lac-Saint-Jean, EIER of Saguenay
2480_010: ER of Côte-Nord, EIER of Gaspésie – Îles-de-la-Madeleine
2480_019: ER of Côte-Nord, EIER of Bas-Saint-Laurent – Côte-Nord
2490_018: ER of Nord-du-Québec, EIER of Northwestern Quebec
Legend:
The green line displayed on the map outlines the province of Quebec in the north of the province. The red lines outline the ER-EIER intersection boundaries, while the grey lines outline the CMA\CA\town boundaries. The grey dots represent excluded areas, while the grey shaded areas represent CMA\CA and the pink shaded areas represent towns.
Source:
Map produced by the Labour Force Survey and Household Survey Sampling Infrastructure Methods Section, Household Survey Methods Division, Statistics Canada, 2016.
Source: 2011 Census of Population, Statistical Registers and Geography Division, Statistics Canada.
Map 5b – Quebec South
CMACA, EI-EIER Intersection Boundaries
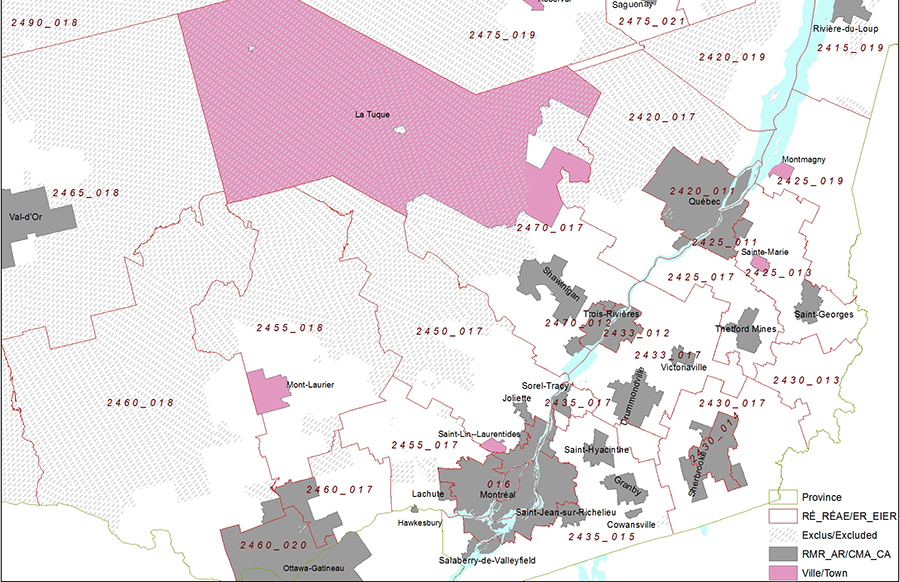
Description for Map 5b – Quebec South
This is a reference map of the south of the province of Quebec for the 2015 LFS design CMA\CA-ER-EIER Intersection Boundaries.
Highlights of what is displayed visually, the goal of map, text within the map:
There are a total of twenty-seven ER-EIER regions displayed within the map. They are identified by their label (‘4-digit-number-ER-code’_’3-digit-number-EIER-code’). The maps also show the areas associated with the CMA of Montreal, Ottawa-Gatineau, Québec, Saguenay, Sherbrooke and Trois-Rivières, and the CA of the south of the province of Quebec.
2415_019: ER of Bas-Saint-Laurent, EIER of Bas-Saint-Laurent – Côte-Nord
2420_011: ER of Capitale-Nationale, EIER of Québec
2420_017: ER of Capitale-Nationale, EIER of Central Quebec
2420_019: ER of Capitale-Nationale, EIER of Bas-Saint-Laurent – Côte-Nord
2425_011: ER of Chaudière - Appalaches, EIER of Québec
2425_013: ER of Chaudière - Appalaches, EIER of South Central Quebec
2425_017: ER of Chaudière - Appalaches, EIER of Central Quebec
2425_019: ER of Chaudière - Appalaches, EIER of Bas-Saint-Laurent – Côte-Nord
2430_013: ER of Estrie, EIER of South Central Quebec
2430_014: ER of Estrie, EIER of Sherbrooke
2430_017: ER of Estrie, EIER of Central Quebec
2433_012: ER of Centre-du-Québec, EIER of Trois-Rivières
2433_017: ER of Centre-du-Québec, EIER of Central Quebec
2435_015: ER of Montérégie, EIER of Montérégie
2435_017: ER of Montérégie, EIER of Central Quebec
2450_017: ER of Lanaudière, EIER of Central Quebec
2455_017: ER of Laurentides, EIER of Central Quebec
2455_018: ER of Laurentides, EIER of Northwestern Quebec
2460_017: ER of Outaouais, EIER of Central Quebec
2460_018: ER of Outaouais, EIER of Northwestern Quebec
2460_020: ER of Outaouais, EIER of Gatineau
2465_018: ER of Abitibi - Témiscamingue, EIER of Northwestern Quebec
2470_012: ER of Mauricie, EIER of Trois-Rivières
2470_017: ER of Mauricie, EIER of Central Quebec
2475_019: ER of Saguenay – Lac-Saint-Jean, EIER of Bas-Saint-Laurent – Côte-Nord
2475_021: ER of Saguenay – Lac-Saint-Jean, EIER of Saguenay
2490_018: ER of Nord-du-Québec, EIER of Northwestern Quebec
Legend:
The green line displayed on the map outlines the province of Quebec in the south of the province. The red lines outline the ER-EIER intersection boundaries, while the grey lines outline the CMA\CA\town boundaries. The grey dots represent excluded areas, while the grey shaded areas represent CMA\CA and the pink shaded areas represent towns.
Source:
Map produced by the Labour Force Survey and Household Survey Sampling Infrastructure Methods Section, Household Survey Methods Division, Statistics Canada, 2016.
Source: 2011 Census of Population, Statistical Registers and Geography Division, Statistics Canada.
Map 5c – Montreal
CMACA, EI-EIER Intersection Boundaries
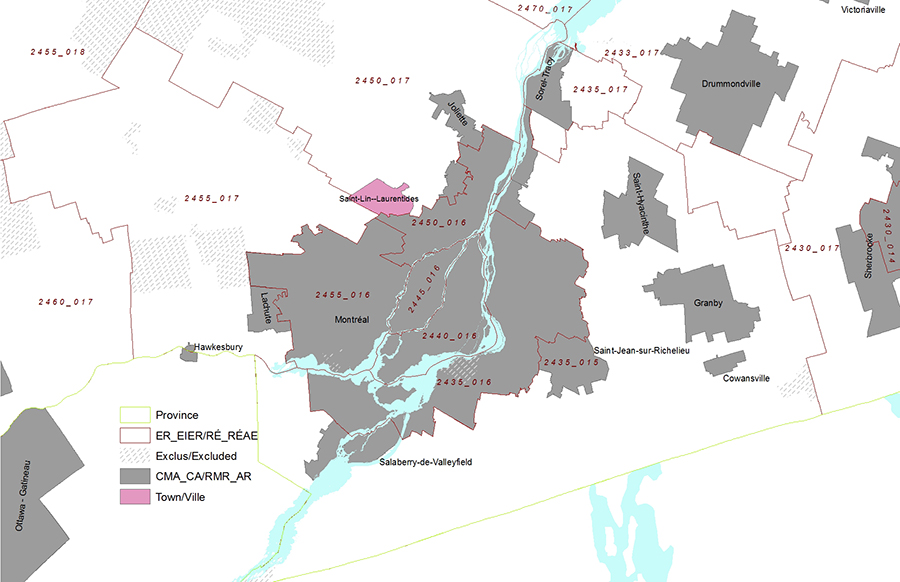
Description for Map 5c – Montreal
This is a reference map of the Montreal area for the 2015 LFS design CMA\CA-ER-EIER Intersection Boundaries.
Highlights of what is displayed visually, the goal of map, text within the map:
There are a total of fifteen ER-EIER regions displayed within the map. They are identified by their label (‘4-digit-number-ER-code’_’3-digit-number-EIER-code’). The maps also show the areas associated with the CMA of Montreal, Ottawa-Gatineau and Sherbrooke, and the CA nearby Montreal.
2430_014: ER of Estrie, EIER of Sherbrooke
2430_017: ER of Estrie, EIER of Central Quebec
2433_017: ER of Centre-du-Québec, EIER of Central Quebec
2435_015: ER of Montérégie, EIER of Montérégie
2435_016: ER of Montérégie, EIER of Montréal
2435_017: ER of Montérégie, EIER of Central Quebec
2440_016: ER of Montréal, EIER of Montréal
2445_016: ER of Laval, EIER of Montréal
2450_016: ER of Lanaudière, EIER of Montréal
2450_017: ER of Lanaudière, EIER of Central Quebec
2455_016: ER of Laurentides, EIER of Montréal
2455_017: ER of Laurentides, EIER of Central Quebec
2455_018: ER of Laurentides, EIER of Northwestern Quebec
2460_017: ER of Outaouais, EIER of Central Quebec
2470_017: ER of Mauricie, EIER of Central Quebec
Legend:
The green line displayed on the map outlines the province of Quebec in the Montreal area. The red lines outline the ER-EIER intersection boundaries, while the grey lines outline the CMA\CA\town boundaries. The grey dots represent excluded areas, while the grey shaded areas represent CMA\CA and the pink shaded areas represent towns.
Source:
Map produced by the Labour Force Survey and Household Survey Sampling Infrastructure Methods Section, Household Survey Methods Division, Statistics Canada, 2016.
Source: 2011 Census of Population, Statistical Registers and Geography Division, Statistics Canada.
Map 6a – Ontario East
CMACA, EI-EIER Intersection Boundaries
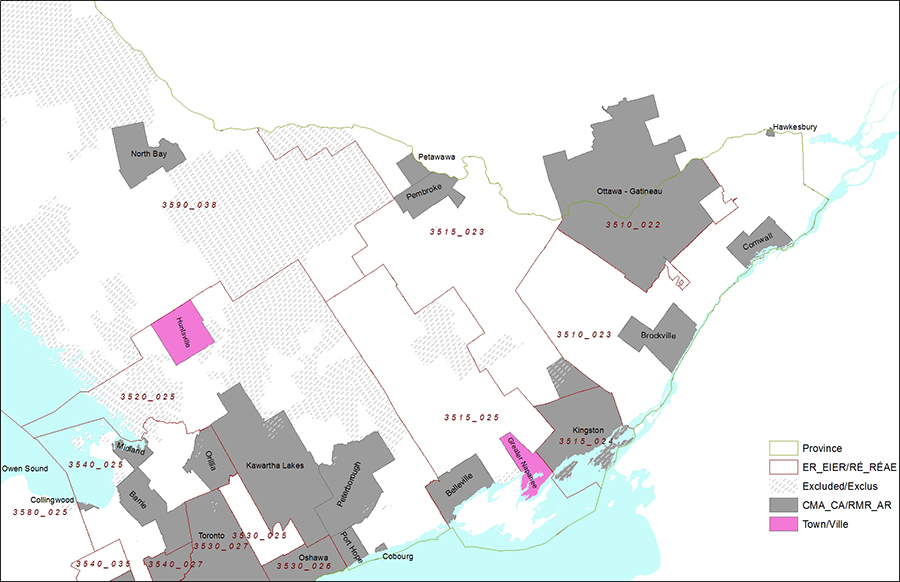
Description for Map 6a – Ontario East
This is a reference map of the east of the province of Ontario for the 2015 LFS design CMA\CA-ER-EIER Intersection Boundaries.
Highlights of what is displayed visually, the goal of map, text within the map:
There are a total of fourteen ER-EIER regions displayed within the map. They are identified by their label (‘4-digit-number-ER-code’_’3-digit-number-EIER-code’). The maps also show the areas associated with the CMA of Barrie, Kingston, Oshawa, Ottawa-Gatineau, Peterborough and Toronto, and the CA in the east of the province of Ontario.
3510_022: ER of Ottawa, EIER of Ottawa
3510_023: ER of Ottawa, EIER of Eastern Ontario
3515_023: ER of Kingston - Pembroke, EIER of Eastern Ontario
3515_024: ER of Kingston - Pembroke, EIER of Kingston
3515_025: ER of Kingston - Pembroke, EIER of Central Ontario
3520_025: ER of Muskoka - Kawarthas, EIER of Central Ontario
3530_025: ER of Toronto, EIER of Central Ontario
3530_026: ER of Toronto, EIER of Oshawa
3530_027: ER of Toronto, EIER of Toronto
3540_025: ER of Kitchener - Waterloo - Barrie, EIER of Central Ontario
3540_027: ER of Kitchener - Waterloo - Barrie, EIER of Toronto
3540_035: ER of Kitchener - Waterloo - Barrie, EIER of South Central Ontario
3580_025: ER of Stratford – Bruce Peninsula, EIER of Central Ontario
3590_038: ER of Northeast, EIER of Northern Ontario
Legend:
The green line displayed on the map outlines the province of Ontario in the east of the province. The red lines outline the ER-EIER intersection boundaries, while the grey lines outline the CMA\CA\town boundaries. The grey dots represent excluded areas, while the grey shaded areas represent CMA\CA and the pink shaded areas represent towns.
Source:
Map produced by the Labour Force Survey and Household Survey Sampling Infrastructure Methods Section, Household Survey Methods Division, Statistics Canada, 2016.
Source: 2011 Census of Population, Statistical Registers and Geography Division, Statistics Canada.
Map 6b – Ontario North
CMACA, EI-EIER Intersection Boundaries
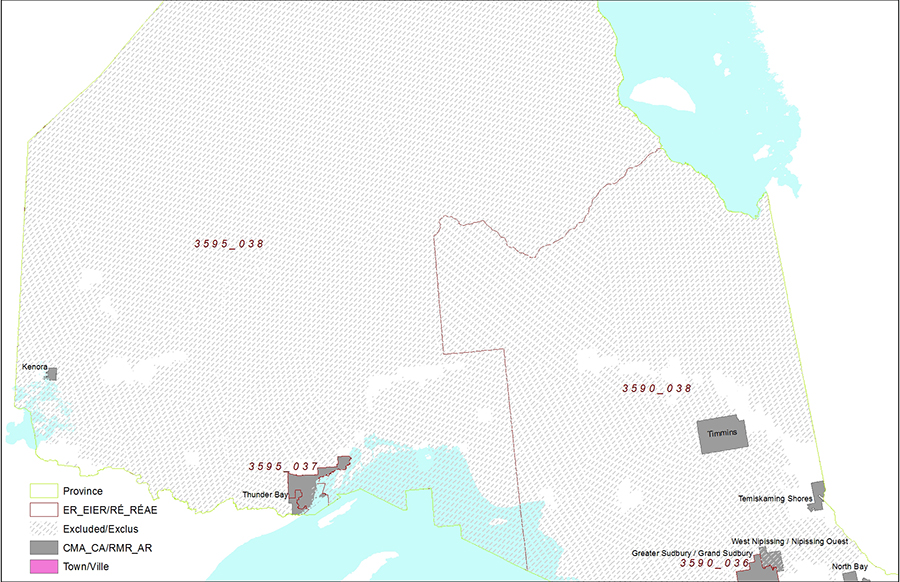
Description for Map 6b – Ontario North
This is a reference map of the north of the province of Ontario for the 2015 LFS design CMA\CA-ER-EIER Intersection Boundaries.
Highlights of what is displayed visually, the goal of map, text within the map:
There are a total of four ER-EIER regions displayed within the map. They are identified by their label (‘4-digit-number-ER-code’_’3-digit-number-EIER-code’). The maps also show the areas associated with the CMA of Greater Sudbury and Thunder Bay, and the CA in the north of the province of Ontario.
3590_036: ER of Northeast, EIER of Sudbury
3590_038: ER of Northeast, EIER of Northern Ontario
3595_037: ER of Northwest, EIER of Thunder Bay
3595_038: ER of Northwest, EIER of Northern Ontario
Legend:
The green line displayed on the map outlines the province of Ontario in the north of the province. The red lines outline the ER-EIER intersection boundaries, while the grey lines outline the CMA\CA\town boundaries. The grey dots represent excluded areas, while the grey shaded areas represent CMA\CA and the pink shaded areas represent towns.
Source:
Map produced by the Labour Force Survey and Household Survey Sampling Infrastructure Methods Section, Household Survey Methods Division, Statistics Canada, 2016.
Source: 2011 Census of Population, Statistical Registers and Geography Division, Statistics Canada.
Map 6c – Ontario South
CMACA, EI-EIER Intersection Boundaries
Description for Map 6c – Ontario South
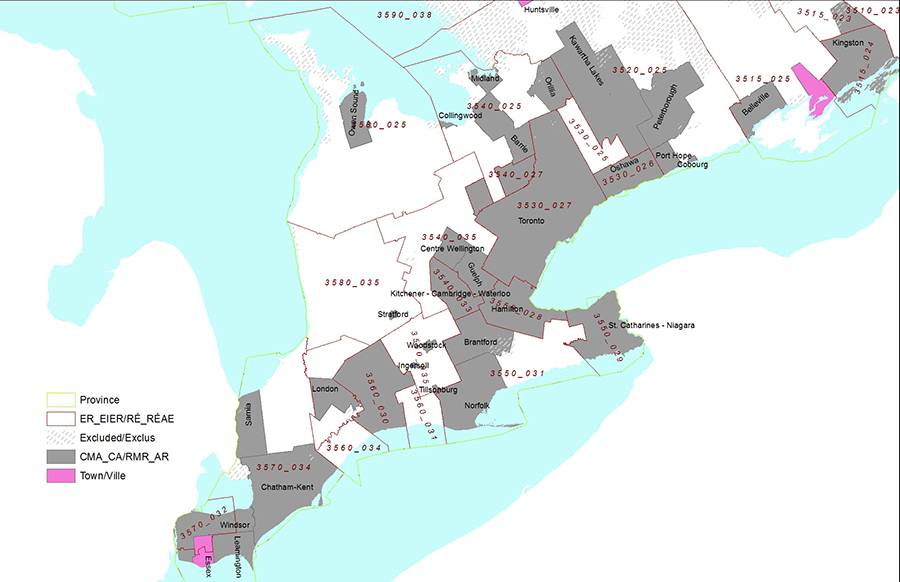
This is a reference map of the south of the province of Ontario for the 2015 LFS design CMA\CA-ER-EIER Intersection Boundaries.
Highlights of what is displayed visually, the goal of map, text within the map:
There are a total of twenty-four ER-EIER regions displayed within the map. They are identified by their label (‘4-digit-number-ER-code’_’3-digit-number-EIER-code’). The maps also show the areas associated with the CMA of Barrie, Brantford, Guelph, Hamilton, Kingston, Kitchener – Cambridge – Waterloo, London, Oshawa, Peterborough, St. Catharines – Niagara, Toronto and Windsor, and the CA in the south of the province of Ontario.
3510_023: ER of Ottawa, EIER of Eastern Ontario
3515_023: ER of Kingston - Pembroke, EIER of Eastern Ontario
3515_024: ER of Kingston - Pembroke, EIER of Kingston
3515_025: ER of Kingston - Pembroke, EIER of Central Ontario
3520_025: ER of Muskoka - Kawarthas, EIER of Central Ontario
3530_025: ER of Toronto, EIER of Central Ontario
3530_026: ER of Toronto, EIER of Oshawa
3530_027: ER of Toronto, EIER of Toronto
3540_025: ER of Kitchener - Waterloo - Barrie, EIER of Central Ontario
3540_027: ER of Kitchener - Waterloo - Barrie, EIER of Toronto
3540_033: ER of Kitchener - Waterloo - Barrie, EIER of Kitchener
3540_035: ER of Kitchener - Waterloo - Barrie, EIER of South Central Ontario
3550_028: ER of Hamilton – Niagara Peninsula, EIER of Hamilton
3550_029: ER of Hamilton – Niagara Peninsula, EIER of St. Catharines
3550_031: ER of Hamilton – Niagara Peninsula, EIER of Niagara
3560_030: ER of London, EIER of London
3560_031: ER of London, EIER of Niagara
3560_034: ER of London, EIER of Huron
3560_035: ER of London, EIER of South Central Ontario
3570_032: ER of Windsor - Sarnia, EIER of Windsor
3570_034: ER of Windsor - Sarnia, EIER of Huron
3580_025: ER of Stratford – Bruce Peninsula, EIER of Central Ontario
3580_035: ER of Stratford – Bruce Peninsula, EIER of South Central Ontario
3590_038: ER of Northeast, EIER of Northern Ontario
Legend:
The green line displayed on the map outlines the province of Ontario in the south of the province. The red lines outline the ER-EIER intersection boundaries, while the grey lines outline the CMA\CA\town boundaries. The grey dots represent excluded areas, while the grey shaded areas represent CMA\CA and the pink shaded areas represent towns.
Source:
Map produced by the Labour Force Survey and Household Survey Sampling Infrastructure Methods Section, Household Survey Methods Division, Statistics Canada, 2016.
Source: 2011 Census of Population, Statistical Registers and Geography Division, Statistics Canada.
Map 7a – Manitoba North
CMACA, EI-EIER Intersection Boundaries
Description for Map 7a – Manitoba North
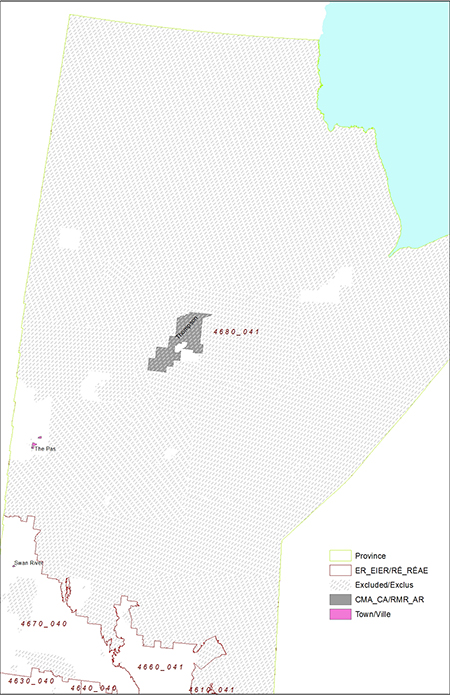
This is a reference map of the north of the province of Manitoba for the 2015 LFS design CMA\CA-ER-EIER Intersection Boundaries.
Highlights of what is displayed visually, the goal of map, text within the map:
There are a total of six ER-EIER regions displayed within the map. They are identified by their label (‘4-digit-number-ER-code’_’3-digit-number-EIER-code’). The maps also show the area associated with the CA of Thompson in the north of the province of Manitoba.
4610_041: ER of Southeast, EIER of Northern Manitoba
4630_040: ER of Southwest, EIER of Southern Manitoba
4640_040: ER of North Central, EIER of Southern Manitoba
4660_041: ER of Interlake, EIER of Northern Manitoba
4670_040: ER of Parklands, EIER of Southern Manitoba
4680_041: ER of North, EIER of Northern Manitoba
Legend:
The green line displayed on the map outlines the province of Manitoba in the north of the province. The red lines outline the ER-EIER intersection boundaries, while the grey lines outline the CMA\CA\town boundaries. The grey dots represent excluded areas, while the grey shaded areas represent CMA\CA and the pink shaded areas represent towns.
Source:
Map produced by the Labour Force Survey and Household Survey Sampling Infrastructure Methods Section, Household Survey Methods Division, Statistics Canada, 2016.
Source: 2011 Census of Population, Statistical Registers and Geography Division, Statistics Canada.
Map 7b – Manitoba South
CMACA, EI-EIER Intersection Boundaries

Description for Map 7b – Manitoba South
This is a reference map of the south of the province of Manitoba for the 2015 LFS design CMA\CA-ER-EIER Intersection Boundaries.
Highlights of what is displayed visually, the goal of map, text within the map:
There are a total of thirteen ER-EIER regions displayed within the map. They are identified by their label (‘4-digit-number-ER-code’_’3-digit-number-EIER-code’). The maps also show the areas associated with the CMA of Winnipeg, and the CA in the south of the province of Manitoba.
4610_039: ER of Southeast, EIER of Winnipeg
4610_040: ER of Southeast, EIER of Southern Manitoba
4610_041: ER of Southeast, EIER of Northern Manitoba
4620_040: ER of South Central, EIER of Southern Manitoba
4630_040: ER of Southwest, EIER of Southern Manitoba
4640_039: ER of North Central, EIER of Winnipeg
4640_040: ER of North Central, EIER of Southern Manitoba
4650_039: ER of Winnipeg, EIER of Winnipeg
4660_039: ER of Interlake, EIER of Winnipeg
4660_040: ER of Interlake, EIER of Southern Manitoba
4660_041: ER of Interlake, EIER of Northern Manitoba
4670_040: ER of Parklands, EIER of Southern Manitoba
4680_041: ER of North, EIER of Northern Manitoba
Legend:
The green line displayed on the map outlines the province of Manitoba in the south of the province. The red lines outline the ER-EIER intersection boundaries, while the grey lines outline the CMA\CA\town boundaries. The grey dots represent excluded areas, while the grey shaded areas represent CMA\CA and the pink shaded areas represent towns.
Source:
Map produced by the Labour Force Survey and Household Survey Sampling Infrastructure Methods Section, Household Survey Methods Division, Statistics Canada, 2016.
Source: 2011 Census of Population, Statistical Registers and Geography Division, Statistics Canada.
Map 8 – Saskatchewan
CMACA, EI-EIER Intersection Boundaries

Description for Map 8 – Saskatchewan
This is a reference map of Saskatchewan for the 2015 LFS design CMA\CA-ER-EIER Intersection Boundaries.
Highlights of what is displayed visually, the goal of map, text within the map:
There are a total of nine ER-EIER regions displayed within the map. They are identified by their label (‘4-digit-number-ER-code’_’3-digit-number-EIER-code’). The maps also show the areas associated with the CMA of Regina and Saskatoon, and the CA of the province.
4710_042: ER of Regina – Moose Mountain, EIER of Regina
4710_044: ER of Regina – Moose Mountain, EIER of Southern Saskatchewan
4720_044: ER of Swift Current – Moose Jaw, EIER of Southern Saskatchewan
4730_043: ER of Saskatoon - Biggar, EIER of Saskatoon
4730_044: ER of Saskatoon - Biggar, EIER of Southern Saskatchewan
4730_045: ER of Saskatoon - Biggar EIER of Northern Saskatchewan
4740_044: ER of Yorkton - Melville, EIER of Southern Saskatchewan
4750_045: ER of Prince Albert, EIER of Northern Saskatchewan
4760_045: ER of Northern, EIER of Northern Saskatchewan
Legend:
The green line displayed on the map outlines the province of Saskatchewan. The red lines outline the ER-EIER intersection boundaries, while the grey lines outline the CMA\CA\town boundaries. The grey dots represent excluded areas, while the grey shaded areas represent CMA\CA and the pink shaded areas represent towns.
Source:
Map produced by the Labour Force Survey and Household Survey Sampling Infrastructure Methods Section, Household Survey Methods Division, Statistics Canada, 2016.
Source: 2011 Census of Population, Statistical Registers and Geography Division, Statistics Canada.
Map 9 – Alberta
CMACA, EI-EIER Intersection Boundaries

Description for Map 9 – Alberta
This is a reference map of Alberta for the 2015 LFS design CMA\CA-ER-EIER Intersection Boundaries.
Highlights of what is displayed visually, the goal of map, text within the map:
There are a total of eleven ER-EIER regions displayed within the map. They are identified by their label (‘4-digit-number-ER-code’_’3-digit-number-EIER-code’). The maps also show the areas associated with the CMA of Calgary and Edmonton, and the CA of the province.
4810_049: ER of Lethbridge – Medicine Hat, EIER of Southern Alberta
4820_049: ER of Camrose - Drumheller, EIER of Southern Alberta
4830_046: ER of Calgary, EIER of Calgary
4830_049: ER of Calgary, EIER of Southern Alberta
4840_049: ER of Banff – Jasper – Rocky Mountain House, EIER of Southern Alberta
4850_049: ER of Red Deer, EIER of Southern Alberta
4860_047: ER of Edmonton, EIER of Edmonton
4860_049: ER of Edmonton, EIER of Southern Alberta
4870_048: ER of Athabasca – Grande Prairie – Peace River, EIER of Northern Alberta
4870_049: ER of Athabasca – Grande Prairie – Peace River, EIER of Southern Alberta
4880_048: ER of Wood Buffalo – Cold Lake, EIER of Northern Alberta
Legend:
The green line displayed on the map outlines the province of Alberta. The red lines outline the ER-EIER intersection boundaries, while the grey lines outline the CMA\CA\town boundaries. The grey dots represent excluded areas, while the grey shaded areas represent CMA\CA and the pink shaded areas represent towns.
Source:
Map produced by the Labour Force Survey and Household Survey Sampling Infrastructure Methods Section, Household Survey Methods Division, Statistics Canada, 2016.
Source: 2011 Census of Population, Statistical Registers and Geography Division, Statistics Canada.
Map 10a – British Columbia North
CMACA, EI-EIER Intersection Boundaries

Description for Map 10a – British Columbia North
This is a reference map of the north of the province of British Columbia for the 2015 LFS design CMA\CA-ER-EIER Intersection Boundaries.
Highlights of what is displayed visually, the goal of map, text within the map:
There are a total of eight ER-EIER regions displayed within the map. They are identified by their label (‘4-digit-number-ER-code’_’3-digit-number-EIER-code’). The maps also show the areas associated with the CA in the north of the province.
5910_054: ER of Vancouver Island and Coast, EIER of Southern Coastal British Columbia
5910_055: ER of Vancouver Island and Coast, EIER of Northern British Columbia
5920_054: ER of Lower Mainland - Southwest, EIER of Southern Coastal British Columbia
5930_050: ER of Thompson - Okanagan, EIER of Southern Interior British Columbia
5950_055: ER of Cariboo, EIER of Northern British Columbia
5960_055: ER of North Coast, EIER of Northern British Columbia
5970_055: ER of Nechako, EIER of Northern British Columbia
5980_055: ER of Northeast, EIER of Northern British Columbia
Legend:
The green line displayed on the map outlines the province of British Columbia in the north of the province. The red lines outline the ER-EIER intersection boundaries, while the grey lines outline the CMA\CA\town boundaries. The grey dots represent excluded areas, while the grey shaded areas represent CMA\CA and the pink shaded areas represent towns.
Source:
Map produced by the Labour Force Survey and Household Survey Sampling Infrastructure Methods Section, Household Survey Methods Division, Statistics Canada, 2016.
Source: 2011 Census of Population, Statistical Registers and Geography Division, Statistics Canada.
Map 10b – British Columbia South
CMACA, EI-EIER Intersection Boundaries
Description for Map 10b – British Columbia South
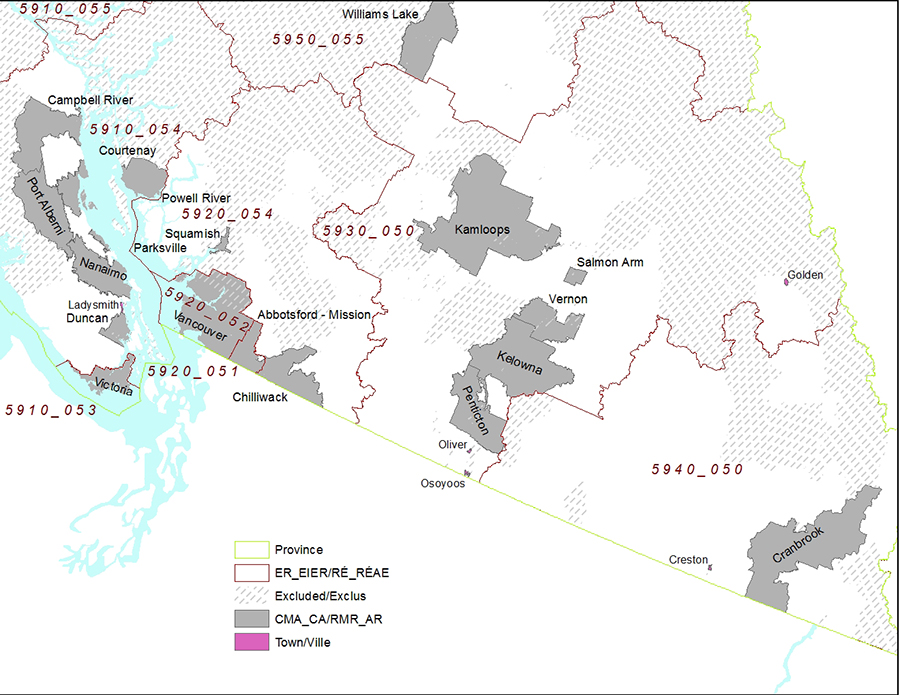
This is a reference map of the south of the province of British Columbia for the 2015 LFS design CMA\CA-ER-EIER Intersection Boundaries.
Highlights of what is displayed visually, the goal of map, text within the map:
There are a total of nine ER-EIER regions displayed within the map. They are identified by their label (‘4-digit-number-ER-code’_’3-digit-number-EIER-code’). The maps also show the areas associated with the CMA of Abbotsford – Mission, Kelowna, Vancouver and Victoria, and the CA in the south of the province.
5910_053: ER of Vancouver Island and Coast, EIER of Victoria
5910_054: ER of Vancouver Island and Coast, EIER of Southern Coastal British Columbia
5910_055: ER of Vancouver Island and Coast, EIER of Northern British Columbia
5920_051: ER of Lower Mainland - Southwest, EIER of Abbotsford
5920_052: ER of Lower Mainland - Southwest, EIER of Vancouver
5920_054: ER of Lower Mainland - Southwest, EIER of Southern Coastal British Columbia
5930_050: ER of Thompson - Okanagan, EIER of Southern Interior British Columbia
5940_050: ER of Kootenay, EIER of Southern Interior British Columbia
5950_055: ER of Cariboo, EIER of Northern British Columbia
Legend:
The green line displayed on the map outlines the province of British Columbia in the south of the province. The red lines outline the ER-EIER intersection boundaries, while the grey lines outline the CMA\CA\town boundaries. The grey dots represent excluded areas, while the grey shaded areas represent CMA\CA and the pink shaded areas represent towns.
Source:
Map produced by the Labour Force Survey and Household Survey Sampling Infrastructure Methods Section, Household Survey Methods Division, Statistics Canada, 2016.
Source: 2011 Census of Population, Statistical Registers and Geography Division, Statistics Canada.
- Date modified: