

 |
|
 |                |
Information identified as archived is provided for reference, research or recordkeeping purposes. It is not subject to the Government of Canada Web Standards and has not been altered or updated since it was archived. Please "contact us" to request a format other than those available.
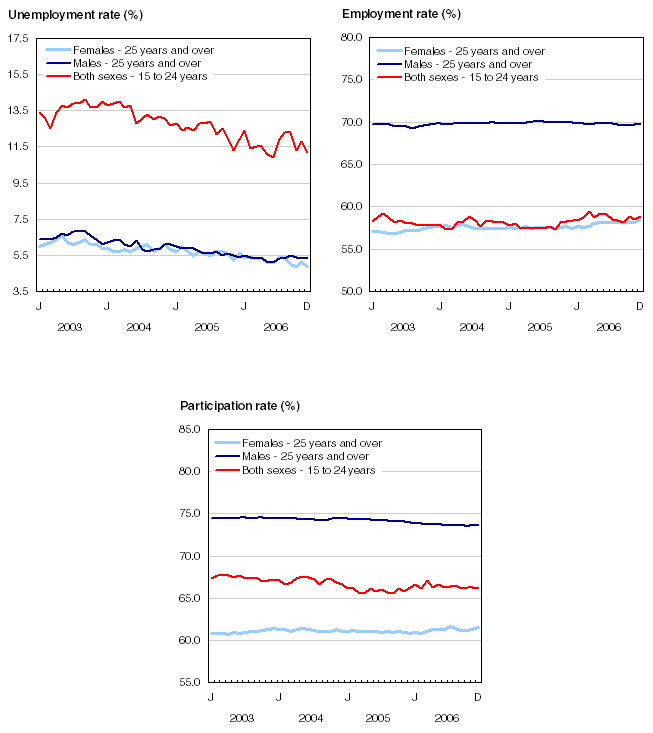
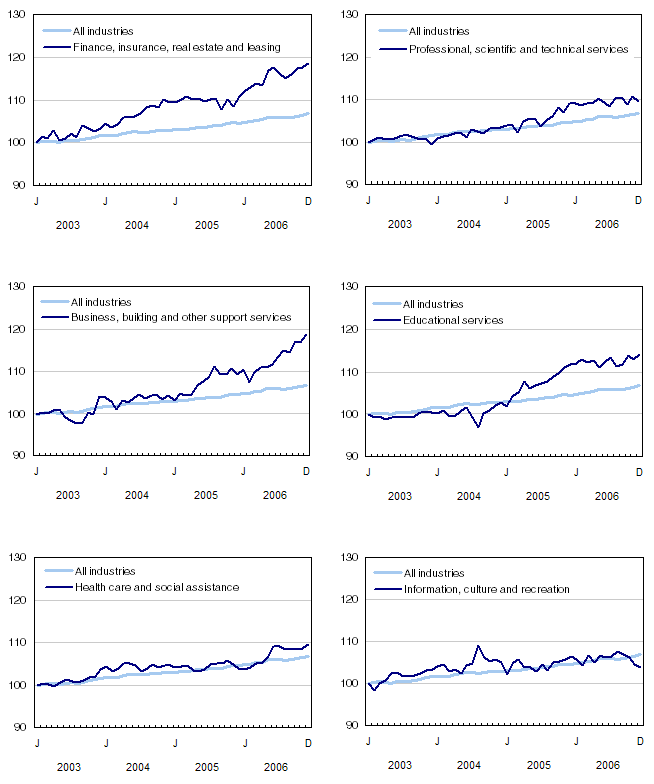
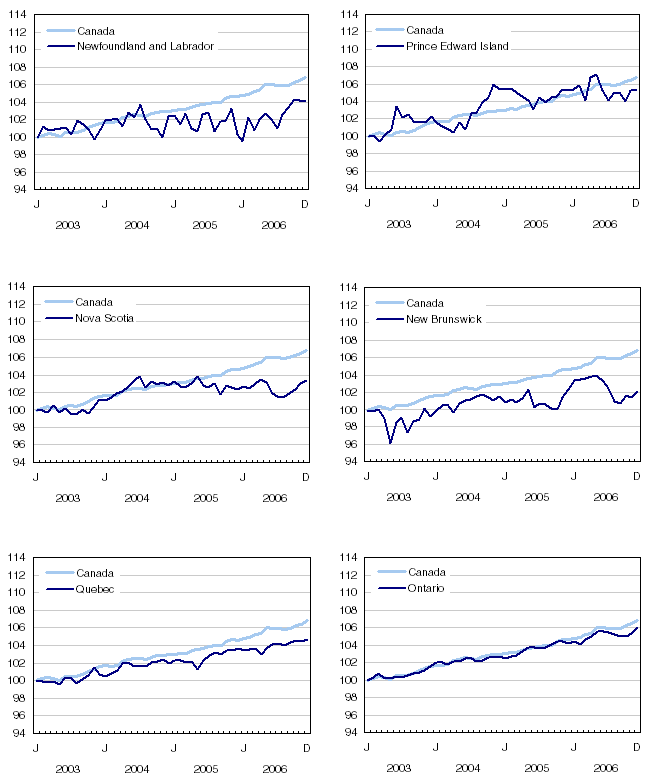
| Labour Force Information Not for release before 7 A.M. E.S.T. Friday, January 5, 2007 December 3 to 9, 2006 Analysis — December 2006 Employment increased by an estimated 62,000 in December, pushing the unemployment rate back down to the 30-year low of 6.1% (-0.2 percentage points). In 2006, employment grew by 2.1% (+345,000), the highest growth rate since 2002. This is the fourteenth consecutive year of employment increases in Canada. Alberta surged ahead in employment growth in 2006, charting its largest growth rate in 26 years (+6.0%). Saskatchewan, Newfoundland and Labrador, and British Columbia also finished the year above the national employment growth rate. Over the course of 2006, seven provinces hit record high employment rates while six reached 30-year record low unemployment rates. There were increases in both full and part-time employment in December. However, in 2006, employment growth was driven by full time, which accounted for an estimated 80% of employment gains. With continued strength in employment, average hourly wages stood at an estimated $20.00 in December 2006, an increase of 2.6% from 12 months ago. Alberta’s tight labour market continued to put pressure on the province’s wages, which rose 5.9% from a year ago to $21.60, the highest growth rate in the country. Alberta surpassed Ontario throughout 2006 for the highest hourly wages. Employment increased in several industries in 2006, including natural resources; business, building and other support services; finance, insurance, real estate and leasing; health care and social assistance; ‘other services’ and construction. There were declines in manufacturing and information, culture and recreational services. In 2006, almost two-thirds of all the employment gains were among
adult women. The proportion of women aged 25 and over who were working
hit a record high in December 2006. This brought their unemployment rate
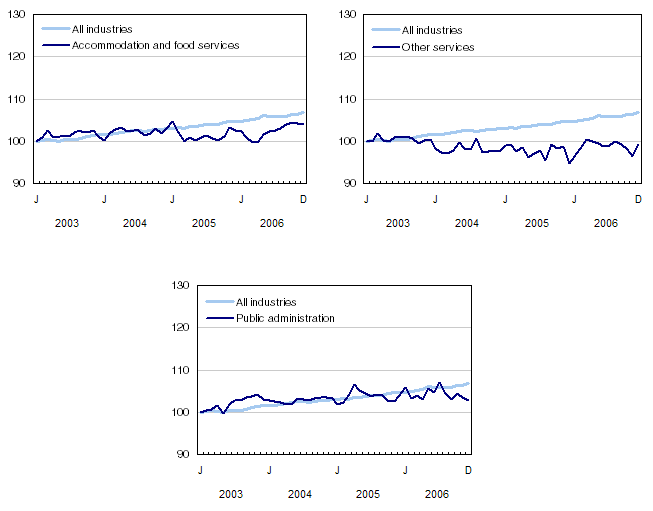
to a After two years of declines, the participation rate increased slightly in 2006, entirely due to increased participation among adult women. More working in Ontario in December, but not enough to push growth for the province above national average in 2006 In Ontario, employment increased by an estimated 42,000 in December, bringing total gains for the year to 1.8% (+113,000). Most of this province’s employment gains in 2006 were in the service sector, including health care and social assistance, trade and ‘other services’, while declines in manufacturing continued. Since the peak in November 2002, manufacturing declines in the province have totalled 130,000 (-11.6%). Although a substantial loss, this is still only half of the previous decline of the early 1990s recession, when factory employment in Ontario fell by 24.4% (-260,000). Unlike the national trend towards more full-time gains in 2006, almost two-thirds of Ontario’s employment increases were in part time. The unemployment rate for this province ended the year at 6.1%, similar to the rate of 12 months ago. In Quebec, there were fewer people searching for work in December, bringing the unemployment rate to a 30-year low of 7.5%. Over the course of 2006, there were employment gains in finance, insurance, real estate and leasing; business, building and other support services; transportation and warehousing; and professional, scientific and technical services. However, declines in manufacturing and construction dampened overall growth. This left employment up only 0.9%, less than half the national growth rate. The West shines in 2006 Despite a pause in December, Alberta’s employment rose substantially for the year (+6.0% or 109,000), its largest rate of growth since 1980. Although Alberta represents only 10% of working-age Canadians, it accounted for almost one-third of all employment growth in 2006. Gains varied across the goods and service sectors, with above average growth in natural resources; manufacturing; construction; educational services; health care and social assistance; and accommodation and food services. Employment in Saskatchewan was up an estimated 3,000 in December, bringing total gains for the year to 23,000 (+4.8%). December’s employment growth also boosted the employment rate to a record high of 67.4%. Saskatchewan followed Alberta (70.9%) with the second-highest proportion of their working-age population employed. Saskatchewan’s employment gains in 2006 were mainly in trade; construction; professional, scientific and technical services; natural resources; and agriculture. British Columbia also had employment gains in December (+10,000), which brought year-to-date growth to 51,000 (+2.4%). In December 2006, 62.7% of British Columbia’s working-age population was employed, a record high. Over the year, employment gains in natural resources, manufacturing; construction; business, building and other support services; finance, insurance, real estate and leasing; educational services and health care and social assistance more than offset losses in information, culture and recreation; trade; and accommodation and food services. Unemployment rates in the West continued to be below that of the national average throughout 2006. Although there was little change in employment in Newfoundland and Labrador in December, employment was up 3.8% (+8,000) from 12 months ago. This is the largest employment increase since 2001 for this province, moving their employment rate up 2.8 percentage points to 51.3% by December 2006. Employment growth was spread across several goods and service industries. Strength spread across several industries in 2006 There was strong employment growth across a number of industries in Canada in 2006: natural resources (+10.9%); business, building and other support services (+8.8%); finance, insurance, real estate and leasing (+6.9%); health care and social assistance (+5.8%); ‘other services’ (+4.8%) and construction (+3.5%). However, there was continued weakness in manufacturing (-2.7%) and declines in information, culture and recreational services (-2.6%). Although there was no change in employment in natural resources in December, this industry has shown remarkable strength in the last year (+34,000). This continues a trend that began four years ago. Most of this growth has come from Alberta in the mining, oil and gas sector. British Columbia also contributed to the 2006 growth in mining, oil and gas as well as in forestry and logging. There was an employment increase of 12,000 in business, building and other support services in December. This brings total gains for the year to 58,000, and follows strong growth from the previous year. While there was little change in finance, insurance, real estate and leasing in December, employment was up by 69,000 since December 2005, mostly in real estate and leasing. Employment increased by an estimated 15,000 in health care and social assistance in December, which brought total gains to 100,000 in 2006. Each province had employment increases in this industry, but the largest were in Ontario and the western provinces. Employment also increased in ‘other services’ in December (+20,000), bringing employment gains for the year to 32,000, with most of the increase in Ontario. Although construction employment was up for the year (+37,000), the growth rate was only about half that of the previous two years. The majority of growth in 2006 was in Alberta and British Columbia. Manufacturing employment declined by 2.7% (-59,000) in 2006, bringing total losses since the start of the decline in November 2002 to 9.0% (-216,000). In 2006, the losses were primarily in Ontario and Quebec. In contrast, large gains in manufacturing were seen in Alberta, British Columbia and Manitoba over the course of the year (+32,000). Information, culture and recreational services also saw large declines in 2006 (-19,000), driven primarily by weakness in British Columbia. Self-employment increased by 49,000 in December. Despite this jump, there were fewer self-employed workers in 2006 than the previous year. Most of the employment growth in 2006 was among private sector employees (+3.1% or 332,000), three times the rate of growth for the public sector. Growth in full time and for adult women in 2006 December’s employment increase was in both full time (+37,000) and part time (+25,000). Although the vast majority of gains in 2006 were full time (+278,000 or 2.1%), part-time employment was also up 2.3% (+67,000). Employment was up an estimated 36,000 for adult women in December, with total gains of 215,000 (+3.4%) in 2006, most of which were full time. By comparison, employment among adult men was up only 1.3% (+93,000). The proportion of adult women who were working hit a record high of 58.5% in December 2006. This brought their unemployment rate to a 30-year low of 4.9%, lower than that of adult men at 5.3%. With an increase of 15,000 in December, youth employment was up 1.4% or 36,000 over the year. This follows a similar growth rate for the previous two years. The youth unemployment rate, at 11.2% in December 2006, has been steadily declining, approaching its lowest rate since 1989. Annual averages The analysis presented above describes labour market trends in 2006 by looking at the change in estimates from December 2005 to December 2006. This indicator picks up the more recent labour market trends for the year but can be influenced by unusual spikes or declines in the end points used to calculate the change. An alternative indicator of labour market trends is the annual average,
which is an average of the 12 months of the year and is usually
compared with the
Yukon and Northwest Territories’ annual average unemployment rates as low as western provinces Among the territories, only Nunavut recorded annual employment growth in 2006 compared to 2005 (+700 or 9.3%), pushing their annual average unemployment rate down to an estimated 10.3% in 2006 (-2.2 percentage points). The Yukon’s annual average unemployment rate declined to 4.3%        |
||||||||||||||||||||||||||||||||||||||||||||||||||||||||||||||||||||||||||||||||||||||||||||||||||||||||||||||||||||||||||||||||||
|
|
|