
Prices Analytical Series:
From Shelf to Statistic: An Overview of Food Price Measurement in the Consumer Price Index
Skip to text
Text begins
Introduction
The Consumer Price Index (CPI) is Canada’s official measure of inflation, designed in accordance with international standardsNote used by national statistical organizations around the world. Measured over time, the CPI uses a fixed basket of consumer goods and services of unchanging or equivalent quantity and quality to reflect pure price change, known as inflation.
Food is an essential purchase for Canadian households and has been a key driver of inflation in recent years. Reflecting this importance, the food component is the second largest of eight major components that make up the CPI, with a basket weight of 16.65% (May 2023 link month), meaning, Canadians allocate, on average, the second largest portion of their budget towards food purchases.
This technical paper describes the collection of food price data and the methodologies that are utilized to provide Canadians with accurate and timely food inflation data in both the CPI and the monthly average retail prices table.Note
CPI basket weights
The CPI uses a fixed basket of consumer goods and services to reflect consumer price change over time. CPI basket weights represent the share of overall spending by Canadian households - in other words, how much Canadians spend on a good or service relative to the other consumer goods and services they purchase. The food component, which makes up 16.65% of the CPI basket (May 2023 link month), is comprised of food purchased from stores (11.04% of the basket) and food purchased from restaurants (5.61%).
Basket weightsNote provide the relative importance of different products and services as well as geographical regions. As a result, grocery items with higher weights have more impact on the CPI when their prices change. For example, meat (2.07%) has a higher weight than butter (0.10%) because Canadians, collectively, allocate more of their grocery spending to meat than to butter.Note As a result, a change in meat prices will have a larger impact on the food index and the all-items CPI compared with an equivalent price change for butter. This is also true geographically; because of its larger population, food prices in Ontario have a larger impact on the all-items CPI compared with food prices in Prince Edward Island.
Statistics Canada conducts annual basket reviewsNote to modify the current basket weight and classification structure of the CPI to ensure they best align to current Canadian consumption trends. For example, the classification structure was revised during the 2023 CPI basket update to add more granular price information for fruits and vegetables. Similar enhancements are planned for the upcoming 2024 basket update.
Representative products
Representative products correspond to the most frequently purchased items among Canadian households. Representative products are goods and services that Canadian households buy and for which prices are collected for CPI calculation (e.g., broccoli, cheddar cheese, peanut butter). Price change for these products represents price change for the broader category they are classified within.
Each month, prices for nearly 200 food representative productsNote are collected. Different types of products are collected within categories to ensure broad coverage of the items consumers buy. For example, prices are collected for whole wheat bread, white bread, and multi-grain bread, among others. Statistics Canada also collects a mix of representative brands of food products, including both name brands and house brands, where possible.
As consumer preferences change over time, representative products are updated accordingly. For example, products such as tofu, almond milk, plant-based burgers, and plant-based sausage were added to the CPI due to increased consumer expenditures in recent years. Expanding the number of representative products used to calculate the CPI is one way Statistics Canada is enhancing the CPI to ensure it remains relevant and accurate.
Food price data collection
Statistics Canada has modernized price collection methodologies by increasing the usage of alternative data sources.Note Food prices are now mostly obtained directly from grocery retailers across Canada by way of scanner data, also known as point-of-sale data. Scanner data is the highest-quality price data available as it tracks actual prices paid by Canadians at the till, including sales and promotions, and it also provides information on quantities sold. On a monthly basis, tens of thousands of food price data points, based on millions of transactions, are collected via scanner data from multiple grocery retailers and their subsidiary grocery outlets across Canada and shared with Statistics Canada. These are the best data available for grocery prices.
While the majority of the grocery market is priced using scanner data, the remainder of the market is also covered. Prices from retailers for which Statistics Canada does not receive scanner data are priced online from websites or flyers. Currently, food price data is collected from nearly 500 grocery retail outlets across Canada, with prices being collected in every province and the three territorial capital cities.
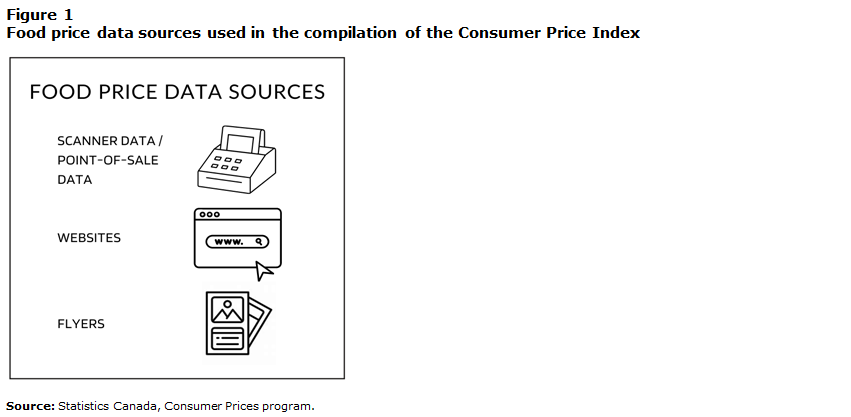
Description for Figure 1
Food price data sources:
- scanner data/ point of sale data
- websites
- flyers
Product substitution, standardization, and quality adjustment
The CPI’s matched-model methodology ensures that prices for the same products are compared over time. For example, the price of the same jar of peanut butter, from the same grocery store, is collected and compared over time. The CPI data acquisition methodology also verifies whether a product substitution is required or if a quality or quantity adjustment is needed for a food item.
If a product substitution is required because a food item is out of stock, price data for a very similar product is collected in its place. For example, if the jar of peanut butter that is usually priced is out of stock, the price of a different brand of peanut butter could be substituted for one month. After two consecutive months of price collection for a substituted product, the price change of the new jar of peanut butter can be permanently included in the CPI, because two months of prices are needed to measure a price change. To ensure continuity of product price collection, substitutions may be made. This methodology ensures the CPI excludes any portion of price change that is due to differences in the two products. This approach allows for the measurement of pure price change, even if certain items become temporarily, or permanently, unavailable.
The CPI standardizes and adjusts for quantity and quality changes, which ensures pure price change is measured. This means that if the package size of an item becomes smaller – known as shrinkflationNote – the CPI will capture this change and track it as a price increase, all else equal. All products, irrespective of size, are collected based on availability, and then these products are standardized to a specific unit level.
Average prices table versus CPI
The monthly average retail prices table provides the average retail price paid by consumers in a given month in dollars. There is a different release schedule for the CPI and monthly average retail prices table as the monthly average retail prices table uses an entire month of scanner data while the CPI uses two weeks of scanner data alongside website and flyer price data. The monthly average retail prices are calculated using a weighted average based on scanner data, similar to the data used for CPI calculation, but they are compiled and calculated differently. Central methodological differences between the CPI and the monthly average retail prices are:
- While the CPI covers the entire grocery market, including retailers for which scanner data is not available, the average prices table includes only prices obtained from scanner data.
- The composition of a given product category (weights, stores, brands) is held constant month to month in the CPI, while average price data immediately reflects changes in the purchasing patterns of consumers as they shift their spending across stores, items and brands.
- The CPI has more requirements surrounding pure price change, meaning that prices are controlled for quality and quantity differences and those specifications are held constant over time.
Because of the methodological differences, the average prices table does not necessarily compare the same product from month to month, and therefore should be used with caution when making longitudinal comparisons. As Canada’s official measure of inflation, the CPI remains the best indicator to compare prices over time.
Conclusion
As Canada’s national statistical organization, Statistics Canada is committed to sharing our knowledge and expertise to assist Canadians in understanding and interpreting our data by explaining sources and methods in a transparent manner.
The accuracy of the CPI is directly related to the quality of the price data obtained and utilized. Statistics Canada’s point-of-sale food data is the gold standard in food price collection, which means that food prices in the CPI are the most accurate food prices in the country. The CPI is designed in accordance with international standards used by national statistical organizations around the world and overseen by an independent expert advisory committee that reviews its methodology to ensure the ongoing quality of the CPI, Canada’s official measure of inflation.
- Date modified: