
An Analysis of the 2023 Consumer Price Index Basket Update, Based on 2022 Expenditures
Skip to text
Text begins
Introduction
The Consumer Price Index (CPI) is one of the most widely known, cited and used economic indicators in Canada. The CPI tracks changes in the prices experienced by Canadian consumers by comparing, through time, the cost of a fixed basket of goods and services. It is Statistics Canada’s measure of consumer price inflation, providing insight into overall economic conditions and often used for indexation and contract escalation.
Start of text box 1
Private and public pension programs, income tax deductions, and some government social payments are adjusted using the CPI. The index is used as a deflator of various economic aggregates to obtain estimates at constant prices. The CPI is also a tool for setting and monitoring economic policy. For example, the Bank of Canada uses the CPI and special aggregates of the CPI, among other measures, for this purpose.
End of text box 1
As a Laspeyres-typeNote price index, the CPI basket quantities are fixed to the reference period of the basket weights, which are used to estimate consumer expenditures for upper-level aggregation. The larger the basket weight of a given aggregate in the CPI basket, the more a price change in that aggregate will impact the headline CPI.
Basket weights were derived primarily using consumer expenditures from the 2022 national Household Final Consumption Expenditure (HFCE)Note series, replacing those derived from the 2021 national HFCE series. Household expenditures reported in the Survey of Household Spending (SHS) continued to be used to supplement the HFCE expenditure data, mainly providing expenditure detail at lower levels of aggregation, including geographic aggregation. Additional data sources were used to better inform expenditure weights for specific aggregates, or where HFCE or SHS data were unavailable. The updated basket weights reflect the highest quality expenditure data available, while still meeting timeliness requirements. Examples of additional data sources include:
- Retail scanner data
- Monthly Retail Trade Survey
- Office of the Superintendent of Financial Institutions
- New Housing Price Index annual weights
- Air transportation passenger and revenue data
- Tourism indicators
- Inter-Urban Transit Survey
- Streaming and cable service usage reports
- Goods and services tax
- Retail Commodity Survey
- Canada Mortgage and Housing Corporation
- Canadian Real Estate Association
- New Motor Vehicle Sales Survey
- Monthly Urban Transit Survey
- Tuition enrolment
- Annual Survey of Real Estate Agents, Brokers, Appraisers and Other Real Estate Activities
- Housing Market Stats in Multiple Listings Services
- Vehicle Fuel Consumption Data
- Cellular Data Subscription Data
The May 2023 CPI, released on June 27, will mark the introduction of updated basket weights in the calculation of the index. The 2023 basket update using 2022 expenditures will replace the 2021 expenditures that were introduced in June 2022.
Importance of updating the basket weights
The CPI is a weighted average of the price changes of a fixed basket of goods and services, based on the expenditures of a target populationNote in a given reference period. In order to be representative of the price change experienced by Canadians, the basket weights must be representative of how Canadians are spending their money. Typically, spending patterns change slowly and do so largely in response to shifts in prices, income levels, demographic changes, evolving habits and the availability of new technology. New products and services are introduced to the market and existing ones may be modified or become obsolete. A fixed-basket price index, such as the CPI, can only reflect changes in consumer expenditures when the CPI basket weights are updated. Under normal economic circumstances, these changes are minimized by scheduling basket updates at regular intervals.
In addition to the review of the expenditure weights, a basket update is also an opportunity to review and update other aspects of the indices. This includes changing the CPI classification to make it more representative of consumer spending and the products and services available for purchase. Moreover, a basket update is an opportunity to review and update the sample of prices collected, review price index estimation methodologies, and update documentation and dissemination products, although these activities are not limited to basket updates.
Weight reference period
In general, spending that began to gradually shift back towards pre-pandemic patterns in 2021 continued and were more pronounced in 2022, with several sectors inching closer to pre-pandemic basket weight shares. While there were some restrictions and regulations on capacity limitations for in-person shopping and services throughout Canada in the first quarter of 2022, restrictions were lifted, and the economy fully reopened in the second quarter. Household expenditures, in current dollars, increased in all eight major components of the CPI in 2022 compared to 2021, as the easing of COVID-19 pandemic-related restrictions continued. Spending on transportation, travel and dining outNote recovered to a greater extent in 2022 compared to 2021 as travel restrictions eased. More Canadians also adapted to hybrid workNote —working some hours at home and some in the office—as opposed to working at home full-time. Additionally, Russia’s invasion of Ukraine put upward price pressure on some commodities such as gasoline and wheat-based food products like pasta and cereal products, increasing consumer expenditures on these goods. Future basket updates will allow the CPI to continue to adjust to new post-pandemic economic realities.
While consumer spending patterns continue to evolve, the 2022 expenditure weights better reflect current consumer behaviour as Canadians adapt to a new normal.
Composition of CPI basket
Each good or service in the CPI basket are assigned a basket share that is proportional to the consumption expenditure for which they account. For example, 16.94% of total consumer expenditures in scope of the CPI was spent on transportation-related goods and services, leading to a 16.94% weight for transportation in the 2022 CPI basket. The weights of goods and services play an important role in determining the impact of a given item’s price change on the CPI. For instance, Canadians, on average, spend a much larger share of their total expenditures on gasoline than on eggs. As a result, a 10% price increase in gasoline prices will have a greater impact on the all-items CPI than an equivalent increase in the price of eggs.Note
The CPI classification of goods and services is organized according to a top-down hierarchical structure (see diagram below). At the top of the structure is the all-items CPI, which contains eight major components. Below the eight major components are intermediate level aggregates, such as owned accommodation and operation of passenger vehicles, which, along with the major components, provide insight into the sources of monthly and annual price change. There are 187 basic aggregates.Note These basic aggregates, such as gasoline or rent, are typically the result of aggregating one or more elementary aggregates, many of which are unpublished.

Description for Figure 1
The Consumer Price Index classification is organized according to a top-down hierarchical structure, depicted in a pyramid chart with five levels.
- At the first level, or the top of the pyramid, is the “All-items Consumer Price Index”.
- Below at the second level of the pyramid are the eight major components which are:
- Food;
- Shelter;
- Household operations, furnishings and equipment;
- Clothing and footwear;
- Transportation;
- Health and personal care;
- Recreation, education and reading;
- Alcoholic beverages, tobacco products and recreational cannabis.
- At the third level of the pyramid there are “Intermediate level aggregations”.
- At the fourth level of the pyramid there are “187 basic aggregates”.
- At the fifth and lowest level of the pyramid there are “490 elementary aggregates”.
Elementary aggregates are added or deleted from the basket as consumption patterns change over time. DVD players, for instance, were removed from the 2023 basket as they have become less popular with consumers following the advent of streaming services and subsequently contributed to a smaller portion of overall expenditures. Conversely, charcoal barbecues and snow removal equipment were added to the 2023 basket. At the elementary aggregate level, the classification includes a sample of items that are chosen to characterize all products in that class. Representative productsNote are chosen with emphasis on items that are widely available and known to be among the most popular with consumers, ensuring that the items selected are representative of the purchases consumers actually make. The number of representative products assigned to an elementary aggregate can vary based on the basket weight of the aggregate, as well as the price variability and heterogeneity of products in that class. For instance, when pricing certain dry grocery products such as pasta, representative products typically include both brand-name and store-brand items. In contrast, there is only one representative product priced under the bananas aggregate.
Table 2 in the appendix provides additional details on the CPI major components, including the basket weights, the number of elementary product classes and the total basket weight of the elementary aggregates that correspond to services.
Overview of the 2023 basket update based on 2022 expenditures
With the introduction of the 2022 basket weights, some existing elementary aggregates were made basic aggregates to provide Canadians with more granular data. Previously classified as elementary aggregates in the other fresh fruit category, citrus (excluding oranges), grapes, and berries (including cherries) will now be published as basic aggregates under fresh fruit.
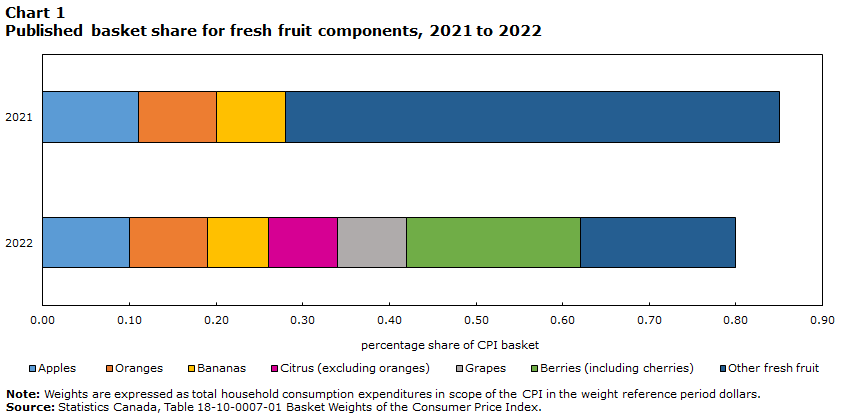
Data table for Chart 1
| 2021 | 2022 | |
|---|---|---|
| percentage share of CPI basket | ||
| Apples | 0.11 | 0.10 |
| Oranges | 0.09 | 0.09 |
| Bananas | 0.08 | 0.07 |
| Citrus (excluding oranges) | 0.00 | 0.08 |
| Grapes | 0.00 | 0.08 |
| Berries (including cherries) | 0.00 | 0.20 |
| Other fresh fruit | 0.57 | 0.18 |
|
Note: Weights are expressed as total household consumption expenditures in scope of the CPI in the weight reference period dollars. Source: Statistics Canada, Table 18-10-0007-01 Basket Weights of the Consumer Price Index. |
||
Similarly, carrots, onions, peppers, cucumber and mushrooms will be published as basic aggregates under fresh vegetables. Previously these products were included in the other fresh vegetables index.
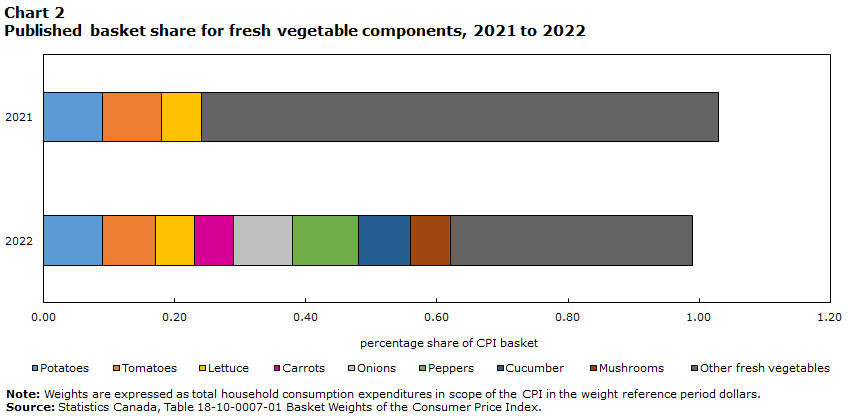
Data table for Chart 2
| 2021 | 2022 | |
|---|---|---|
| percentage share of CPI basket | ||
| Potatoes | 0.09 | 0.09 |
| Tomatoes | 0.09 | 0.08 |
| Lettuce | 0.06 | 0.06 |
| Carrots | 0.00 | 0.06 |
| Onions | 0.00 | 0.09 |
| Peppers | 0.00 | 0.10 |
| Cucumber | 0.00 | 0.08 |
| Mushrooms | 0.00 | 0.06 |
| Other fresh vegetables | 0.79 | 0.37 |
|
Note: Weights are expressed as total household consumption expenditures in scope of the CPI in the weight reference period dollars. Source: Statistics Canada, Table 18-10-0007-01 Basket Weights of the Consumer Price Index. |
||
As greater access to data has become available, the cellular services index and associated weights will now be published at the provincial level in addition to the national level.
Various elementary aggregates under the homeowners' maintenance and repairs index were streamlined to reduce unnecessary detail at the lowest levels of aggregation, with no changes to the goods and services priced under this series.
The basic aggregate telephone equipment, which included home telephones used with land lines, will no longer be part of the classification structure and is no longer included in the expenditure weights.
Below the basic aggregate level, new product classes were added to reflect the evolving consumption patterns of Canadians. Elementary aggregates DVD players, DVD recorders and video cameras were deleted from the basic aggregate video equipment and are no longer included in the expenditure weights.
| Product class | Parent index | Type of aggregate | Added | Deleted |
|---|---|---|---|---|
| Telephone equipment | Communications | Basic aggregate | Not added |
✓ Deleted |
| Charcoal barbecues | Barbecues | Elementary aggregate | ✓ Added |
Not deleted |
| Small appliances for food and beverage preparation | Cooking appliances | Elementary aggregate | ✓ Added |
Not deleted |
| Snow removal equipment | Household tools (including lawn, garden and snow removal equipment) | Elementary aggregate | ✓ Added |
Not deleted |
| Infant and baby hygiene products | Other personal care supplies and equipment | Elementary aggregate | ✓ Added |
Not deleted |
| DVD players | Video equipment | Elementary aggregate | Not added |
✓ Deleted |
| DVD recorders | Video equipment | Elementary aggregate | Not added |
✓ Deleted |
| Video cameras | Video equipment | Elementary aggregate | Not added |
✓ Deleted |
| Source: Statistics Canada, Consumer Prices Division. | ||||
The continuity of the CPI series is maintained by chain linkingNote the corresponding indices obtained from consecutive baskets. This is done separately for each aggregate series, which is defined as the intersection of a commodity and a geographic area.
The current index base period for the all-items CPI remains 2002=100 for the 2023 basket update based on 2022 weight reference period. The index reference period or index base period is the period in which the index is set to equal 100. For the CPI, the index base period is usually a calendar year expressed as “index year=100”.
Update to basket weights
Considerations
Expenditure share is a relative measure. Basket weight changes are a function of the expenditure growth within a given category, as well as the growth rate of all other expenditures in scope of the CPI. Between periods, the basket share for a given good or service may either increase, decrease or remain unchanged, corresponding with the change in the proportion of overall expenditures between the 2021 and 2022 reference years. A basket share that is declining, for instance, might reflect a rate of growth in expenditures in that category which was less than the rate of growth of the overall expenditures. For example, although consumer spending on shelter increased in 2022, the basket share for shelter decreased.
Given that basket shares are rounded and published at the second decimal place, minute changes in expenditure share may not be apparent. Basket share changes of smaller magnitudes are, however, accounted for in the CPI, as full-precision expenditure weights are used in its calculation.
Statistics Canada publishes two sets of basket weights for the CPI: weights at basket reference period prices and weights at basket link month prices. Weights at basket reference period prices are calculated for each reference period separately based on expenditure shares. Weights at basket link month prices are obtained by price-updating the weights at basket reference period prices to obtain the hybrid expenditures expressed at prices of the link month. Price-updating is a procedure whereby the quantities of an earlier period are revalued at the prices of a later period. The result is hybrid expenditure weights. This procedure is necessary in order to hold quantities constant when expenditures (not quantities) are the only source of data available for deriving basket weights.Note The following analysis focuses on weights at basket reference period prices, as this best reflects the actual change in relative expenditures between basket reference periods.
Analysis of basket weights
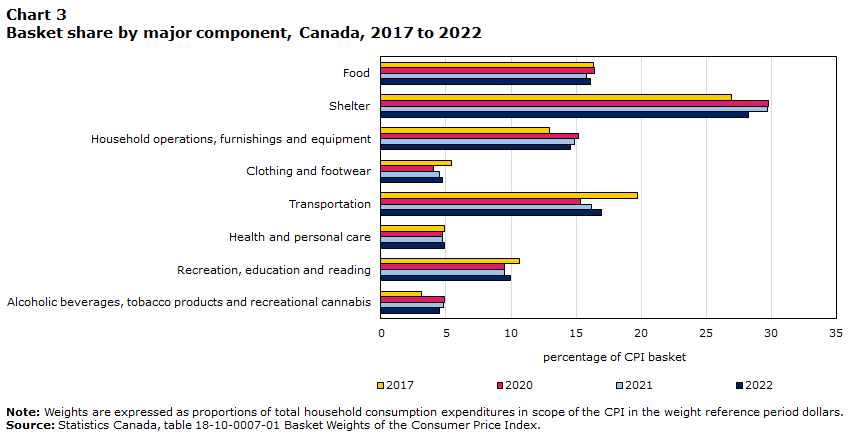
Data table for Chart 3
| 2017 | 2020 | 2021 | 2022 | |
|---|---|---|---|---|
| percentage of CPI basket | ||||
| Food | 16.31 | 16.44 | 15.75 | 16.13 |
| Shelter | 26.92 | 29.78 | 29.67 | 28.22 |
| Household operations, furnishings and equipment | 12.98 | 15.21 | 14.84 | 14.57 |
| Clothing and footwear | 5.39 | 4.08 | 4.52 | 4.77 |
| Transportation | 19.72 | 15.34 | 16.16 | 16.94 |
| Health and personal care | 4.86 | 4.76 | 4.74 | 4.92 |
| Recreation, education and reading | 10.66 | 9.53 | 9.52 | 9.98 |
| Alcoholic beverages, tobacco products and recreational cannabis | 3.16 | 4.86 | 4.79 | 4.47 |
|
Note: Weights are expressed as proportions of total household consumption expenditures in scope of the CPI in the weight reference period dollars. Source: Statistics Canada, table 18-10-0007-01 Basket Weights of the Consumer Price Index. |
||||
While expenditures increased in all eight major components, resulting basket shares decreased in three major components and grew in five. The shelter component saw the largest reduction in basket share, falling from 29.67% to 28.22%. The alcoholic beverages, tobacco products and recreational cannabis component decreased to 4.47% and was surpassed in importance by health and personal care (4.92%). The basket share for the household operations, furnishings and equipment component also shrank to 14.57%.
For the second consecutive year, the relative weight of the transportation component increased the most among the major components, from 16.16% in 2021 to 16.94% in 2022. The basket share for recreation, education and reading also rose from 9.52% to 9.98%. The food component expanded to 16.13% and the basket share for clothing and footwear component grew to 4.77%.
As the Canadian economy opened with little to no COVID-19 restrictions in the second quarter of 2022, the shifts in basket weights reflected consumer behaviour rebounding toward pre-pandemic spending levels. As spending on hard-to-distance in-person services (e.g. dining out) and travel continued to recover in 2022, expenditures in these sectors increased, resulting in smaller shares of spending on household furnishings and equipment. Chart 3 (above) shows how pandemic shifts in spending behaviour have lessened in 2022.
The decline in basket share for shelter was largely due to decreases in other owned accommodation expenses (3.06%), including real estate commissions and legal fees, and homeowners’ replacement cost (5.64%). These declines reflected the general cooling of the housing market in the second half of 2022. Moderating the decrease in shelter, the weight for mortgage interest cost rose 0.35 percentage points to 3.46% amid the higher interest rate environment.Note
The relative weight of alcoholic beverages, tobacco products and recreational cannabis (4.47%) decreased by 0.32 percentage points, stemming from the weight of recreational cannabis (0.38%) which fell by 0.21 percentage points. In 2018, recreational cannabis became legal in Canada and was added to the CPI basket during the 2019 basket update (which was based on 2017 expenditure weights). At the time recreational cannabis was introduced to the CPI basket, legalization was a relatively recent development and expenditures based on the licit market were not yet available, and therefore expenditures based on the illicit market were used to estimate the basket weight. With the 2023 basket update, the illicit market expenditure will no longer be included,Note leaving only the expenditure for the licit market, as more timely and current information on the legal cannabis market has become available. Conversely, the weight of alcoholic beverages served in licensed establishments increased to 0.86% in 2022 from 0.69% in 2021.Note
Household operations, furnishings and equipment declined in importance. Consumers spent less on household appliances, the weight for which fell from 1.09% in 2021 to 0.97% in 2022, as total price-adjusted expendituresNote for major household appliances decreased in 2022 compared with 2021.Note
As economic activity continued to expand with most travel and COVID-19 safety measures removed, consumers directed a larger share of expenditures towards transportation, primarily due to increased expenditure on gasoline (4.27%). Additionally, oil prices began to rise rapidly in early 2022 because of supply uncertainty following Russia's invasion of Ukraine, contributing to higher prices and therefore higher expenditures at the pump.Note While gasoline drove the increase in transportation weights, the weights for air transportation (0.73%) also rose amid fewer flight restrictions.Note As purchases of used passenger vehicles (1.96%) represented a slightly larger share of total expenditures in 2022, the basket share of new passenger vehicles (3.59%) dropped, coinciding with a reduction in new motor vehicle salesNote as manufacturers grappled with the global shortage of semiconductor chips.
The basket share for travel services increased a whole percentage point from 0.84% in 2021 to 1.84% in 2022. After falling in 2021, the basket share for travel tours (1.25%) was up in 2022, as some barriers to international travel were lifted, such as mandatory quarantine, pre-entry COVID-19 testing and reduced travel advisories. The importance of other cultural and recreational services also rose from 1.78% to 1.88%, as consumers directed more spending towards gyms, movie theatres and live sporting events.
After decreasing in the last basket update, the food component weight increased from 15.75% to 16.13%, mainly due to a larger basket share in food purchased from restaurants (5.51%). Increased spending in both food purchased from table-service restaurants (3.24%) and from cafeterias and other restaurants (0.74%) coincided with the removal of lockdown restrictions towards the beginning of 2022. Although Canadians spent more on food purchased from stores in 2022, due to higher price levels, total price-adjusted expendituresNote for food decreased in 2022 compared with 2021,Note meaning that Canadian grocery shoppers spent more to buy less. Accordingly, the importance of food purchased from stores declined from 10.93% in 2021 to 10.62% in 2022. Some of this shift is attributable to the rebound in spending at restaurants, including day-to-day spending on food and beverages by those who returned to work in person. Higher grocery prices also impacted the spending patterns of Canadians, with many reporting that they had adjusted their spending habitsNote or accessed food banks.Note Note
The importance of clothing and footwear also increased in the 2022 basket, rising from 4.52% in 2021 to 4.77% in 2022. The basket share for both men’s (1.06%) and women’s (1.54%) clothing rose reflecting an increase in sales,Note as more Canadians returned to the office and attended events and celebrations with relaxed capacity limitations. Similarly, the importance of personal care services (0.77%), such as haircuts, also increased.
Conclusion
Statistics Canada continues to update and enhance the CPI in order to ensure it remains the highest quality measure of price change. In the 2023 basket update, weight and classification changes, informed by the most current and relevant expenditure data available, ensure that the CPI continues to be as representative as possible of price changes faced by Canadians.
Statistics Canada continues to prioritize data accuracy, quality and timeliness in measuring price change and producing a CPI that reflects the experience of Canadians. Working with price experts, other national statistical organizations and partners ensures that the data and methods used in the calculation of the CPI are aligned with international standards and best practices. The agency will continue to explore new potential sources of expenditure information for future basket updates and to adopt the most appropriate methods in order to keep the CPI relevant for Canadians.
Appendix
| Major components, selected product groups | Basket reference year | ||||||
|---|---|---|---|---|---|---|---|
| 2011 | 2013 | 2015 | 2017 | 2020 | 2021 | 2022 | |
| percent | |||||||
| Food | 16.35 | 16.07 | 16.45 | 16.31 | 16.44 | 15.75 | 16.13 |
| Food purchased from stores | 11.48 | 11.36 | 11.54 | 11.28 | 11.90 | 10.93 | 10.62 |
| Food purchased from restaurants | 4.88 | 4.71 | 4.92 | 5.03 | 4.54 | 4.82 | 5.51 |
| Shelter | 25.86 | 26.19 | 26.79 | 26.92 | 29.78 | 29.67 | 28.22 |
| Rent | 5.76 | 5.67 | 6.20 | 6.24 | 6.59 | 6.72 | 6.67 |
| Mortgage interest cost | 4.13 | 4.03 | 3.50 | 3.30 | 3.68 | 3.11 | 3.46 |
| Homeowners' replacement cost | 4.25 | 4.52 | 4.80 | 5.18 | 5.24 | 6.24 | 5.64 |
| Other owned accommodation expenses | 1.49 | 1.60 | 1.64 | 1.96 | 4.01 | 4.16 | 3.06 |
| Household operations, furnishings and equipment | 12.57 | 12.92 | 13.01 | 12.98 | 15.21 | 14.84 | 14.57 |
| Furniture and household textiles | 1.47 | 1.35 | 1.46 | 1.41 | 2.18 | 2.20 | 2.16 |
| Household equipment | 1.93 | 1.78 | 1.84 | 1.81 | 2.43 | 2.43 | 2.28 |
| Other household goods and services | 3.38 | 3.86 | 3.82 | 3.88 | 5.31 | 5.21 | 5.11 |
| Financial services | 0.68 | 1.00 | 1.14 | 1.21 | 2.40 | 2.44 | 2.44 |
| Communications | 3.31 | 3.45 | 3.51 | 3.55 | 3.03 | 2.77 | 2.79 |
| Telephone services | 2.37 | 2.42 | 2.37 | 2.39 | 1.77 | 1.50 | 1.75 |
| Internet access services | 0.78 | 0.89 | 0.97 | 1.06 | 1.07 | 1.04 | 0.83 |
| Clothing and footwear | 6.20 | 6.25 | 5.68 | 5.39 | 4.08 | 4.52 | 4.77 |
| Transportation | 20.05 | 20.01 | 19.48 | 19.72 | 15.34 | 16.16 | 16.94 |
| Private transportation | 18.06 | 17.85 | 17.42 | 17.70 | 14.61 | 15.30 | 15.61 |
| Purchase of passenger vehicles | 6.64 | 6.68 | 7.08 | 7.60 | 6.11 | 5.91 | 5.55 |
| Purchase of new passenger vehicles | Note ..: not available for a specific reference period | Note ..: not available for a specific reference period | Note ..: not available for a specific reference period | Note ..: not available for a specific reference period | Note ..: not available for a specific reference period | 3.96 | 3.59 |
| Purchase of used passenger vehicles | Note ..: not available for a specific reference period | Note ..: not available for a specific reference period | Note ..: not available for a specific reference period | Note ..: not available for a specific reference period | Note ..: not available for a specific reference period | 1.95 | 1.96 |
| Gasoline | 4.85 | 4.77 | 3.49 | 3.34 | 2.84 | 3.47 | 4.27 |
| Passenger vehicle maintenance and repairs | 1.08 | 1.17 | 1.60 | 1.54 | 0.98 | 1.02 | 1.08 |
| Passenger vehicle insurance premiums | 2.92 | 2.88 | 2.80 | 2.68 | 1.93 | 2.12 | 2.17 |
| Public transportation | 1.99 | 2.16 | 2.06 | 2.02 | 0.72 | 0.85 | 1.33 |
| Local and commuter transportation | 0.64 | 0.69 | 0.65 | 0.66 | 0.25 | 0.30 | 0.35 |
| Inter-city transportation | 1.22 | 1.34 | 1.29 | 1.23 | 0.30 | 0.37 | 0.83 |
| Air transportation | 1.14 | 1.25 | 1.19 | 1.14 | 0.26 | 0.31 | 0.73 |
| Health and personal care | 4.95 | 4.75 | 4.98 | 4.86 | 4.76 | 4.74 | 4.92 |
| Recreation, education and reading | 11.26 | 11.07 | 11.02 | 10.66 | 9.53 | 9.52 | 9.98 |
| Traveller accommodation | 1.33 | 1.12 | 1.16 | 1.13 | 0.43 | 0.54 | 0.59 |
| Travel tours | 0.95 | 1.00 | 1.25 | 1.31 | 0.48 | 0.30 | 1.25 |
| Purchase and operation of recreational vehicles | 1.40 | 1.25 | 1.13 | 0.95 | 1.57 | 1.70 | 1.66 |
| Other cultural and recreational services | 2.27 | 2.45 | 2.49 | 2.28 | 1.70 | 1.78 | 1.88 |
| Home entertainment equipment, parts and services | 0.86 | 0.61 | 0.57 | 0.40 | 1.07 | 0.95 | 0.75 |
| Video equipment | 0.46 | 0.33 | 0.30 | 0.26 | 0.66 | 0.59 | 0.43 |
| Purchase of digital media | 0.18 | 0.15 | 0.12 | 0.07 | 0.23 | 0.20 | 0.18 |
| Alcoholic beverages, tobacco products and recreational cannabis | 2.76 | 2.74 | 2.58 | 3.16 | 4.86 | 4.79 | 4.47 |
| Alcoholic beverages | 1.60 | 1.63 | 1.66 | 1.74 | 2.94 | 2.92 | 2.90 |
| Tobacco products and smokers' supplies | 1.16 | 1.11 | 0.92 | 0.87 | 1.37 | 1.29 | 1.18 |
| Cigarettes | 1.10 | 1.04 | 0.89 | 0.82 | 1.27 | 1.17 | 1.08 |
| Recreational cannabis | Note ..: not available for a specific reference period | Note ..: not available for a specific reference period | Note ..: not available for a specific reference period | 0.55 | 0.55 | 0.59 | 0.38 |
|
.. not available for a specific reference period Note: Figures may not add to 100% due to rounding. Weights are expressed as proportions of all-items CPI in the weight reference period dollars. Basket weights are at basket weight reference year price. Source: Statistics Canada, Table 18-10-0007-01 Basket Weights of the Consumer Price Index. |
|||||||
| CPI major component | Weight at basket link month pricesTable A2 Additional basket details by major component Note 1 |
Elementary product classes | Proportion of servicesTable A2 Additional basket details by major component Note 2 |
|||
|---|---|---|---|---|---|---|
| percent | number | percent | ||||
| 2021 | 2022 | 2021 | 2022 | 2021 | 2022 | |
| Food | 15.94 | 16.65 | 139 | 139 | 30.11 | 33.71 |
| Shelter | 29.80 | 28.34 | 43 | 19 | 90.43 | 90.75 |
| Household operations, furnishings and equipment | 14.50 | 14.36 | 79 | 77 | 52.00 | 53.62 |
| Clothing and footwear | 4.31 | 4.73 | 81 | 81 | 3.72 | 3.40 |
| Transportation | 16.91 | 16.44 | 32 | 32 | 29.27 | 33.25 |
| Health and personal care | 4.62 | 5.03 | 40 | 41 | 34.46 | 35.41 |
| Recreation, education and reading | 9.29 | 9.92 | 88 | 85 | 47.96 | 55.20 |
| Alcoholic beverages, tobacco products and recreational cannabis | 4.63 | 4.53 | 16 | 16 | 14.47 | 18.98 |
| Total | 100.00 | 100.00 | 518 | 490Table A2 Additional basket details by major component Note 3 |
51.12 | 52.78 |
|
||||||
- Date modified: