
Behind the Numbers: What’s Causing Growth in Food Prices
Skip to text
Text begins
Introduction
Food is an essential purchase for all Canadians, whether it be at the grocery store or out at a restaurant. Through these regular purchases, we are more likely to notice – and attach greater importance to – price changes. Since late 2021, price increases for food sold in stores, measured on a year-over-year basis, have outpaced headline consumer inflation, growing faster than 10% in August, September and October 2022. In September 2022, yearly price increases for food purchased in stores (11.4%) rose at the fastest pace since 1981, remaining elevated in October (+11.0%). Food prices have risen due to multiple factors that have put upward pressure on costs along the food supply chain. Since the onset of the COVID-19 pandemic, many factors have impacted prices at the grocery store, such as supply chain disruptions, labour shortages, changes in consumer purchasing patterns, poor weather in some growing regions, tariffs, higher input costs, and higher wages. Unlike past trends, many of these conditions and pressures have been occurring simultaneously or in a more pronounced manner, leading to broad-based increases in food prices.
Reflecting the importance of food to consumers, the food component is the third largest of the eight components that make up the Consumer Price Index (CPI), following shelter and transportation. The food component comprises 15.94% of the 2021 basket.Note As an essential and frequently purchased good, consumers are significantly impacted when food prices increase. Data from the Portraits of Canadian Society survey (conducted April 2022) reveal that 43% of Canadians surveyed reported they are most affected by food inflation;Note 20% of Canadians are very or somewhat likely to obtain food from community organizations in the next six months.

Data table for Chart 1
| All-items CPI | Food purchased from stores | |
|---|---|---|
| 12-month % change | ||
| 2019 | ||
| Oct. | 1.9 | 4.1 |
| Nov. | 2.2 | 3.9 |
| Dec. | 2.2 | 3.2 |
| 2020 | ||
| Jan. | 2.4 | 3.8 |
| Feb. | 2.2 | 2.4 |
| Mar. | 0.9 | 2.4 |
| Apr. | -0.2 | 4.0 |
| May | -0.4 | 3.5 |
| Jun. | 0.7 | 3.0 |
| Jul. | 0.1 | 2.4 |
| Aug. | 0.1 | 1.6 |
| Sep. | 0.5 | 1.3 |
| Oct. | 0.7 | 2.3 |
| Nov. | 1.0 | 1.6 |
| Dec. | 0.7 | 0.5 |
| 2021 | ||
| Jan. | 1.0 | 0.1 |
| Feb. | 1.1 | 1.3 |
| Mar. | 2.2 | 1.3 |
| Apr. | 3.4 | 0.1 |
| May | 3.6 | 0.9 |
| Jun. | 3.1 | 0.7 |
| Jul. | 3.7 | 1.0 |
| Aug. | 4.1 | 2.6 |
| Sep. | 4.4 | 4.2 |
| Oct. | 4.7 | 3.9 |
| Nov. | 4.7 | 4.7 |
| Dec. | 4.8 | 5.7 |
| 2022 | ||
| Jan. | 5.1 | 6.5 |
| Feb. | 5.7 | 7.4 |
| Mar. | 6.7 | 8.7 |
| Apr. | 6.8 | 9.7 |
| May | 7.7 | 9.7 |
| Jun. | 8.1 | 9.4 |
| Jul. | 7.6 | 9.9 |
| Aug. | 7.0 | 10.8 |
| Sep. | 6.9 | 11.4 |
| Oct. | 6.9 | 11.0 |
| Source: Statistics Canada, table 18-10-004-01 - Consumer Price Index, monthly, not seasonally adjusted. | ||
COVID-19 and supply chain disruption
The COVID-19 pandemic continues to have global ramifications on health and the economy,Note and consumer prices are no exception. Specific to food prices, COVID-19 has driven price change in a myriad of ways, including disruptions at various stages of the supply chain, such as processing, packaging, and transportation. These disruptions have also occurred within the context of shifting consumer spending patterns, and in many cases, mandated business closures. These shifts required the redistribution of supply from food purchased from restaurants to food purchased from stores.
As public health measures were introduced to prevent the transmission of COVID-19, consumer spending patterns reacted accordingly. Restaurants, unable to serve consumers in-person, transitioned to take-out service. By the end of April 2020, sales in the food services and drinking establishments subsector fell 61.3% compared with pre-pandemic levelsNote observed in February 2020. To meet demand, which rapidly shifted away from restaurants and towards grocery stores, suppliers had to reconfigure logistics and supply chains to distribute food to grocery stores, where consumer spending had risen.
COVID-19 outbreaks occurred in food processing facilities, leading to temporary closures. The closures of these facilities had a cascading impact on consumer pricing.
Firstly, when a processing facility shuts down, supply constraints arise, potentially contributing to an increase in prices due to reduction in supply. Shutdowns also create processing bottlenecks and backlogs which might affect future supply, and, consequently, pricing. This can also lead to higher input pricesNote because of atypical processing costs, such as higher labour costs associated with overtime or additional transportation costs associated with moving materials to a non-traditional processing site.
Secondly, processing facilities require a certain type of labour. In April and May 2020, COVID-19 outbreaks, amongst workers, in beef processing facilities led to closures. These closures contributed to higher year-over-year prices for beef in MayNote (+13.7%), June (+21.6%), and July (+14.7%) of 2020.
Start of text box
Wheat Food Infographic
An infographic, "The rise in prices for wheat-based food products", which explores price increases among the supply chain of wheat-based products in Canada is now available.
End of text box
Poor weather in production regions
Weather is the most important variable for maintaining the supply of food. Erratic weather events, which have become increasingly frequent and severe over the past few years, have impacted the supply and production of food products. Reduced supply amid sustained demand results in higher consumer prices.
In 2021, the Prairie provinces experienced a severe heatwave and drought conditions, contributing to higher prices for meat, particularly beef, and grain products. Farmers were unable to use free grazing as a feed source for beef cattle amid drought conditions. Similar conditions in some producer regions elsewhere in the world resulted in a steep rise in demand for animal feed, amid reduced grain outputs, making it more expensive to rear livestock. Internationally, heatwaves in agricultural producing regions have elevated the prices of imported food consumed in Canada. These conditions contributed to higher prices for meat at grocery stores in the fall of 2021.Note

Data table for Chart 2
| August 2021 | September 2021 | October 2021 | November 2021 | December 2021 | |
|---|---|---|---|---|---|
| 12-month % change | |||||
| Fresh or frozen Beef | 5.3 | 13.0 | 14.0 | 15.4 | 11.9 |
| Fresh or frozen Pork | 9.3 | 9.5 | 8.8 | 4.0 | 8.4 |
| 8.4 | 10.3 | 8.3 | 5.5 | 6.2 | |
| Source: Statistics Canada, table 18-10-004-01 - Consumer Price Index, monthly, not seasonally adjusted. | |||||
The United States, Canada’s top agricultural trading partner and major source for fresh and frozen fruit and vegetables, has experienced unfavourable growing weather, including a megadrought - the worst drought in at least 1,200 years is occurring in the southwestern United States,Note heatwaves, extreme rainfall and flooding, and snap freezing in southern states, including Texas. These weather conditions have contributed to increased year-over-year prices for fresh vegetables (+11.0%) and fresh fruit (+8.9%) in October 2022. Brazil, the world’s largest exporter of coffee and sugar, has experienced drought causing prices to rise year over year in the fall of 2022, a continuation of elevated prices which began to accelerate in January 2022.
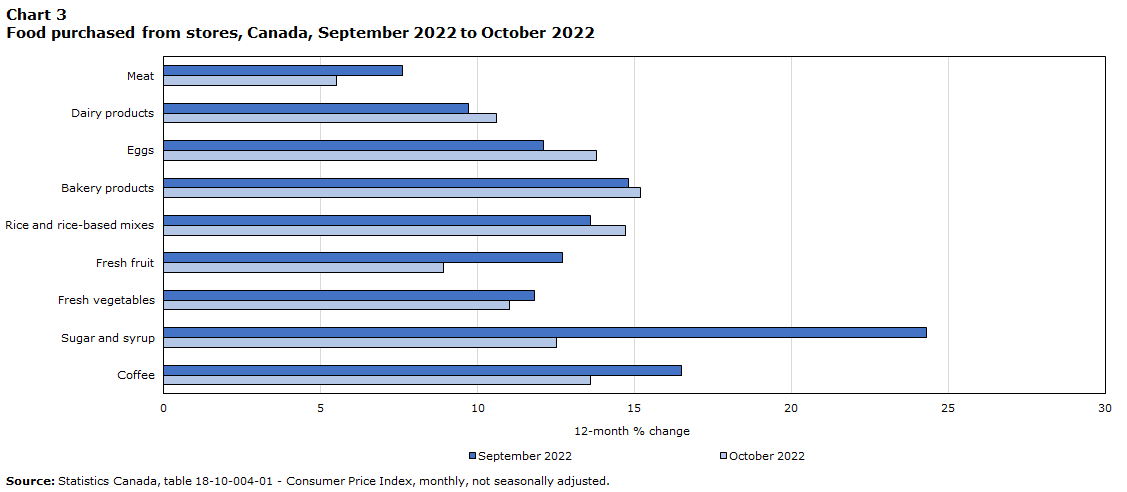
Data table for Chart 3
| October 2022 | September 2022 | |
|---|---|---|
| 12-month % change | ||
| Meat | 5.5 | 7.6 |
| Dairy products | 10.6 | 9.7 |
| Eggs | 13.8 | 12.1 |
| Bakery products | 15.2 | 14.8 |
| Rice and rice-based mixes | 14.7 | 13.6 |
| Fresh fruit | 8.9 | 12.7 |
| Fresh vegetables | 11.0 | 11.8 |
| Sugar and syrup | 12.5 | 24.3 |
| Coffee | 13.6 | 16.5 |
| Source: Statistics Canada, table 18-10-004-01 - Consumer Price Index, monthly, not seasonally adjusted. | ||
Reduced crop yields put upward price pressure on raw agricultural products, resulting in higher prices for finished food products. Pizza, for example, contains several raw ingredients: cheese (+9.9%), flour and flour-based mixes (+23.2%), condiments, spices, and vinegars (+12.8%), which includes tomato sauce, alongside any vegetable (+11.0%) or meat (+5.5%), as of October 2022. Baked goods, which contain components such as eggs (+13.8%), butter (+20.2%) and fresh milk (+11.5%) are another example.

Data table for Chart 4
The chart depicts a pizza divided into parts. Each part represents one of the following raw ingredients found in a pizza: “flour and flour-based mixes,” “cheese,” “fresh vegetables,” “condiments, spices and vinegars” and “meat.” The chart displays the year-over-year price change, from October 2021 to October 2022, for each of the raw ingredients listed. The chart helps to illustrate how increases in raw ingredients contribute to increases in finished food products for consumers.
| October 2022 | |
|---|---|
| 12-month % change | |
| Flour and flour-based mixes | 23.2 |
| Cheese | 9.9 |
| Fresh vegetables | 11.0 |
| Condiments, spices and vinegars | 12.8 |
| Meat | 5.5 |
| Source: Statistics Canada, table 18-10-004-01 - Consumer Price Index, monthly, not seasonally adjusted. | |
Input prices rise
Commercial farming requires the usage of machinery, labour, and energy to produce food products and transport them to retailers. Energy prices surged in early 2022, due partly to the Russian invasion of Ukraine, and reduced oil output from oil-producing nations. As global economic growth has slowed, gasoline prices fell on a monthly basis in July (-9.2%), August (-9.6%)Note and September 2022 (-7.4%).
In August 2022, ammonia and chemical fertilizer prices fell 19.3% month over monthNote compared with July; however, prices remained elevated 42.8% year over year, and up 95.8% compared with January 2020 prices.Note Volatility in the fertilizer market is linked to the price of natural gas, which is a central component for nitrogen-based fertilizers. Temporary closures of fertilizer plants in Europe, alongside reduced output due to sanctions against Belarus and Russia (the two nations produce 40% of the global potash market, a component in some fertilizers) led to reduced supply, contributing to higher prices.Note
The Russian invasion of Ukraine
The Russian invasion of Ukraine resulted in additional upward pressure on global food prices due to the role the two nations play in agricultural and oil production. Higher prices for agricultural inputs required for food production have played a central factor in rising raw commodity and finished food prices. Russia is a top producer of nitrogen, phosphorus, and potassium, key components of fertilizer. Combined, Russian and Belarussian fertilizer production comprise 20% of the global fertilizer market.Note Belarus received additional sanctions due to its support of the invasion of Ukraine, further impacting fertilizer pricing.
Russia and Ukraine are, respectively, the first and fifth largest global exporters of wheat.Note The invasion of Ukraine caused uncertainty in global wheat markets, resulting in price volatility. The price of wheat began to rise in December 2021 when concern of war between the two countries gained momentum. Following the Russian invasion in February 2022, prices for cereal products have increased by more than +11.0% (year over year) for eight consecutive months. Consumer prices for cereal products remained elevated in October (+19.6%) as the conflict wages on.

Data table for Chart 5
| Bakery and cereal products (excluding baby food) | Cookies and crackers | Rice and rice-based mixes | Breakfast cereal and other cereal products (excluding baby food) | Dry or fresh pasta | Pasta mixes | |
|---|---|---|---|---|---|---|
| 12-month % change | ||||||
| 4.9 | 2.7 | 2.3 | 6.8 | 6.7 | 1.6 | |
| Jan. 2022 | 6.9 | 6.9 | 2.5 | 6.7 | 12.6 | 8.2 |
| Feb. 2022 | 6.7 | 7.4 | 7.3 | 8.5 | 12.0 | 1.9 |
| 9.8 | 6.1 | 5.7 | 12.3 | 25.8 | 15.5 | |
| Apr. 2022 | 11.3 | 5.3 | 7.4 | 15.0 | 30.1 | 10.4 |
| May 2022 | 10.1 | 4.7 | 6.8 | 13.1 | 25.3 | 11.3 |
| Jun. 2022 | 11.3 | 5.1 | 10.0 | 11.3 | 31.7 | 14.0 |
| Jul. 2022 | 13.2 | 8.3 | 10.6 | 11.0 | 29.9 | 17.0 |
| Aug. 2022 | 15.1 | 9.3 | 8.5 | 12.9 | 32.4 | 7.3 |
| Sep. 2022 | 16.1 | 12.4 | 13.6 | 16.7 | 29.7 | 13.9 |
| Oct. 2022 | 16.9 | 14.4 | 14.7 | 17.8 | 44.8 | 10.0 |
| Source: Statistics Canada, table 18-10-004-01 - Consumer Price Index, monthly, not seasonally adjusted. | ||||||
Russia is also a major global supplier of cod and haddock. In March 2022, Canada imposed tariffs on Russian products by removing Russia from the Most-Favoured-Nation Tariff (MFN). This removal immediately imposed a tariff rate of 35% and was applied on virtually all imports from Russia, impacting prices for fish, among other products, for Canadian consumers. Prices for fresh or frozen fish have increased on a year-over-year basis by 10% or more for six months, commencing April 2022. In May 2022, an embargo of Russian-sourced fish and seafood was implemented as part of a new round of Canadian government sanctions against Russia, reducing supply.
Higher retail operating costs
In the early stages of the COVID-19 pandemic, many businesses incurred new expenses, such as increased cleaning and personal protective equipment. These costs, in tandem with supplier cost hikes, led some retailers to increase consumer prices. That said, many external factors can cause consumer prices to rise at any given time and does not necessarily need to be based on a large-scale event such as the COVID-19 pandemic.
Restaurants and grocery stores have had to adapt during the COVID-19 pandemic as Canadians shifted the ratio of food enjoyed at restaurants to eating more at home. Additional reconfigurations have occurred as supply chain issues and higher production costs have led to changes by consumers and retailers alike.
Product substitution and consumer price
When goods rise in price, consumers tend to alter their purchasing behaviors in response to relative price movements. Consumers may purchase less of a given food item, omit the purchase entirely, or purchase a cheaper food product. As different factors impact different food products, some food products have risen in price at a faster rate than others.
Edible oils provide an example of a product grouping which has products that can be easily substituted with one another. Because they can be easily substituted, prices for various edible oils tend to fluctuate in tandem. Edible oils, such as sunflower, olive, palm, and canola are often used interchangeably by restaurants and households alike. For example, when the price of sunflower oil increases, consumers can easily switch to an alternative oil, such as canola oil. However, when one or more of the edible oils are experiencing price increases it can cause other edible oils to increase in price, as consumers seek out lower priced alternatives.
As an example, production of canola in Canada declined by 35.4% in 2021, the lowest annual figure since 2007,Note due to drought conditions. Canada is the largest global canola exporter; as such, the reduced production impacted global supply, driving up the price. Simultaneously, Indonesian and Malaysian crude palm oil production was disrupted due to poor weather, high fertilizer prices, and labour issues, all of which contributed to elevated prices in 2021 and 2022. In 2022, the Russian invasion of Ukraine reduced the global supply of sunflower oil, leading to higher sunflower oil prices. As these oils are often substituted, higher prices for canola, palm, and sunflower oils may have also impacted the price of other edible oils where supply remained steady, such as olive and coconut oil, as a result of increased consumer demand.
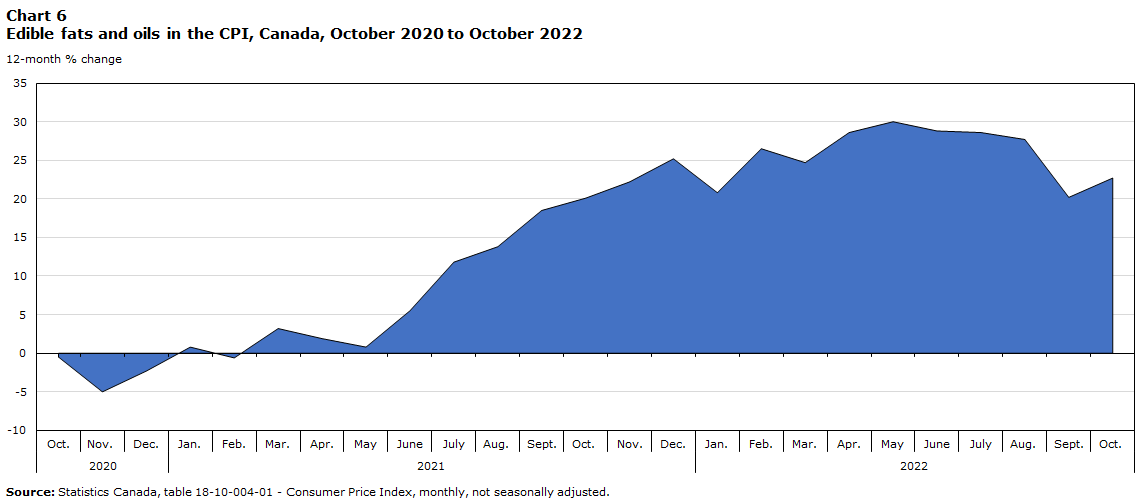
Data table for Chart 6
| Edible fats and oils | |
|---|---|
| 12-month % change | |
| 2020 | |
| Oct. | -0.5 |
| Nov. | -5.0 |
| Dec. | -2.3 |
| 2021 | |
| Jan. | 0.8 |
| Feb. | -0.6 |
| Mar. | 3.2 |
| Apr. | 1.9 |
| May | 0.8 |
| Jun. | 5.5 |
| Jul. | 11.8 |
| Aug. | 13.8 |
| Sep. | 18.5 |
| Oct. | 20.1 |
| Nov. | 22.2 |
| Dec. | 25.2 |
| 2022 | |
| Jan. | 20.8 |
| Feb. | 26.5 |
| Mar. | 24.7 |
| Apr. | 28.6 |
| May | 30.0 |
| Jun. | 28.8 |
| Jul. | 28.6 |
| Aug. | 27.7 |
| Sep. | 20.2 |
| Oct. | 22.7 |
| Source: Statistics Canada, table 18-10-004-01 - Consumer Price Index, monthly, not seasonally adjusted. | |
Looking Forward
As Canada’s most robust indicator of food prices, Statistics Canada will continue to monitor developments and trends in food prices and the impact on consumer price inflation to provide the most accurate and timely data available.
Start of text box
Explore the Consumer Price Index tools
Check out the Personal Inflation Calculator! This interactive calculator allows you to enter dollar amounts in the common expense categories to produce a personalized inflation rate, which you can compare to the official measure of inflation for the average Canadian household—the Consumer Price Index (CPI).
Visit the Consumer Price Index portal to find all CPI data, publications, interactive tools, and announcements highlighting new products and upcoming changes to the CPI in one convenient location.
Consult the Consumer Price Index Data Visualization Tool to access current and historical CPI data in a customizable visual format.
Find out answers to the most common questions posed about the Consumer Price Index (CPI) in the context of the COVID-19 pandemic and beyond.
End of text box
- Date modified: