
Prices Analytical Series
From slaughter to supermarket: how supply-chains inform beef prices
In 2021, Canada recorded its highest annual increase (+3.4%) in Consumer Price Index (CPI) since 1991Note , as the retail market faced impacts of the COVID-19 pandemic, supply chain disruptions, and rebounding energy prices. In particular, the beef industry, accounting for about 40%Note of the total national fresh or frozen meat consumption, experienced strong price fluctuations last year. Issues within the Canadian beef supply chain led to unprecedented volatility in beef prices.
The purpose of this analysis is to evaluate how beef price fluctuations transmit through the distribution channel in the supply chain, involving manufacturers, wholesale distributors, retailers, before reaching end consumers.
Start of text box- For beef price transmission, the Industrial Product Price Index (IPPI) was a leading indicator for CPI, although the two indices did not move together for a short period (July 2020 to June 2021);
- Wholesale distributors in the system could pass price impacts in a timely manner from upstream to downstream;
- Retailers, while facing competitive market conditions, partially absorbed price fluctuations, and transferred those costs to consumers to a lesser degree.
Overview of the Beef Supply Chain
As illustrated in Figure 1, the Canadian beef supply chain starts from the ranch-slaughterhouse and beef processing at the upper stream, with food manufacturing and wholesale distribution of animal meat products as intermediate process and transmits to wholesale distributors, retail services and final consumers at the downstream.In 2019, Canadians spent $ 399 on beef per household, accounting for 42.5% of household meat consumption (except processed meat)Note . In the same year, over four-fifths (86%) of Canada’s total beef supply was produced domestically, while the majority of the supply (63%) was consumed domesticallyNote . Those shares remained stable in 2020. Canadian retailers and consumers are therefore mostly reliant on domestic beef supply.

Description of figure 1
This figure displays the beef supply chain step-by-step; it does not include imports. First, cattle are raised in ranches then usually sent to feedlots to gain mass, once they reach the desired size they are sent to slaughterhouses and meat processing plants. From the meat processing plants, carcasses are then either sent to merchant wholesalers, food manufacturers, or a combination of both. The resulting products are finally sold to the food-service industry, exported, or sold to retailers for consumer consumption.
Figure 2 shows that Statistics Canada measures price changes across the supply chain by providing a series of price index measures including the IPPI, the Wholesale Services Price Index (WSPI), the Retail Services Price Index (RSPI) and the CPI. These price indexes provide vital information on upstream and downstream operations to help analyze how price changes are transmitted through the supply chain.
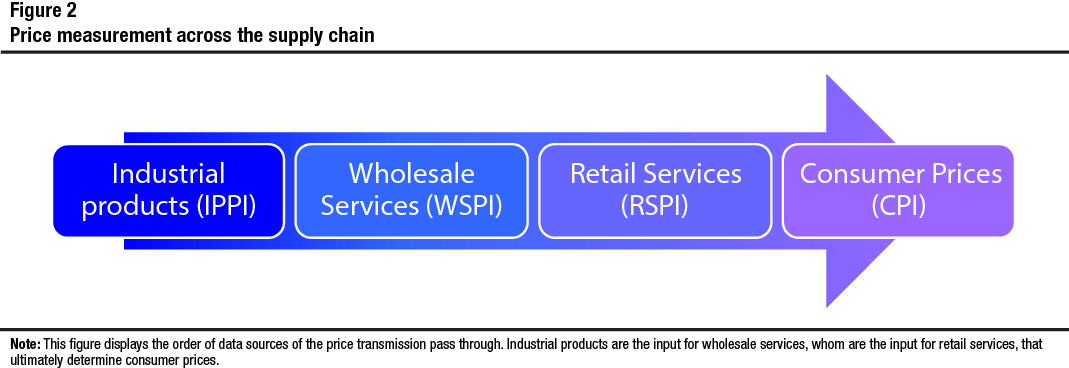
Description of figure 2
This figure displays the order of data sources of the price transmission pass through. Industrial products are the input for wholesale services, whom are the input for retail services, that ultimately determine consumer prices.
The price journey from manufacturers (IPPI) to consumers (CPI)
As shown in Chart 1, the IPPI movements for fresh and frozen beef products were more stable in pre-pandemic periods before March 2020. During the pandemic, from 2020 to 2021, beef prices experienced dramatic fluctuations due to several reasons including COVID-related plant shutdowns in early 2020, drought, and global supply chain issues in 2021. The IPPI movements during the pandemic were reflected by two waves of volatility: March to July 2020 and May to October 2021. Such movements were further mirrored by CPI, with some lag effects. Such a close movement pattern indicates a possible price transmission mechanism in the supply chain, from IPPI to CPI. In addition, the IPPI price fluctuations were absorbed to a certain degree within the supply chain, as CPI moved at a slower pace than IPPI did, especially after the pandemic’s breakout in March 2020.

Data table for Chart 1
| Fresh and Frozen Beef and Veal Industrial Product Price | Fresh and Frozen Beef Consumer Prices | |
|---|---|---|
| Year-over-year percentage change | ||
| 2017 | ||
| January | -11.4 | -5.2 |
| February | -12.0 | -4.2 |
| March | -3.0 | -7.0 |
| April | 1.2 | -4.8 |
| May | 11.1 | -3.3 |
| June | 10.3 | -0.7 |
| July | 5.9 | 0.5 |
| August | 8.4 | 1.0 |
| September | 2.3 | 0.3 |
| October | 5.2 | -2.4 |
| November | 9.1 | 1.9 |
| December | 9.3 | 2.8 |
| 2018 | ||
| January | 7.0 | 2.0 |
| February | 6.9 | 1.0 |
| March | 4.1 | -0.9 |
| April | -1.5 | 2.0 |
| May | -4.7 | -0.6 |
| June | -5.4 | 0.3 |
| July | 0.2 | -1.2 |
| August | -1.3 | 1.3 |
| September | 0.3 | 1.1 |
| October | -2.2 | 1.8 |
| November | -3.7 | 1.5 |
| December | 0.0 | -0.1 |
| 2019 | ||
| January | -2.1 | 2.5 |
| February | -2.4 | 1.4 |
| March | -2.2 | 3.3 |
| April | 3.0 | -0.8 |
| May | 2.2 | 2.5 |
| June | -0.4 | 2.9 |
| July | -4.2 | 2.9 |
| August | 0.4 | 2.0 |
| September | 1.3 | 4.7 |
| October | 3.8 | 6.6 |
| November | 10.9 | 6.2 |
| December | 6.7 | 8.1 |
| 2020 | ||
| January | 3.5 | 5.5 |
| February | 7.6 | 5.0 |
| March | 12.9 | 6.8 |
| April | 45.8 | 8.5 |
| May | 56.3 | 13.7 |
| June | 45.5 | 21.6 |
| July | 10.2 | 14.7 |
| August | 9.3 | 4.8 |
| September | 13.2 | -0.5 |
| October | 9.1 | 1.1 |
| November | 6.9 | -0.5 |
| December | -4.6 | -1.5 |
| 2021 | ||
| January | 2.7 | 0.9 |
| February | 12.0 | 0.3 |
| March | 3.3 | -2.1 |
| April | -8.8 | 0.3 |
| May | -7.9 | -4.3 |
| June | 4.4 | -11.1 |
| July | 28.0 | -2.4 |
| August | 49.3 | 5.3 |
| September | 41.4 | 13.0 |
| October | 24.2 | 14.0 |
| November | 22.9 | 15.4 |
| December | 32.8 | 11.9 |
| 2022 | ||
| January | 29.2 | 13.0 |
| February | 15.0 | 16.8 |
| March | 9.5 | 14.1 |
| April | -3.4 | 12.9 |
| Source: Statistics Canada. Table 18-10-0266-01 Industrial product price index, by product, monthly and Table 18-10-0004-01 Consumer Price Index, monthly, not seasonally adjusted. | ||
It is further noted that the two indices did not move together during the short period from July 2020 to June 2021. This indicates that the pandemic disrupted the intermediate supply-chains between IPPI and CPI, where wholesalers’ and retailers’ price movements played a role in transmission. This is further evaluated in next sections.
Intermediate chains of wholesale services (WSPI) and retail services (RSPI)Note
Wholesale distributors and retailers are the two important players between manufacturers and consumers. They provide services and distribute goods to consumers. The price fluctuations are felt by wholesalers when goods leave the manufacturers.
As shown in Chart 2, wholesale selling prices closely followed the IPPI beef price movements before and during the pandemic. Hence there was an efficient market mechanism in place that allowed wholesale distributors to transfer a sizable portion of price changes from upstream manufacturers to downstream wholesalers. In other words, slaughterhouses and meat-packing plants’ selling prices influenced how beef wholesalers' set their selling prices, both before and during the pandemic.

Data table for Chart 2
| Fresh and Frozen Beef and Veal Industrial Product Price | Beef Products' Wholesale Selling Price | |
|---|---|---|
| Year-over-year percentage change | ||
| 2019 | ||
| January | -2.1 | -9.5 |
| February | -2.4 | -10.9 |
| March | -2.2 | -12.1 |
| April | 3.0 | -7.5 |
| May | 2.2 | -6.9 |
| June | -0.4 | -8.5 |
| July | -4.2 | -14.6 |
| August | 0.4 | -10.3 |
| September | 1.3 | -8.2 |
| October | 3.8 | 9.9 |
| November | 10.9 | 14.1 |
| December | 6.7 | 14.8 |
| 2020 | ||
| January | 3.5 | 12.5 |
| February | 7.6 | 20.0 |
| March | 12.9 | 15.8 |
| April | 45.8 | 19.3 |
| May | 56.3 | 34.5 |
| June | 45.5 | 26.0 |
| July | 10.2 | 8.6 |
| August | 9.3 | 3.2 |
| September | 13.2 | 6.3 |
| October | 9.1 | 2.4 |
| November | 6.9 | -3.6 |
| December | -4.6 | -4.9 |
| 2021 | ||
| January | 2.7 | -4.1 |
| February | 12.0 | -5.7 |
| March | 3.3 | -0.5 |
| April | -8.8 | -7.4 |
| May | -7.9 | -18.8 |
| June | 4.4 | -5.5 |
| July | 28.0 | 10.3 |
| August | 49.3 | 17.3 |
| September | 41.4 | 18.0 |
| October | 24.2 | 17.9 |
| November | 22.9 | 18.7 |
| December | 32.8 | 13.8 |
| 2022 | ||
| January | 29.2 | 22.4 |
| February | 15.0 | 22.8 |
| March | 9.5 | 15.6 |
| Source: Statistics Canada. Table 18-10-0266-01 Industrial product price index, by product, monthly and special calculation based on Statistics Canada’s Wholesale Price Report (survey number 5106) for beef products. | ||
Leaving wholesale distributors, the price journey continues with retailers. Retailers have larger distribution systems to reach end consumers and, at the same time, face more competitive markets. Chart 3 shows the movements of the wholesale and retail selling prices. The flatter year over year change in retail selling price indicates that retailers partially absorbed the wholesale price fluctuations by adjusting their selling prices. In other words, large movement seen in wholesale selling prices translated to minor increases to retailer's selling prices. This further suggests that retailers absorbed much of their wholesalers' price increases and passed a fraction of these costs to consumers.

Data table for Chart 3
| Beef Products' Wholesale Selling Price | Beef Products' Retail Selling Price | |
|---|---|---|
| Year-over-year percentage change | ||
| 2019 | ||
| January | -9.5 | 3.1 |
| February | -10.9 | 4.3 |
| March | -12.1 | 2.1 |
| April | -7.5 | 3.0 |
| May | -6.9 | 1.9 |
| June | -8.5 | 1.2 |
| July | -14.6 | 0.6 |
| August | -10.3 | 1.9 |
| September | -8.2 | 2.3 |
| October | 9.9 | 2.8 |
| November | 14.1 | 1.6 |
| December | 14.8 | 2.0 |
| 2020 | ||
| January | 12.5 | 2.4 |
| February | 20.0 | 2.0 |
| March | 15.8 | 5.2 |
| April | 19.3 | 6.2 |
| May | 34.5 | 8.6 |
| June | 26.0 | 14.6 |
| July | 8.6 | 10.1 |
| August | 3.2 | 8.2 |
| September | 6.3 | 5.8 |
| October | 2.4 | 5.7 |
| November | -3.6 | 6.3 |
| December | -4.9 | 5.0 |
| 2021 | ||
| January | -4.1 | 5.8 |
| February | -5.7 | 5.5 |
| March | -0.5 | 3.0 |
| April | -7.4 | 1.3 |
| May | -18.8 | 0.9 |
| June | -5.5 | -2.3 |
| July | 10.3 | 2.6 |
| August | 17.3 | 4.1 |
| September | 18.0 | 9.3 |
| October | 17.9 | 10.8 |
| November | 18.7 | 9.9 |
| December | 13.8 | 9.1 |
| 2022 | ||
| January | 22.4 | 9.5 |
| February | 22.8 | 8.2 |
| March | 15.6 | 7.8 |
| Source: Special calculation based on Statistics Canada’s Wholesale Price Report (survey number 5106) and Retail Services Price Index program (survey number 5135) administrative data for beef products. | ||
As a final note, retailers absorbed price volatility by reducing profit margins, thus maintaining more stable retail selling prices. As demonstrated in Chart 4Note , retailers' profit margins experienced sharp declines in June 2020 and July 2021 when retail prices surged.

Data table for Chart 4
| Beef Products' Retail Selling Price | Beef Products' Retail Purchase Price | Beef Products' Retail Margin Price | |
|---|---|---|---|
| Year-over-year percentage change | |||
| 2019 | |||
| January | 3.1 | 1.8 | 6.0 |
| February | 4.3 | 2.7 | 7.5 |
| March | 2.1 | 2.6 | 1.8 |
| April | 3.0 | 2.6 | 5.2 |
| May | 1.9 | 3.5 | -1.5 |
| June | 1.2 | 3.1 | -0.4 |
| July | 0.6 | -0.1 | 4.3 |
| August | 1.9 | -0.1 | 9.2 |
| September | 2.3 | 1.4 | 6.5 |
| October | 2.8 | 3.7 | 4.9 |
| November | 1.6 | 2.0 | 4.1 |
| December | 2.0 | 3.8 | 1.8 |
| 2020 | |||
| January | 2.4 | 5.5 | -0.7 |
| February | 2.0 | 3.1 | 4.0 |
| March | 5.2 | 4.6 | 9.4 |
| April | 6.2 | 9.9 | 0.1 |
| May | 8.6 | 18.7 | -12.8 |
| June | 14.6 | 28.2 | -20.1 |
| July | 10.1 | 12.3 | 5.7 |
| August | 8.2 | 9.6 | 6.9 |
| September | 5.8 | 6.6 | 6.3 |
| October | 5.7 | 4.1 | 8.9 |
| November | 6.3 | 6.0 | 5.7 |
| December | 5.0 | 3.0 | 7.0 |
| 2021 | |||
| January | 5.8 | 1.8 | 12.7 |
| February | 5.5 | 1.9 | 11.0 |
| March | 3.0 | 1.3 | 5.9 |
| April | 1.3 | -3.8 | 12.8 |
| May | 0.9 | -7.7 | 26.9 |
| June | -2.3 | -8.6 | 22.9 |
| July | 2.6 | 6.5 | -7.2 |
| August | 4.1 | 10.0 | -7.4 |
| September | 9.3 | 18.8 | -10.1 |
| October | 10.8 | 21.5 | -11.3 |
| November | 9.9 | 18.7 | -6.8 |
| December | 9.1 | 15.6 | -2.6 |
| 2022 | |||
| January | 9.5 | 14.1 | 1.5 |
| February | 8.2 | 14.3 | -2.7 |
| March | 7.8 | 13.2 | -2.1 |
| April | 7.9 | 12.0 | -1.1 |
| Source: Special calculation based on Statistics Canada’s Retail Services Price Index Program (survey number 5135) administrative data source for beef products. | |||
- Date modified: