
Prices Analytical Series
Industrial Product Price Index: 2021 Annual Review
by Mohammad Roknossadati, Tshibangu Batubenga and Daanish Garda
Skip to text
Text begins
An exceptional year
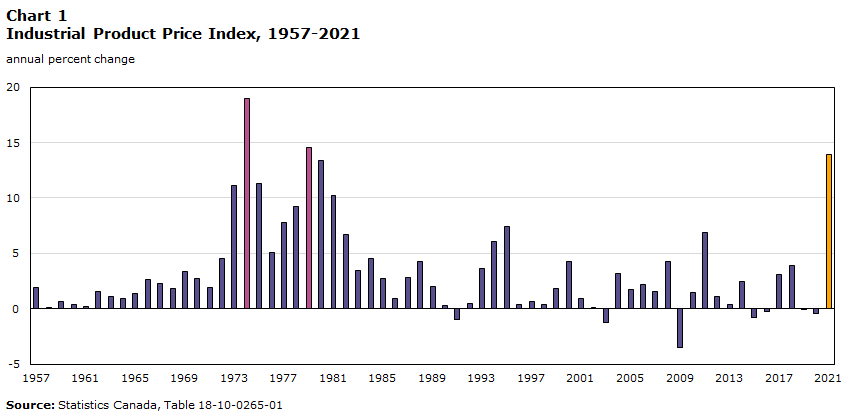
The Industrial Product Price Index (IPPI) measures the prices of products sold by manufacturers operating in Canada. In general, this review looks at the average annual prices for these products in 2021 compared to 2020. The IPPI is weighted such that, the more revenue a product generates for manufacturers in Canada, the more importance it has in affecting the index.
According to the IPPI, prices of products sold by manufacturers operating in Canada were 13.9% higher than the previous year. This was the largest annual change since 1979 (+14.6%), and the 3rd largest annual change on record for the IPPI, the highest being +19.0% in 1974. Inflationary effects in the 70’s were influenced by expansionary monetary policy in Canada and other countries (Thiessen, 1999). In 1973-1974 and 1979 we also saw crises in the crude oil market, with prices per barrel more than doubling in each of those two events (Mouwad, 2008).
Data table for Chart 1
| Annual percent change | |
|---|---|
| 1957 | 1.9 |
| 1958 | 0.1 |
| 1959 | 0.7 |
| 1960 | 0.4 |
| 1961 | 0.2 |
| 1962 | 1.6 |
| 1963 | 1.1 |
| 1964 | 0.9 |
| 1965 | 1.4 |
| 1966 | 2.6 |
| 1967 | 2.3 |
| 1968 | 1.8 |
| 1969 | 3.4 |
| 1970 | 2.7 |
| 1971 | 1.9 |
| 1972 | 4.5 |
| 1973 | 11.1 |
| 1974 | 19.0 |
| 1975 | 11.3 |
| 1976 | 5.1 |
| 1977 | 7.8 |
| 1978 | 9.2 |
| 1979 | 14.6 |
| 1980 | 13.4 |
| 1981 | 10.2 |
| 1982 | 6.7 |
| 1983 | 3.5 |
| 1984 | 4.5 |
| 1985 | 2.7 |
| 1986 | 0.9 |
| 1987 | 2.8 |
| 1988 | 4.3 |
| 1989 | 2.0 |
| 1990 | 0.3 |
| 1991 | -1.0 |
| 1992 | 0.5 |
| 1993 | 3.6 |
| 1994 | 6.1 |
| 1995 | 7.4 |
| 1996 | 0.4 |
| 1997 | 0.7 |
| 1998 | 0.4 |
| 1999 | 1.8 |
| 2000 | 4.3 |
| 2001 | 0.9 |
| 2002 | 0.1 |
| 2003 | -1.2 |
| 2004 | 3.2 |
| 2005 | 1.7 |
| 2006 | 2.2 |
| 2007 | 1.6 |
| 2008 | 4.3 |
| 2009 | -3.5 |
| 2010 | 1.5 |
| 2011 | 6.9 |
| 2012 | 1.1 |
| 2013 | 0.4 |
| 2014 | 2.5 |
| 2015 | -0.8 |
| 2016 | -0.2 |
| 2017 | 3.1 |
| 2018 | 3.9 |
| 2019 | -0.1 |
| 2020 | -0.4 |
| 2021 | 13.9 |
| Source: Statistics Canada, Table 18-10-0265-01. | |
2021 faced a multitude of factors influencing prices, many of which stemmed from the covid-19 pandemic. Economies reopened slowly as lockdowns were lifted and vaccinations became available, driving up demand. Monetary policy remained steadily committed to recovery, with neither the U.S. nor Canada raising interest rates during the year. Supply chains were also disrupted, with ports congested and limited logistical capacity for moving goods.
Industrial product prices surged in 2021
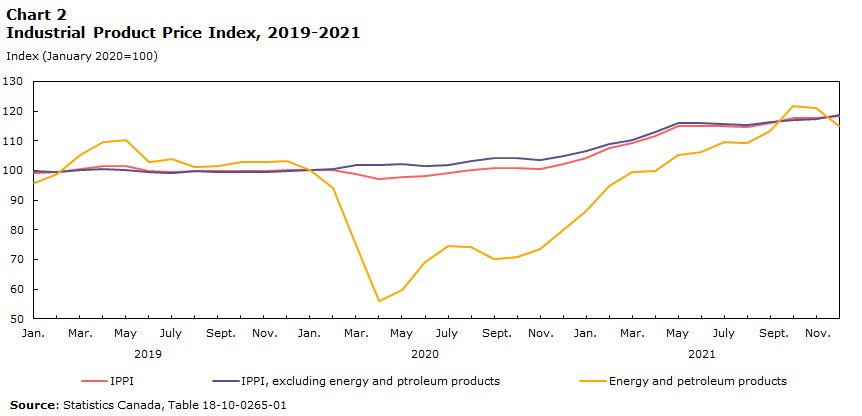
Price gains in the IPPI were widespread, with 20 of 21 major commodity groups covered by the IPPI rising in average annual price, when compared with 2020.
Prices for energy and petroleum products rose 42.8% in 2021. Excluding energy and petroleum products, the IPPI grew 11.5% between 2020 and 2021, driven mainly by higher prices for lumber and other wood products (+40.7%), primary non-ferrous metal products (+21.6%), chemicals and chemical products (+19.4%), and primary ferrous metal products (+43.1%).
Data table for Chart 2
| Industrial product price index | Industrial product price index, excluding energy and petroleum products | Energy and petroleum products | |
|---|---|---|---|
| Index (January 2020=100) | |||
| 2019 | |||
| January | 99.1 | 99.8 | 95.7 |
| February | 99.4 | 99.6 | 98.7 |
| March | 100.6 | 100.1 | 105.2 |
| April | 101.5 | 100.4 | 109.6 |
| May | 101.4 | 100.2 | 110.4 |
| June | 99.9 | 99.6 | 102.8 |
| July | 99.6 | 99.0 | 104.0 |
| August | 99.8 | 99.7 | 101.0 |
| September | 99.7 | 99.5 | 101.5 |
| October | 99.7 | 99.4 | 102.7 |
| November | 99.8 | 99.4 | 102.9 |
| December | 100.0 | 99.7 | 103.2 |
| 2020 | |||
| January | 100.0 | 100.0 | 100.0 |
| February | 100.0 | 100.6 | 94.1 |
| March | 98.9 | 101.7 | 75.0 |
| April | 97.0 | 101.7 | 56.0 |
| May | 97.9 | 102.2 | 59.8 |
| June | 98.0 | 101.4 | 69.1 |
| July | 99.1 | 101.9 | 74.4 |
| August | 100.1 | 103.1 | 74.3 |
| September | 100.8 | 104.3 | 70.3 |
| October | 100.9 | 104.3 | 70.7 |
| November | 100.5 | 103.6 | 73.4 |
| December | 102.1 | 104.7 | 80.0 |
| 2021 | |||
| January | 104.3 | 106.4 | 86.2 |
| February | 107.4 | 108.8 | 94.9 |
| March | 109.2 | 110.4 | 99.3 |
| April | 111.5 | 112.9 | 99.8 |
| May | 114.8 | 115.9 | 105.1 |
| June | 115.0 | 116.0 | 106.1 |
| July | 115.0 | 115.6 | 109.4 |
| August | 114.6 | 115.2 | 109.3 |
| September | 116.0 | 116.3 | 113.3 |
| October | 117.6 | 117.1 | 121.8 |
| November | 117.8 | 117.4 | 121.0 |
| December | 118.2 | 118.5 | 115.1 |
| Source: Statistics Canada, Table 18-10-0265-01. | |||
The pendulum swings for energy and petroleum products
Prices for energy and petroleum products rose 42.8% in 2021. This is the second largest annual percentage change on record for energy and petroleum product prices since the series began in 1981, the highest being +45.9% in 2000.

Data table for Chart 3
| Percent change | |
|---|---|
| 1982 | 15.9 |
| 1983 | 5.4 |
| 1984 | 4.4 |
| 1985 | 5.3 |
| 1986 | -19.6 |
| 1987 | -4.8 |
| 1988 | -7.4 |
| 1989 | 2.1 |
| 1990 | 12.6 |
| 1991 | -3.5 |
| 1992 | -7.8 |
| 1993 | -1.0 |
| 1994 | -0.2 |
| 1995 | 5.7 |
| 1996 | 11.2 |
| 1997 | -0.5 |
| 1998 | -17.7 |
| 1999 | 16.8 |
| 2000 | 45.9 |
| 2001 | -4.6 |
| 2002 | -6.1 |
| 2003 | 10.0 |
| 2004 | 17.6 |
| 2005 | 23.6 |
| 2006 | 8.9 |
| 2007 | 5.4 |
| 2008 | 25.4 |
| 2009 | -28.1 |
| 2010 | 13.2 |
| 2011 | 26.0 |
| 2012 | 4.7 |
| 2013 | 2.1 |
| 2014 | 0.9 |
| 2015 | -22.2 |
| 2016 | -9.2 |
| 2017 | 13.3 |
| 2018 | 15.6 |
| 2019 | -5.0 |
| 2020 | -27.5 |
| 2021 | 42.8 |
| Source: Statistics Canada, Table 18-10-0265-01. | |
Motor gasoline exiting refineries in Canada was 50.7% higher in price in 2021 compared to 2020, while diesel was 40.5% higher. Prices for these refined products are closely linked to the price of crude oil, which rose 68.8% from 2020 to 2021.
In 2020, demand for crude oil dropped sharply due to the COVID-19 pandemic. In 2021, as economies reopened and demand increased, supply did not recover at the same rate. Supply was limited in part by OPEC+’s agreement to restrict production. Starting in May 2020, OPEC+ agreed to reduce supply by 9.7mb/d, with plans to gradually add barrels back on the market in response to demand. Countries outside OPEC+ also reduced production voluntarily as they faced low prices. By January 2021 the OPEC+ reduction target had been lowered to a 7.2mb/d, and by August it was revised again to a 5.8mb/d reduction (OPEC, 2021). These gradual supply increases continued through Q4 2021. In spite of these additional barrels available to the market, demand outpaced supply. This was in part due to the inability of some oil producers to ramp up production, as well as hesitation to invest in new oil projects with the uncertainty of COVID-19 continuously looming (EIA, 2022). In October, the price of WTI crude oil peaked at $84.25, a drastic difference from the negative price (-$37.25) that briefly occurred in May 2020.
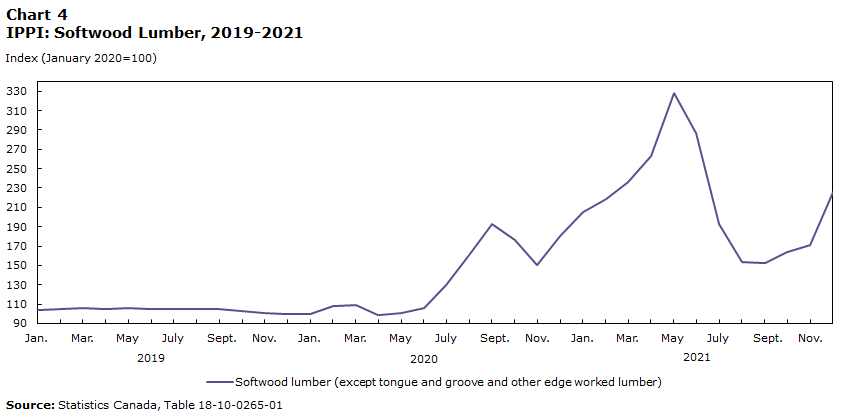
Softwood lumber prices soar
The year 2021 saw softwood lumber prices soar 61.0% higher than 2020, the largest annual increase on record for this commodity since the series began in 1980.
Data table for Chart 4
| Softwood lumber (except tongue and groove and other edge worked lumber) | |
|---|---|
| Index (January 2020=100) | |
| 2019 | |
| January | 103.9 |
| February | 104.5 |
| March | 105.5 |
| April | 105.3 |
| May | 105.5 |
| June | 105.0 |
| July | 104.6 |
| August | 104.9 |
| September | 104.8 |
| October | 103.0 |
| November | 100.9 |
| December | 100.1 |
| 2020 | |
| January | 100.0 |
| February | 107.8 |
| March | 109.3 |
| April | 98.9 |
| May | 100.6 |
| June | 106.3 |
| July | 130.2 |
| August | 160.6 |
| September | 192.5 |
| October | 176.7 |
| November | 150.2 |
| December | 180.2 |
| 2021 | |
| January | 204.8 |
| February | 218.5 |
| March | 235.9 |
| April | 263.0 |
| May | 328.0 |
| June | 287.0 |
| July | 192.6 |
| August | 153.3 |
| September | 152.7 |
| October | 163.7 |
| November | 171.5 |
| December | 226.2 |
| Source: Statistics Canada, Table 18-10-0265-01. | |
The primary market for Canadian softwood lumber is the residential construction sector in the United States. In 2021, housing starts in the U.S. were up 14.4% over the previous year. Increased demand for domestic renovations (Gordon, 2021), and labour shortages in the U.S. lumber industry also put upward pressure on prices.

Data table for Chart 5
| Annual percent change | |
|---|---|
| 2017 | 2.4 |
| 2018 | 3.5 |
| 2019 | 3.6 |
| 2020 | 8.1 |
| 2021 | 14.5 |
| Source: U.S. Census Bureau and U.S. Department of Housing and Urban Development, retreived from FRED | |
Lumber exports to the U.S. were up by 66% in value, totalling $13.6 billion dollars CAD in 2021. After peaking in May, prices seemed to correct downwards temporarily, and spiked back up towards the end of the year. This may have been due in part to a supply crunch caused by flooding in the Pacific Northwest, especially the B.C. interior. In November, the U.S. imposed an increase on duties for incoming Canadian lumber; however, this does not impact the change in prices measured by the IPPI which only covers the price paid to the manufacturer. According to Global Affairs Canada, Canada exported 0.96 billion FBM (foot board measure) in December 2021, slightly lower than the 1.1 billion FBM observed in December 2020, nonetheless still higher than pre pandemic 0.93 billion FBM exported in December 2019. Although there wasn’t a large quantifiable duty effect observed in 2021, over the longer term, duties on softwood lumber could reduce demand as Canadian lumber is costlier for purchasers south of the border.
Metals
In 2021, prices for both primary ferrous metal products and primary non-ferrous metal products rose 43.1% and 21.6%, respectively.

Data table for Chart 6
| Primary ferrous metal products | Primary non-ferrous metal products | |
|---|---|---|
| percent change | ||
| 2011 | 3.7 | 22.6 |
| 2012 | -2.0 | -8.8 |
| 2013 | -3.1 | -7.3 |
| 2014 | 7.9 | 0.3 |
| 2015 | -2.0 | 1.1 |
| 2016 | -5.7 | 2.2 |
| 2017 | 5.6 | 7.3 |
| 2018 | 8.9 | 1.7 |
| 2019 | 0.6 | -2.6 |
| 2020 | 1.3 | 12.7 |
| 2021 | 43.1 | 21.6 |
| Source: Statistics Canada, Table 18-10-0265-01. | ||
Ferrous Metals
Canadian prices for ferrous metals are sensitive to both North American and international factors.
Global steel production capacity had been trending upwards into 2020 and was projected to increase in 2021 in spite of the pandemic. Actual production was limited at the onset of COVID-19, particularly in North America. Global capacity utilization fell to ~76% in Q2 2020, and by Q2 2021 was back to ~84%. In North America, capacity utilization fell to ~56% in Q2 2020, and only returned to ~72% by Q2 2021 (OECD, 2021a), a much slower pace. This tightness in supply put upwards pressure on North American steel prices.

Data table for Chart 7
| Primary ferrous metal products | |
|---|---|
| index (January 2020=100) | |
| 2019 | |
| January | 104.2 |
| February | 102.9 |
| March | 102.7 |
| April | 102.6 |
| May | 102.1 |
| June | 100.7 |
| July | 99.3 |
| August | 99.4 |
| September | 99.4 |
| October | 97.7 |
| November | 96.7 |
| December | 96.5 |
| 2020 | |
| January | 100.0 |
| February | 102.9 |
| March | 106.1 |
| April | 106.9 |
| May | 104.1 |
| June | 101.4 |
| July | 100.9 |
| August | 96.7 |
| September | 97.2 |
| October | 99.6 |
| November | 101.0 |
| December | 103.1 |
| 2021 | |
| January | 108.6 |
| February | 113.6 |
| March | 120.2 |
| April | 126.5 |
| May | 135.0 |
| June | 142.7 |
| July | 153.5 |
| August | 165.5 |
| September | 172.4 |
| October | 173.7 |
| November | 168.0 |
| December | 165.8 |
| Source: Statistics Canada, Table 18-10-0265-01. | |
When combined, North America accounted for only 6.4% of global steel production in 2020 (OECD, 2021b). Canada, the United States, and Mexico are part of an integrated steel market; as of 2019, there were no tariffs on steel trade within this group. Canada is the smallest producer of the three, accounting for 9.8% of North American production in 2020, while the U.S. had a share of 75.7% (OECD, 2021b). In 2021, the U.S. did have tariffs on steel imports from most other countries. Amid high prices and tight supply, the U.S. will be replacing tariffs for imports from the E.U. with a quota system. This should facilitate imports and may alleviate prices pressures on North American steel, including Canada. This new policy goes into effect at the beginning of 2022.
As economies reopened in 2021, demand recovered faster than expected, which also placed upward pressure on North American steel prices. China, the world’s largest producer and consumer of steel, was a notable exception. Steel production in China was limited in 2021 as part of environmental policy, while demand slowed from property development and construction (Zhang, 2022).
Non-Ferrous Metals
Prices for primary non-ferrous metal products also increased in 2021, including unwrought copper and copper alloys (+41.5%), and unwrought aluminum and aluminum alloys (+43.7%).
Prices for copper reached all-time highs in 2021, rallying from November 2020 to May 2021. Short term demand for copper was driven by faster than expected reopening of economies. Long term expectations also played a part in pricing as copper is a key material used in electric vehicles and renewable energy projects. Global supply was tight during 2021, with the year ending in small deficit compared to consumption (Warwick, 2021). The copper futures market exhibited backwardation several times during the year, which means that current prices were higher than prices for futures. Backwardation can happen during supply crunches, as the market expects that prices will decrease as supply is replenished. Beyond the unanticipated demand, logistical constraints and labour issues also put pressure on supply (Mok & Lu, 2022).

Data table for Chart 8
| Unwrought copper and copper alloys | Primary non-ferrous metal products | Unwrought aluminum and aluminum alloys | |
|---|---|---|---|
| Index (January 2020=100) | |||
| 2019 | |||
| January | 99.7 | 95.6 | 105.2 |
| February | 104.7 | 96.8 | 106.7 |
| March | 108.9 | 97.7 | 107.2 |
| April | 108.9 | 97.6 | 103.7 |
| May | 102.5 | 95.2 | 101.1 |
| June | 98.5 | 94.0 | 95.9 |
| July | 98.3 | 94.6 | 96.8 |
| August | 95.7 | 96.6 | 94.8 |
| September | 96.1 | 98.3 | 93.7 |
| October | 95.7 | 97.1 | 94.4 |
| November | 98.0 | 97.4 | 99.2 |
| December | 100.9 | 97.2 | 99.8 |
| 2020 | |||
| January | 100.0 | 100.0 | 100.0 |
| February | 95.4 | 100.2 | 98.1 |
| March | 91.3 | 98.3 | 97.5 |
| April | 89.6 | 98.4 | 89.6 |
| May | 92.4 | 100.5 | 90.3 |
| June | 98.3 | 101.6 | 90.9 |
| July | 108.3 | 108.6 | 94.3 |
| August | 108.5 | 119.1 | 97.6 |
| September | 112.2 | 119.6 | 103.4 |
| October | 111.9 | 117.6 | 106.7 |
| November | 116.6 | 118.6 | 112.3 |
| December | 125.5 | 122.2 | 121.4 |
| 2021 | |||
| January | 128.1 | 124.6 | 123.4 |
| February | 135.7 | 128.8 | 129.4 |
| March | 143.0 | 127.1 | 134.9 |
| April | 147.4 | 128.0 | 130.1 |
| May | 156.0 | 132.5 | 133.1 |
| June | 148.4 | 131.5 | 135.7 |
| July | 149.3 | 133.6 | 144.4 |
| August | 149.0 | 132.6 | 148.9 |
| September | 149.2 | 134.7 | 163.8 |
| October | 153.6 | 137.8 | 171.4 |
| November | 155.1 | 139.0 | 156.9 |
| December | 154.3 | 136.3 | 155.9 |
| Source: Statistics Canada, Table 18-10-0265-01 | |||
Prices for aluminum also rose in 2021, and exhibited a sharp increase at the end of summer. Energy is a major cost component in the production of aluminum. High natural gas prices during the year led to shutdowns or reductions in aluminum production, particularly in Europe. Similarly, in China, the combination of environmental policy as well as high prices for coal both led to reduced output (Hoyle & Wallace, 2022).
Chemicals and chemical products
Prices for chemicals and chemical products increased 19.4% in 2021, mostly driven by growing prices for petrochemicals (+62.4%), plastic resins (+43.7%), and fertilizers, pesticides and other chemical products (+24.9 %). This was the largest increase on record for the chemicals and chemical products group since the series began in 1981.
At the onset of the year, extreme cold weather in the U.S. disrupted petrochemical production (Garcia, 2021). This resulted in a supply shock that put upwards pressure on chemical product prices. Higher prices for feedstocks such as crude oil and natural gas also played a part in driving up costs. In particular, natural gas saw steep price increases during 2021, and closed the year with record high prices in Europe and Asia. Global consumption of natural gas increased by 4.6% in 2021. Supply didn’t keep up with this increase which resulted in the upwards price pressure (IEA, 2022). The price index for ammonia and chemical fertilizers ended the year in December at 123.7% higher than January 2020.

Data table for Chart 9
| Chemicals and chemical products | |
|---|---|
| percent change | |
| 1982 | 5.4 |
| 1983 | 3.5 |
| 1984 | 4.1 |
| 1985 | 1.3 |
| 1986 | 1.4 |
| 1987 | 3.3 |
| 1988 | 11.6 |
| 1989 | 1.3 |
| 1990 | -2.6 |
| 1991 | 1.2 |
| 1992 | -1.4 |
| 1993 | 2.0 |
| 1994 | 7.2 |
| 1995 | 9.1 |
| 1996 | -2.0 |
| 1997 | 0.2 |
| 1998 | -3.1 |
| 1999 | 1.8 |
| 2000 | 6.3 |
| 2001 | 2.5 |
| 2002 | -0.1 |
| 2003 | 3.3 |
| 2004 | 3.4 |
| 2005 | 7.0 |
| 2006 | 1.8 |
| 2007 | 3.4 |
| 2008 | 8.4 |
| 2009 | -5.5 |
| 2010 | 4.5 |
| 2011 | 7.3 |
| 2012 | 1.2 |
| 2013 | 0.5 |
| 2014 | 3.4 |
| 2015 | -4.8 |
| 2016 | -1.4 |
| 2017 | 3.6 |
| 2018 | 2.0 |
| 2019 | -2.2 |
| 2020 | -2.5 |
| 2021 | 19.4 |
| Source: Statistics Canada, Table 18-10-0265-01. | |
Appendix
The Industrial Product Price Index (IPPI) measures price changes for major commodities sold by manufacturers operating in Canada.
Each month, about 3,600 price quotes, from about 1,100 producers, are used in the calculation of the IPPI. The prices collected are for goods sold at the factory gate. As a result, the prices covered by the IPPI refer not to what a purchaser pays, but to what the producer receives. They exclude all indirect taxes, such as sales taxes and tariffs as this money does not go to the factors of production (i.e. labour, capital, or profit). They also exclude any transportation service performed by a common carrier beyond the factory gate and any distribution services performed by the retail or wholesale trade industries.
The Raw Materials Price Index (RMPI) measures price changes for raw materials purchased for further processing by manufacturers operating in Canada. As a purchasers' price index, prices include all charges purchasers incur to bring a commodity to the establishment gate. They include transportation charges, net taxes paid, custom duties, as well as subsidies, if applicable. The RMPI is produced and published together with the IPPI as it meets many of the same interest and needs.
Goods in both the IPPI and RMPI are aggregated hierarchically into groups based on the North American Product Classification System (NAPCS) 2017 v2. For example, ‘motor gasoline’ is a component of ‘refined petroleum energy products, and biofuels’, which is a component of ‘energy and petroleum products’, which is one of the 21 major groups in the IPPI. An index value and percent change is calculated for each one of these levels.
Each good and group has a weight (also referred to as ‘relative importance’) based on the value of the total sales of that good by domestic manufacturers in a specific reference year. Groups contain the sum of the weights of the goods contained therein. A good or group with a higher weight will affect the index proportionally based on its weight. Therefore a large price movement from a lower weighted group can have less impact than a very small movement from a higher weighted group. For the IPPI and RMPI, commodity and industry weights are derived from a combination of the 2016 Supply and Use Tables that closely reflect actual economic transactions by industry and the sales of goods manufactured by companies as reported for the 2016 Annual Survey of Manufacturers and Logging (ASML).
Typically, the IPPI and RMPI are measured and published monthly. For the purposes of the year to year comparisons included in this analytical paper, the annual average index values have been calculated, and comparisons done between averages.
The current time base for both indexes is January 2020=100.
References
Agriculture and Agri-Food Canada. (2021, March 19). CANADA: OUTLOOK FOR PRINCIPAL FIELD CROPS. https://publications.gc.ca/collections/collection_2020/aac-aafc/A77-1-2020-3-19-eng.pdf.
Canada Mortgage and Housing Corporation. (2021, October 11). Monthly Housing Starts and Other Construction Data. Housing Market Information. https://www.cmhc-schl.gc.ca/en/professionals/housing-markets-data-and-research/housing-data/data-tables/housing-market-data/monthly-housing-starts-construction-data-tables.
Egbaria, F. (2021, December 22). 2021 in Review: Stainless steel stories of the year on MetalMiner. https://agmetalminer.com/2021/12/22/2021-in-review-stainless-steel-stories-of-the-year-on-metalminer.
Elkin, E. & Freitas, T. (2021, November 3). Fertilizer Crisis Means Higher Prices for Every Plate of Food (Repeat). Bloomberg. https://www.bloomberg.com/news/articles/2021-11-03/higher-fertilizer-prices-mean-more-food-inflation.
Garcia, L. (2021, March 11). February Weather Affects US Fertilizer Production, Wholesale Prices. DTN Fertilizer Outlook. https://www.dtnpf.com/agriculture/web/ag/crops/article/2021/03/11/February-weather-affects-us-prices.
Global Affairs Canada. (2022, February 1). Softwood Lumber. GAC. https://www.international.gc.ca/controls-controles/softwood-bois_oeuvre/index.aspx?lang=eng Gordon, J. (2021, April 19). Canada housing starts up 21.6% in March to new record - CMHC. Reuters. https://www.reuters.com/world/americas/canada-housing-starts-up-216-march-new-record-cmhc-2021-04-19.
Hoyle, R. (2021, August 23). Iron-Ore Prices Tank as China’s Steel Output Slows. Wall Street Journal. https://www.wsj.com/articles/iron-ore-prices-tank-as-chinas-steel-output-slows-11629711180.
Hoyle, R., & Wallace, J. (2022, January 30). Aluminum Prices Can’t Keep Up With Energy Costs, Driving Wave of Closures. WSJ. https://www.wsj.com/articles/aluminum-prices-cant-keep-up-with-energy-costs-driving-wave-of-closures-11643547605
Hufford, A. (2021, September 15). High Steel Prices Have Manufacturers Scrounging for Supplies. Wall Street Journal. https://www.wsj.com/articles/high-steel-prices-have-manufacturers-scrounging-for-supplies-11631698202.
IEA. (2022, January). Gas Market Report, Q1 2022 – Analysis. https://www.iea.org/reports/gas-market-report-q1-2022
Mouawad, J. (2008, March 4). Oil Prices Pass Record Set in ’80s, but Then Recede. The New York Times. https://www.nytimes.com/2008/03/03/business/worldbusiness/03cnd-oil.html
Logan, G. (2021, October 11). Wholesale Fertilizer Prices Expected to Continue Rising on Lower Production, Higher International Demand. DTN Fertilizer Outlook. https://www.dtnpf.com/agriculture/web/ag/crops/article/2021/10/11/wholesale-fertilizer-prices-expected
Madison’s Lumber Reporter. (2021, April 12). US Housing Starts Feb & Softwood Lumber Prices March: 2021. https://madisonsreport.com/2021/04/12/us-housing-starts-feb-softwood-lumber-prices-march-2021
Madison’s Lumber Reporter. (2021, April 16). US Housing Starts March and Softwood Lumber Prices April: 2021. https://madisonsreport.com/2021/04/16/us-housing-starts-march-and-softwood-lumber-prices-april-2021
Nagle, P. & Temaj, K. (2021, November 8). World Bank Blogs. Energy market developments: natural gas and coal prices surge amid constrained supply. https://blogs.worldbank.org/opendata/energy-market-developments-natural-gas-and-coal-prices-surge-amid-constrained-supply
Nicholson, M. (2021, November 19). Lumber rallies as flood blocks B.C. roads, rails. Bloomberg. https://www.bloomberg.com/news/articles/2021-11-18/lumber-rallies-as-storm-blocks-british-columbia-roads-railways.
Nickel, R. (2021, August 30). Drought shrinks Canada's wheat crop to 14-year low, shrivels canola harvest. Reuters. https://www.reuters.com/article/canada-crops-idINL1N2PY2OD
Nickel, R. (2021,October 4). Canada's drought forces canola importers to turn elsewhere. Reuters. https://www.reuters.com/article/canada-canola-idUSKBN2GU0ZI
OECD. (2021a). 90th session of the Steel Committee, virtual meeting, 22–24 September 2021 - OECD. https://www.oecd.org/industry/ind/90th-session-of-the-steel-committee.htm
OECD. (2021b). LATEST DEVELOPMENTS IN STEELMAKING CAPACITY 2021. OECD. https://www.oecd.org/industry/ind/latest-developments-in-steelmaking-capacity-2021.pdf OPEC. (2021). OPEC : Press Releases 2021. OPEC. https://www.opec.org/opec_web/en/6287.htm
Statistics Canada. (2021, November 29). Raw Materials Price Index (RMPI). Surveys and Statistical Programs. https://www23.statcan.gc.ca/imdb/p2SV.pl?Function=getSurvey&SDDS=2306
Statistics Canada. (2021, December 3). Production of principal field crops, November 2021. https://www150.statcan.gc.ca/n1/daily-quotidien/211203/dq211203b-eng.htm.
Statistics Canada. (2021, December 9). Investment in building construction, October 2021. https://www150.statcan.gc.ca/n1/daily-quotidien/211209/dq211209b-eng.htm.
Statistics Canada. (2021, December 14). Industrial Product Price Index (IPPI). Surveys and Statistical Programs. https://www23.statcan.gc.ca/imdb/p2SV.pl?Function=getSurvey&SDDS=2318.
Statistics Canada. Table 18-10-0265-01: Industrial Product Price Index, By Major Product Group, Monthly. https://www150.statcan.gc.ca/t1/tbl1/en/tv.action?pid=1810026501.
Statistics Canada. Table 18-10-0268-01: Raw Materials Price Index, Monthly. https://www150.statcan.gc.ca/t1/tbl1/en/tv.action?pid=1810026801.
Statistics Canada. Table 34-10-0158-01 Canada Mortgage and Housing Corporation, housing starts, all areas, Canada and provinces, seasonally adjusted at annual rates. https://www150.statcan.gc.ca/t1/tbl1/en/tv.action?pid=3410015801.
Stephenson, A. (2021, February 4). 'Like winning the lottery': Canola farmers rejoice as global demand pushes prices to 13-year high. Calgary Herald. https://calgaryherald.com/news/local-news/like-winning-the-lottery-canola-farmers-rejoice-as-global-demand-pushes-prices-to-13-year-high.
Thiessen, G. (1999, November 2). MONETARY POLICY REPORT - November 1999. Bank of Canada. Retrieved February 22, 2022, from https://www.bankofcanada.ca/wp-content/uploads/2010/04/mpr_nov_1999.pdf
Tita, B. (2021, September 16). U.S. Steel Plans New U.S. Mill as Prices Surge. Wall Street Journal. https://www.wsj.com/articles/u-s-steel-plans-new-u-s-mill-as-prices-surge-11631827557.
S. Census Bureau. (2021, August 18). MONTHLY NEW RESIDENTIAL CONSTRUCTION, JULY 2021. Economic Indicators Division. https://www.census.gov/construction/nrc/pdf/newresconst_202107.pdf.
S. Census Bureau. (2021, December 16). MONTHLY NEW RESIDENTIAL CONSTRUCTION, NOVEMBER 2021. Economic Indicators Division. https://www.census.gov/construction/nrc/pdf/newresconst_202111.pdf.
S. Energy Information Administration. (2012, April 20). What are natural gas liquids and how are they used? Today in Energy. https://www.eia.gov/todayinenergy/detail.php?id=5930.
S. Energy Information Administration. (2021, April 1). Short Term Energy Outlook, April 2021. Analysis and Projections. www.eia.gov/steo/archives/apr21.pdf.
S. Energy Information Administration. (2021, December 7). Short Term Energy Outlook, December 2021. Analysis and Projections. https://www.eia.gov/outlooks/steo/marketreview/crude.php.
Wade, W. (2021, November 15). U.S. Coal Hits 12-Year High, Threatening More Energy Inflation. Bloomberg. https://www.bloomberg.com/news/articles/2021-11-15/u-s-coal-prices-surge-to-highest-point-since-2009.
Warwick, F. (2021, December 7). Copper market to be well supplied in 2022. S&P Global Platts. https://www.spglobal.com/platts/en/market-insights/latest-news/metals/120721-feature-copper-market-to-be-well-supplied-in-2022
Mok, Y. C., & Lu, H. (2022, January 19). Copper markets eye easing concentrate supply in 2022. S&P Global Platts. https://www.spglobal.com/platts/en/market-insights/podcasts/focus/011922-copper-markets-eye-easing-concentrate-supply-in-2022
Zeng, Y. (2021, June 14). Recovering steel margins, strong China port prices set seaborne iron ore price up for further gains. S&P Global Platts. https://www.spglobal.com/platts/en/market-insights/latest-news/metals/061421-recovering-steel-margins-strong-china-port-prices-set-seaborne-iron-ore-price-up-for-further-gains.
Zhang, A. J. (2022, January 27). 6 key drivers shaping China’s steel sector in 2022. S&P Global Platts. https://www.spglobal.com/platts/en/market-insights/blogs/metals/012722-china-steel-2022-trends
- Date modified: