
Consumer Price Index and Inflation Perceptions in Canada: Can measurement approaches or behavioural factors explain the gap?
by Roobina Keshishbanoosy, Faouzi Tarkhani, Alice Xu, Clément Yélou (Statistics Canada)
Patrick Sabourin, Olena Kostyshyna (Bank of Canada)
Skip to text
Text begins
Abstract
Many decisions by economic agents, such as firms and consumers, depend on their views about inflation. These views have significant implications for economic activity and monetary policy. Consumers’ views of inflation, as measured by the Bank’s Canadian Survey of Consumer Expectations (CSCE), are systematically higher than the actual inflation measured by the Consumer Price Index (CPI), and more so for certain demographic groups. While measurement factors including quality adjustment, and the treatment of housing in the CPI can explain part of this gap, behavioral factors appear to play a larger role. Personal shopping experiences, views about food and rent price increases, and higher sensitivity to large price increases are important drivers of differences between measured inflation and inflation perceptions. Furthermore, information gaps and level of economic literacy can also help explain the way inflation is perceived. Policy makers can play a role to make information more readily available and to improve awareness and understanding of inflation literacy towards narrowing the perception gap.
1. Introduction
Decisions of many economic agents such as firms and consumers depend on their views about inflation. Expectations of inflation determine expectations of real interest rates and therefore are important for the effectiveness of monetary policy.
As a result, many central banks conduct surveys to better understand what people think about inflation. The Bank of Canada conducts the Canadian Survey of Consumer Expectations (CSCE) and the Business Outlook Survey and publishes their results quarterly.
To ensure that inflation perceptions are well anchored, it is important to understand their behaviour and the drivers of differences between perceived and measured inflation. For this analysis, we are focusing on views of inflation by Canadian households. Results from CSCE data indicate that there is a gap between perceived inflation and inflation measured by Statistics Canada’s Consumer Price Index (CPI). Current perceptions of the inflation rate for the past year, expectations of the inflation rate for one-year-ahead and five-years-ahead are consistently higher than the CPI inflation rate (Chart 1).Note In fact, consumer’s inflation expectations are higher than measured inflation in many other countries, including the United States, the United Kingdom and European countries. Results from CSCE show significant differences in inflation perceptions among different socio-demographic groups.Note
The following lists key drivers of the perception-measurement gap.
Measurement factors
- CPI basket weights representativeness
- Quality adjustment
- Cost of housing vs. cost of houses
Behavioural factors
- Views on some price components
- Lack of appreciation for quality changes, especially improvements
- Frequent purchases
- Large price increases
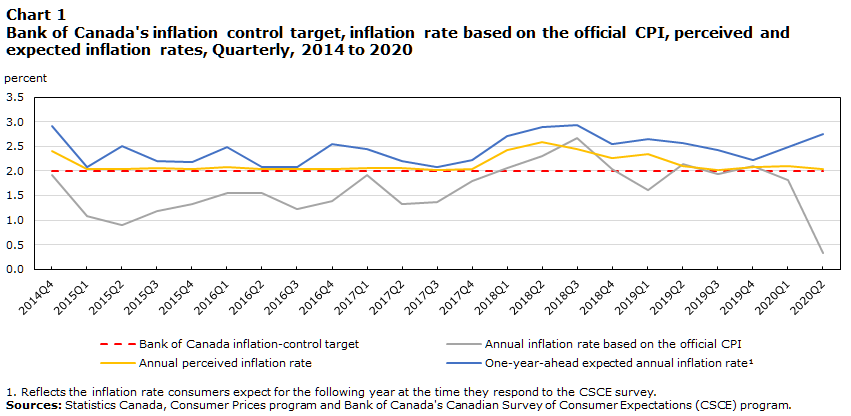
Data table for Chart 1
| Quarter | Bank of Canada inflation-control target | Annual inflation rate based on the official CPI | Annual perceived inflation rate | One-year ahead expected annual inflation rateChart 1 Note 1 |
|---|---|---|---|---|
| percent | ||||
| 2014 | ||||
| Q4 | 2.00 | 1.93 | 2.41 | 2.91 |
| 2015 | ||||
| Q1 | 2.00 | 1.08 | 2.04 | 2.08 |
| Q2 | 2.00 | 0.90 | 2.03 | 2.51 |
| Q3 | 2.00 | 1.19 | 2.06 | 2.20 |
| Q4 | 2.00 | 1.33 | 2.03 | 2.18 |
| 2016 | ||||
| Q1 | 2.00 | 1.54 | 2.08 | 2.49 |
| Q2 | 2.00 | 1.55 | 2.04 | 2.09 |
| Q3 | 2.00 | 1.23 | 2.04 | 2.08 |
| Q4 | 2.00 | 1.39 | 2.03 | 2.54 |
| 2017 | ||||
| Q1 | 2.00 | 1.91 | 2.06 | 2.44 |
| Q2 | 2.00 | 1.32 | 2.05 | 2.20 |
| Q3 | 2.00 | 1.37 | 2.01 | 2.08 |
| Q4 | 2.00 | 1.79 | 2.03 | 2.23 |
| 2018 | ||||
| Q1 | 2.00 | 2.06 | 2.43 | 2.71 |
| Q2 | 2.00 | 2.30 | 2.59 | 2.89 |
| Q3 | 2.00 | 2.68 | 2.45 | 2.93 |
| Q4 | 2.00 | 2.04 | 2.27 | 2.54 |
| 2019 | ||||
| Q1 | 2.00 | 1.61 | 2.34 | 2.64 |
| Q2 | 2.00 | 2.15 | 2.10 | 2.57 |
| Q3 | 2.00 | 1.94 | 2.01 | 2.42 |
| Q4 | 2.00 | 2.09 | 2.07 | 2.23 |
| 2020 | ||||
| Q1 | 2.00 | 1.81 | 2.10 | 2.49 |
| Q2 | 2.00 | 0.33 | 2.04 | 2.75 |
|
||||
2. Representativeness of the expenditure basket weights used in the CPI aggregation
This section reviews if there are differences in experienced inflation rates among socio-demographic household groups and if this could explain the perception-measurement gap.
When consumers form their perceptions of inflation, they likely refer to their own experiences of changes in the cost of living, and that experience could be different for each socio-demographic group. The CPI, as a multipurpose indicator cannot fully meet the needs of all users and uses, and it may not represent the best possible measure of changes in the cost-of-living.
The CPI measures price changes for its entire target populationNote and is based on the average Canadian’s consumption pattern, instead of a specific household or household group. For example, a household either owns its accommodation or rents it, may or may not face child care expenses or university tuition fees; however, all these expenditure categories are included in the CPI basket of goods and services. As such, consumers may feel that the price changes they face do not match the inflation rate as measured by the CPI. The CPI inflation rate cannot be expected to reflect the inflation experience of any one Canadian consumer.
Alternative inflation rates are calculated for selected household groups and compared to the overall CPI inflation rate and to the groups’ perceptions of inflation. These groups are:
- Households that are homeowners
- Households that are renters
- Lower income and higher income householdsNote
- Households with university level education and those without
- Households with children under the age of 18
- Household profiles based on gender, and
- Age groups defined as youth (age 18-30); middle-aged (age 31-54); and seniors (age over 55).
Expenditure weights estimated for these groupsNote are used to estimate group-specific CPI series that reflect the consumption pattern of each group (Approach 1).
Expenditure weights pertaining to individual households are also used to estimate household-specific CPIs and inflation ratesNote , Note , Note (Approach 2), which is comparable to using the Personal Inflation Calculator.Note , Note
The alternate inflation measures based on Approach 1 or Approach 2Note track the official CPI inflation rate very closely. The dynamics and the magnitude of inflation rate would have been nearly the same if the CPI were calculated using these approaches.
2.1 Inflation rates based on household group-specific expenditure weights (Approach 1)
Using Approach 1, the differences of inflation rates among household groups are small and do not represent a significant contribution to the perception-measurement gap.
Lower-income households experienced slightly weaker inflation than higher-income households
For instance, the average inflation rate estimated for lower-income households is only slightly weaker than that calculated for higher-income households (Chart 2).Note Compared to higher-income households, lower-income households spend a higher proportion of their total expenditures on shelter (33.1% vs. 23.7%) and a lower proportion of their total expenditures on transportation (15.4% vs. 21.9%) as well as on recreation, education and reading categories (9.9% vs. 12.8%). Shelter inflation for the lower-income group is lower compared with the higher-income group.Note Thus, a combination of a larger expenditure share on shelter and a weaker shelter inflation contributed to a slightly weaker total inflation for the lower-income households group.Note , Note
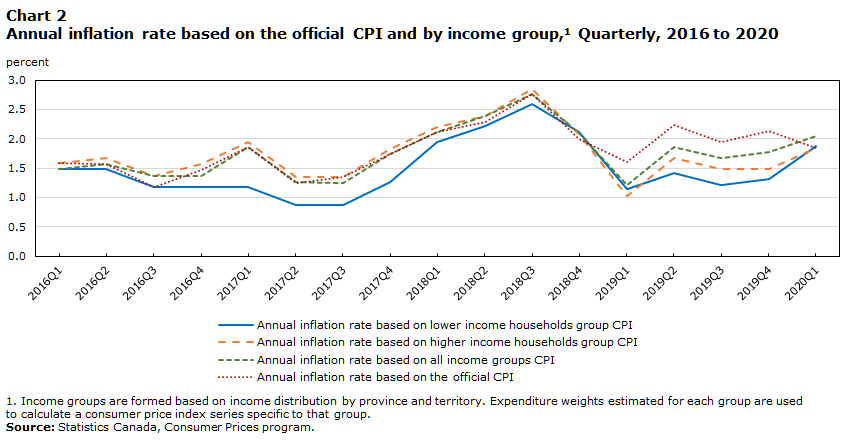
Data table for Chart 2
| Quarter | Annual inflation rate based on lower income households group CPI | Annual inflation rate based on higher income households group CPI | Annual inflation rate based all income groups CPI | Annual inflation rate based on the official CPI |
|---|---|---|---|---|
| percent | ||||
| 2016 | ||||
| Q1 | 1.49 | 1.59 | 1.49 | 1.59 |
| Q2 | 1.48 | 1.67 | 1.57 | 1.57 |
| Q3 | 1.18 | 1.37 | 1.37 | 1.17 |
| Q4 | 1.18 | 1.57 | 1.37 | 1.47 |
| 2017 | ||||
| Q1 | 1.18 | 1.95 | 1.86 | 1.86 |
| Q2 | 0.87 | 1.35 | 1.26 | 1.25 |
| Q3 | 0.87 | 1.35 | 1.25 | 1.35 |
| Q4 | 1.26 | 1.83 | 1.74 | 1.74 |
| 2018 | ||||
| Q1 | 1.94 | 2.20 | 2.11 | 2.11 |
| Q2 | 2.21 | 2.38 | 2.39 | 2.29 |
| Q3 | 2.60 | 2.85 | 2.76 | 2.76 |
| Q4 | 2.11 | 2.08 | 2.09 | 1.99 |
| 2019 | ||||
| Q1 | 1.14 | 1.03 | 1.22 | 1.60 |
| Q2 | 1.41 | 1.67 | 1.86 | 2.24 |
| Q3 | 1.22 | 1.48 | 1.67 | 1.95 |
| Q4 | 1.31 | 1.48 | 1.77 | 2.14 |
| 2020 | ||||
| Q1 | 1.88 | 1.85 | 2.04 | 1.85 |
|
||||
Looking at other household groups, renters have experienced slightly lower inflation than homeowners, and so do households with no university degree relative to those with one. The inflation experience of households with children under 18 closely resembles the official CPI inflation rate.
2.2 Average of inflation rates based on household-specific expenditure weights (Approach 2)
Overall, consumers’ perceptions about inflation do not match estimated inflation rates. On average, estimated inflation is similar across age groups. However, youth have higher and more volatile inflation perceptions relative to other age groups.
Using the mean or the median of the distribution of household-specific inflation rate within age groups, the overall inflation rates for the three age groups track each other very closely and are similar to the headline CPI inflation rate. This result contrasts with the distribution of inflation perceptions within age groups. For instance, consumers aged 31 and up displayed a stable perceived inflation rate around 2%, while younger consumers have higher and more volatile perceptions of inflation.
Larger proportions of perceived inflation rates are higher than 4% while larger proportions of household-specific inflation rates are lower than 1%
The majority of household-specific inflation rates and perceived inflation rates are within the Bank’s inflation-control target range of 1% to 3% (Chart 3). However, perceived inflation rates above 4% have been reported by a significantly higher proportion of the Bank of Canada’s CSCE survey participants (about a quarter vs. less than 5% for estimated inflation rate). Household-specific inflation rates below 1% have been reported for a significantly higher proportion of the SHS diary respondents (nearly 30% vs. nearly 20% for perceived inflation rate)Note (Figure 3).

Data table for Chart 3
| Inflation rate | Household-specific CPI inflation rate | Perceived inflation rate |
|---|---|---|
| percent | ||
| Below -3 | 0.70 | 4.21 |
| (-3,0] | 9.27 | 5.96 |
| (0,1] | 18.92 | 9.05 |
| (1,2] | 31.73 | 34.26 |
| (2,3] | 24.84 | 17.22 |
| (3,4] | 9.77 | 5.12 |
| (4,5] | 3.06 | 7.31 |
| (5,6] | 1.03 | 1.50 |
| Above 6 | 0.69 | 15.36 |
| Sources: Statistics Canada, Consumer Prices program and Bank of Canada's Canadian Survey of Consumer Expectations. | ||
In summary, consumers’ experience of inflation not only depends on the price movements of the commodities they purchase, but also depends on their respective expenditure shares of these commodities. The inflation rates estimated for the different household groups are very similar to the overall official CPI inflation rate. This result supports the conclusion of a previous study on consumer price index for seniors, which found that seniors faced similar rates of inflation as the average Canadian.Note Consumers’ perceptions of inflation among specific household groups, however, do not match their estimated inflation rates.
3. Quality adjustment of prices used in the CPI
To accurately measure pure price change, the quality of goods and services in the CPI product sample needs to be the same or equivalent over time. However, the quality of certain products—such as electronics, cars and internet services—is constantly improving, while prices may be increasing. Thus, measured price changes need to be adjusted for quality changes.Note
Consumers’ perceived rate of inflation may be different from the official inflation measured by CPI if they are not accounting for quality changes for the products they purchase. This is especially true in markets with high technological change (electronics, internet services).
To illustrate the difference between measured and perceived inflation, we have chosen select products (including goods and services), estimated the non-quality adjusted indexesNote and compared those with the official quality adjusted ones.
For internet access services, quality adjustments are done using a hedonic approach.Note The average internet prices (non-quality adjusted index) have increased after 2018 as a result of marked increases in upload and download speeds, while the internet access services price index based on quality adjusted prices remained stable. This is because the quality-adjusted index considers these improved characteristics.
For computers, equipment, software and supplies index, there are constant positive technological changes in the corresponding products. The quality adjusted series show a downward trend while the raw data do notNote (see Chart 4).
In the case of rent price index, quality adjustments do have some effect on the final measured prices, however, they closely follow the observed average prices (Chart 5).
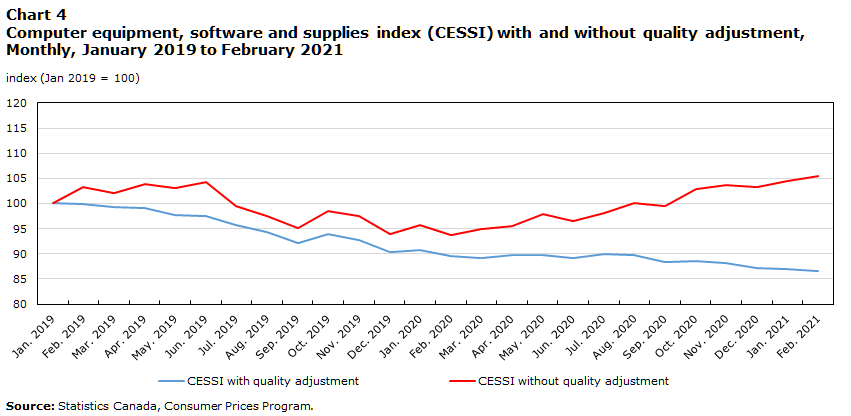
Data table for Chart 4
| Month | CESSI with quality adjustment | CESSI without quality adjustment |
|---|---|---|
| index (Jan 2019 = 100) | ||
| 2019 | ||
| January | 100.00 | 100.00 |
| February | 99.88 | 103.30 |
| March | 99.24 | 102.15 |
| April | 99.09 | 103.92 |
| May | 97.66 | 103.18 |
| June | 97.57 | 104.27 |
| July | 95.74 | 99.58 |
| August | 94.24 | 97.47 |
| September | 92.05 | 95.19 |
| October | 93.96 | 98.52 |
| November | 92.70 | 97.57 |
| December | 90.29 | 93.93 |
| 2020 | ||
| January | 90.78 | 95.67 |
| February | 89.64 | 93.79 |
| March | 89.18 | 94.93 |
| April | 89.74 | 95.52 |
| May | 89.67 | 97.97 |
| June | 89.14 | 96.55 |
| July | 89.93 | 98.15 |
| August | 89.68 | 100.13 |
| September | 88.28 | 99.53 |
| October | 88.52 | 102.81 |
| November | 88.23 | 103.59 |
| December | 87.24 | 103.31 |
| 2021 | ||
| January | 86.91 | 104.54 |
| February | 86.64 | 105.37 |
| Source: Statistics Canada, Consumer Prices Program | ||

Data table for Chart 5
| Month | Rent index with quality adjustment | Rent index without quality adjustment |
|---|---|---|
| index (Jan 2019 = 100) | ||
| 2019 | ||
| January | 100.00 | 100.00 |
| February | 100.35 | 100.84 |
| March | 99.99 | 100.64 |
| April | 100.09 | 100.72 |
| May | 100.35 | 100.82 |
| June | 100.62 | 100.49 |
| July | 101.05 | 101.15 |
| August | 101.06 | 100.73 |
| September | 101.76 | 101.77 |
| October | 101.41 | 101.55 |
| November | 101.82 | 101.93 |
| December | 101.77 | 101.99 |
| 2020 | ||
| January | 102.58 | 102.43 |
| February | 102.61 | 102.93 |
| March | 102.05 | 102.87 |
| April | 101.36 | 102.77 |
| May | 101.98 | 102.65 |
| June | 101.66 | 102.30 |
| Source: Statistics Canada, Consumer Prices Program | ||
Chart 6 presents the distribution of the CPI product categories according to the type of quality adjustment. Around one sixth of the basket is subject to regular positive adjustment (green slices).Note
Looking at the remaining five sixths of the basket (grey, blue and red slices):
- Prices for some other CPI components may be adjusted upward following a drop in quality (e.g. clothing).
- Not all goods or services experience quality changes or improvements over time. For example, gasoline has mostly the same quality and as such, gasoline prices do not need any quality adjustment to be applied.Note
- Certain types of quality adjustment deal with standardization, e.g., size, weight and packaging, and are mostly applied to food products, which can go either way (up or down). As an example, we have found that since 2019, the inflation rate for cheese using non-quality adjusted prices is lower than the official inflation rate for cheese.
The net impact of quality adjustment on the overall CPI inflation is not clear and cannot be easily estimated.

Data table for Chart 6
| Index grouping | Percent |
|---|---|
| Clothing & othersChart 6 Note 1 | 31 |
| GasolineChart 6 Note 3 | 3 |
| Electricity & othersChart 6 Note 3 | 28 |
| Food, Alcohol, Beverages, Tobacco products & othersChart 6 Note 2 | 22 |
| Cellphones & othersChart 6 Note 4 | 4 |
| Cars and appliancesChart 6 Note 4 | 12 |
|
|
In general, there is no systematic difference between price indices based on quality-adjusted prices and their counterparts based on non-quality adjusted prices. However, on average, inflation rates based on non-quality adjusted prices series are slightly higher for some CPI categories such as computer equipment and software or refrigerators. As such, it seems that the impact of the quality adjustment on overall CPI could be positive but small, and could only explain a modest portion of the perception-measurement gap. Statistics Canada will conduct more research in the future to extract and analyze the potential impacts of quality adjustments on specific products, as well as on the overall CPI.
4. The cost of a house vs. the cost of housing services in the Canadian CPI
Shelter services represent an important category of consumer spending in Canada. In the CPI basket, owned accommodation (OA) typically accounts for more than half of total spending on shelter services.
However, estimated OA expenditure weights and price movements are critically dependent on the approach used for their measurement. The treatment of OA in the CPI is an essential part of the debate over how to explain the gap between perceived and measured inflation. When households think about changes in the price of housing, they likely refer to how much it costs to buy a house and less likely to how much it costs to own (or use) a house. The difference between the price of a house and the cost of housing services can be a source of confusion that could contribute to the gap between perceived and estimated CPI inflation.
This part of the study addresses the following questions:
- Is the public confusion between cost of houses and cost of housing services a contributing factor for the perception-measurement gap?
- How should the owned accommodation be measured in the CPI? Should it reflect the cost of houses or the cost of housing services?
4.1 Approaches to the treatment of owned accommodation in the CPI
One of most complex and difficult questions is how should statistical agencies treat the owned accommodation in their CPI. Statistics Canada’s owned accommodation price index is designed to detect the impact of price changes on homeowners’ specific cost of shelter. Homeowners’ specific cost of shelter has the following components: replacement cost or depreciation cost,Note mortgage interest cost, property taxes, the cost of homeowners’ insurance, the cost of homeowners’ maintenance and repair, and other ongoing costs related to owning the accommodation. This approach considers a house as an asset rather than a consumer good. Therefore, the prices reflect the costs incurred by the homeowner to use and maintain the home, but not the purchase price of the home.
Changes in housing prices affect most of these components. For example, they directly affect the mortgage interest cost and replacement cost,Note as the housing price is part of their price index calculations. They indirectly impact the property taxes and homeowner insurance premium through changes in the property assessment values and the replacement cost of houses.
In Australia, the Australian Bureau of Statistics applies the Acquisitions Approach, in which the owned accommodation service is treated similarly to other durables in the CPI such as passenger vehicles. In the CPI basket, all expenditures on housing purchases by Australian households are attributed to the period of purchase, even though the use of the purchased house extends beyond that period.
Finally, three alternative approaches are possible. Many statistical agenciesNote use the Rental Equivalence Approach, in which services obtained from owned accommodation are based on their rental values. This approach requires getting information from the rental market.Note Other statistical agenciesNote use the User Cost Approach, in which they include actual and imputed costsNote of owned accommodation services. Some countriesNote do not include any imputed costs components. Only actual cash costs are thus included, applying the Payments Approach, a variant of the user cost approach.
4.2 Alternative approaches to the treatment of owned accommodation have varying impacts on the all-items CPI
In this section, the proportional expenditure weights for the owned accommodation component based on the different approaches are derived for 2001, 2005, 2009, 2011, 2013, 2015, and 2017 CPI basket reference years. Over time, the expenditure shares based on the Statistics Canada’s approach, the payments approach and the rental equivalence approach vary much less than the estimates based on the user cost and acquisitions approaches.
Inflation rates based on the payments approach are similar to the headline inflation rates, however for the user cost approach they display higher variability over time. The all-items CPI annual inflation rate using the rental equivalence approach for the owned accommodation component is lower than the official headline inflation rate, while the inflation rate based on the acquisitions approach is remarkably higher than the official headline inflation rate (Figure 7 and Figure 8). This is because rising housing prices are more importantly reflected in the inflation rates based on the acquisitions approach.

Data table for Chart 7
| Month | Statistics Canada's approach | User cost approach | Payments approach |
|---|---|---|---|
| 12 month percentage change | |||
| 2004 | |||
| January | 1.3 | 2.9 | 1.1 |
| February | 0.7 | 2.4 | 0.6 |
| March | 0.8 | 2.4 | 0.6 |
| April | 1.7 | 3.2 | 1.5 |
| May | 2.4 | 3.9 | 2.3 |
| June | 2.5 | 4.0 | 2.3 |
| July | 2.3 | 3.8 | 2.1 |
| August | 1.8 | 3.5 | 1.7 |
| September | 1.8 | 3.3 | 1.6 |
| October | 2.3 | 3.7 | 2.2 |
| November | 2.4 | 3.6 | 2.3 |
| December | 2.1 | 3.4 | 2.0 |
| 2005 | |||
| January | 1.9 | 3.3 | 1.8 |
| February | 2.1 | 3.3 | 2.0 |
| March | 2.3 | 3.5 | 2.2 |
| April | 2.4 | 3.5 | 2.3 |
| May | 1.6 | 2.9 | 1.5 |
| June | 1.7 | 3.0 | 1.6 |
| July | 2.0 | 3.2 | 1.9 |
| August | 2.6 | 3.6 | 2.5 |
| September | 3.2 | 4.2 | 3.3 |
| October | 2.6 | 3.7 | 2.5 |
| November | 2.0 | 3.4 | 1.9 |
| December | 2.1 | 3.5 | 2.0 |
| 2006 | |||
| January | 2.8 | 4.0 | 2.7 |
| February | 2.2 | 3.6 | 2.1 |
| March | 2.2 | 3.7 | 2.0 |
| April | 2.4 | 4.1 | 2.3 |
| May | 2.8 | 4.5 | 2.7 |
| June | 2.4 | 4.3 | 2.3 |
| July | 2.3 | 4.5 | 2.2 |
| August | 2.1 | 4.7 | 1.9 |
| September | 0.7 | 3.8 | 0.4 |
| October | 1.0 | 4.0 | 0.7 |
| November | 1.4 | 4.3 | 1.2 |
| December | 1.7 | 4.4 | 1.4 |
| 2007 | |||
| January | 1.1 | 3.9 | 0.9 |
| February | 2.0 | 4.4 | 1.8 |
| March | 2.3 | 4.4 | 2.2 |
| April | 2.2 | 4.2 | 2.0 |
| May | 2.2 | 4.2 | 2.0 |
| June | 2.2 | 4.1 | 2.0 |
| July | 2.2 | 3.9 | 2.0 |
| August | 1.7 | 3.3 | 1.6 |
| September | 2.5 | 3.6 | 2.4 |
| October | 2.4 | 3.3 | 2.4 |
| November | 2.5 | 3.2 | 2.4 |
| December | 2.4 | 2.9 | 2.3 |
| 2008 | |||
| January | 2.2 | 2.6 | 2.1 |
| February | 1.8 | 2.3 | 1.7 |
| March | 1.4 | 1.9 | 1.2 |
| April | 1.7 | 2.0 | 1.7 |
| May | 2.2 | 2.1 | 2.2 |
| June | 3.1 | 2.5 | 3.1 |
| July | 3.4 | 2.5 | 3.5 |
| August | 3.5 | 2.4 | 3.6 |
| September | 3.4 | 2.0 | 3.4 |
| October | 2.6 | 1.1 | 2.6 |
| November | 2.0 | 0.3 | 2.0 |
| December | 1.2 | -0.6 | 1.3 |
| 2009 | |||
| January | 1.1 | -1.1 | 1.1 |
| February | 1.4 | -1.2 | 1.5 |
| March | 1.2 | -1.7 | 1.3 |
| April | 0.4 | -2.7 | 0.4 |
| May | 0.1 | -2.9 | 0.2 |
| June | -0.3 | -3.1 | -0.1 |
| July | -0.9 | -3.5 | -0.9 |
| August | -0.8 | -3.0 | -0.6 |
| September | -0.9 | -2.7 | -0.8 |
| October | 0.1 | -1.5 | 0.2 |
| November | 1.0 | -0.1 | 1.1 |
| December | 1.3 | 0.6 | 1.3 |
| 2010 | |||
| January | 1.9 | 1.7 | 1.9 |
| February | 1.6 | 2.0 | 1.6 |
| March | 1.4 | 2.3 | 1.4 |
| April | 1.8 | 3.1 | 1.8 |
| May | 1.4 | 2.8 | 1.3 |
| June | 1.0 | 2.5 | 0.8 |
| July | 1.8 | 3.2 | 1.8 |
| August | 1.7 | 2.8 | 1.6 |
| September | 1.9 | 2.5 | 1.8 |
| October | 2.4 | 2.5 | 2.3 |
| November | 2.0 | 1.7 | 1.9 |
| December | 2.4 | 1.8 | 2.3 |
| 2011 | |||
| January | 2.3 | 1.6 | 2.3 |
| February | 2.2 | 1.5 | 2.1 |
| March | 3.3 | 2.4 | 3.2 |
| April | 3.3 | 2.5 | 3.3 |
| May | 3.7 | 2.8 | 3.7 |
| June | 3.1 | 2.4 | 3.2 |
| July | 2.7 | 2.2 | 2.8 |
| August | 3.1 | 2.6 | 3.0 |
| September | 3.2 | 3.0 | 3.3 |
| October | 2.9 | 3.0 | 3.0 |
| November | 2.9 | 3.0 | 2.8 |
| December | 2.3 | 2.5 | 2.3 |
| 2012 | |||
| January | 2.5 | 2.6 | 2.5 |
| February | 2.6 | 2.7 | 2.6 |
| March | 1.9 | 2.2 | 1.9 |
| April | 2.0 | 2.2 | 1.9 |
| May | 1.2 | 1.6 | 1.3 |
| June | 1.5 | 1.7 | 1.4 |
| July | 1.3 | 1.4 | 1.1 |
| August | 1.2 | 1.5 | 1.3 |
| September | 1.2 | 1.2 | 1.1 |
| October | 1.2 | 1.2 | 1.1 |
| November | 0.8 | 0.9 | 0.8 |
| December | 0.8 | 1.0 | 0.8 |
| 2013 | |||
| January | 0.5 | 0.6 | 0.4 |
| February | 1.2 | 1.3 | 1.2 |
| March | 1.0 | 1.1 | 1.0 |
| April | 0.4 | 0.6 | 0.3 |
| May | 0.7 | 0.7 | 0.6 |
| June | 1.2 | 1.2 | 1.2 |
| July | 1.3 | 1.3 | 1.3 |
| August | 1.1 | 1.1 | 1.0 |
| September | 1.1 | 1.2 | 1.0 |
| October | 0.7 | 0.9 | 0.7 |
| November | 0.9 | 1.2 | 0.9 |
| December | 1.2 | 1.6 | 1.3 |
| 2014 | |||
| January | 1.5 | 1.8 | 1.5 |
| February | 1.1 | 1.6 | 1.1 |
| March | 1.5 | 2.0 | 1.5 |
| April | 2.0 | 2.4 | 2.1 |
| May | 2.3 | 2.6 | 2.3 |
| June | 2.4 | 2.5 | 2.4 |
| July | 2.1 | 2.2 | 2.1 |
| August | 2.1 | 2.2 | 2.1 |
| September | 2.0 | 2.2 | 2.1 |
| October | 2.4 | 2.5 | 2.4 |
| November | 2.0 | 2.1 | 1.9 |
| December | 1.5 | 1.6 | 1.4 |
| 2015 | |||
| January | 1.0 | 1.3 | 1.0 |
| February | 1.0 | 1.2 | 1.0 |
| March | 1.2 | 1.3 | 1.2 |
| April | 0.8 | 0.9 | 0.8 |
| May | 0.9 | 1.0 | 0.9 |
| June | 1.0 | 1.2 | 1.1 |
| July | 1.3 | 1.5 | 1.3 |
| August | 1.3 | 1.4 | 1.3 |
| September | 1.0 | 1.2 | 1.0 |
| October | 1.0 | 1.3 | 1.0 |
| November | 1.4 | 1.6 | 1.3 |
| December | 1.6 | 1.8 | 1.6 |
| 2016 | |||
| January | 2.0 | 2.1 | 2.0 |
| February | 1.4 | 1.6 | 1.3 |
| March | 1.3 | 1.6 | 1.2 |
| April | 1.7 | 2.1 | 1.7 |
| May | 1.5 | 2.1 | 1.5 |
| June | 1.5 | 2.1 | 1.4 |
| July | 1.3 | 2.0 | 1.1 |
| August | 1.1 | 2.0 | 1.0 |
| September | 1.3 | 2.3 | 1.2 |
| October | 1.5 | 2.4 | 1.4 |
| November | 1.2 | 2.2 | 1.1 |
| December | 1.5 | 2.4 | 1.4 |
| 2017 | |||
| January | 2.1 | 3.1 | 2.0 |
| February | 2.0 | 3.1 | 2.0 |
| March | 1.6 | 2.6 | 1.5 |
| April | 1.6 | 2.8 | 1.6 |
| May | 1.3 | 2.6 | 1.1 |
| June | 1.0 | 2.4 | 0.9 |
| July | 1.2 | 2.6 | 1.1 |
| August | 1.4 | 2.4 | 1.2 |
| September | 1.6 | 2.2 | 1.4 |
| October | 1.4 | 1.9 | 1.2 |
| November | 2.1 | 2.5 | 2.1 |
| December | 1.9 | 2.2 | 1.8 |
| 2018 | |||
| January | 1.7 | 2.0 | 1.6 |
| February | 2.2 | 2.4 | 2.1 |
| March | 2.3 | 2.5 | 2.2 |
| April | 2.2 | 2.1 | 2.1 |
| May | 2.2 | 2.0 | 2.3 |
| June | 2.5 | 2.0 | 2.5 |
| July | 3.0 | 2.2 | 3.1 |
| August | 2.8 | 2.1 | 2.9 |
| September | 2.2 | 1.6 | 2.3 |
| October | 2.4 | 1.9 | 2.6 |
| November | 1.7 | 1.2 | 1.7 |
| December | 2.0 | 1.5 | 2.1 |
| 2019 | |||
| January | 1.4 | 1.0 | 1.5 |
| February | 1.5 | 0.9 | 1.6 |
| March | 1.9 | 1.1 | 2.0 |
| April | 2.0 | 1.4 | 2.1 |
| May | 2.4 | 1.6 | 2.5 |
| June | 2.0 | 1.3 | 2.1 |
| July | 2.0 | 1.3 | 2.2 |
| August | 1.9 | 1.1 | 2.0 |
| September | 1.9 | 1.2 | 2.0 |
| October | 1.9 | 1.3 | 2.0 |
| November | 2.2 | 1.6 | 2.3 |
| December | 2.2 | 1.7 | 2.3 |
| 2020 | |||
| January | 2.4 | 1.9 | 2.5 |
| February | 2.2 | 1.9 | 2.3 |
| March | 0.9 | 1.0 | 0.8 |
|
Note: Last observation: March 2020. Source: Statistics Canada, Consumer Prices program. |
|||

Data table for Chart 8
| Month | Statistics Canada's approach | Rental equivalent approach | Acquisitions approach |
|---|---|---|---|
| 12 month percentage change | |||
| 2004 | |||
| January | 1.3 | 1.0 | 1.6 |
| February | 0.7 | 0.5 | 1.0 |
| March | 0.8 | 0.5 | 1.1 |
| April | 1.7 | 1.4 | 2.0 |
| May | 2.4 | 2.2 | 3.0 |
| June | 2.5 | 2.2 | 3.0 |
| July | 2.3 | 2.0 | 2.8 |
| August | 1.8 | 1.5 | 2.2 |
| September | 1.8 | 1.5 | 2.2 |
| October | 2.3 | 2.0 | 2.7 |
| November | 2.4 | 2.1 | 2.8 |
| December | 2.1 | 1.8 | 2.5 |
| 2005 | |||
| January | 1.9 | 1.6 | 2.3 |
| February | 2.1 | 1.7 | 2.4 |
| March | 2.3 | 2.0 | 2.6 |
| April | 2.4 | 2.0 | 2.7 |
| May | 1.6 | 1.2 | 1.9 |
| June | 1.7 | 1.3 | 2.0 |
| July | 2.0 | 1.6 | 2.3 |
| August | 2.6 | 2.2 | 3.0 |
| September | 3.2 | 2.9 | 3.7 |
| October | 2.6 | 2.2 | 3.0 |
| November | 2.0 | 1.7 | 2.5 |
| December | 2.1 | 1.8 | 2.5 |
| 2006 | |||
| January | 2.8 | 2.4 | 3.3 |
| February | 2.2 | 1.8 | 2.6 |
| March | 2.2 | 1.7 | 2.6 |
| April | 2.4 | 2.0 | 2.9 |
| May | 2.8 | 2.4 | 3.3 |
| June | 2.4 | 2.0 | 3.0 |
| July | 2.3 | 1.8 | 2.9 |
| August | 2.1 | 1.5 | 2.7 |
| September | 0.7 | 0.1 | 1.2 |
| October | 1.0 | 0.3 | 1.4 |
| November | 1.4 | 0.8 | 1.9 |
| December | 1.7 | 1.0 | 2.1 |
| 2007 | |||
| January | 1.1 | 0.5 | 1.5 |
| February | 2.0 | 1.4 | 2.4 |
| March | 2.3 | 1.7 | 2.7 |
| April | 2.2 | 1.6 | 2.5 |
| May | 2.2 | 1.6 | 2.5 |
| June | 2.2 | 1.6 | 2.6 |
| July | 2.2 | 1.5 | 2.4 |
| August | 1.7 | 1.2 | 2.0 |
| September | 2.5 | 2.0 | 2.8 |
| October | 2.4 | 1.9 | 2.7 |
| November | 2.5 | 1.9 | 2.7 |
| December | 2.4 | 1.8 | 2.5 |
| 2008 | |||
| January | 2.2 | 1.6 | 2.3 |
| February | 1.8 | 1.3 | 2.0 |
| March | 1.4 | 0.8 | 1.4 |
| April | 1.7 | 1.2 | 1.7 |
| May | 2.2 | 1.7 | 2.2 |
| June | 3.1 | 2.6 | 3.0 |
| July | 3.4 | 2.9 | 3.3 |
| August | 3.5 | 3.1 | 3.3 |
| September | 3.4 | 2.9 | 3.1 |
| October | 2.6 | 2.2 | 2.2 |
| November | 2.0 | 1.6 | 1.6 |
| December | 1.2 | 1.0 | 0.8 |
| 2009 | |||
| January | 1.1 | 0.8 | 0.6 |
| February | 1.4 | 1.2 | 0.9 |
| March | 1.2 | 1.1 | 0.7 |
| April | 0.4 | 0.3 | -0.3 |
| May | 0.1 | 0.2 | -0.4 |
| June | -0.3 | -0.1 | -0.6 |
| July | -0.9 | -0.8 | -1.2 |
| August | -0.8 | -0.5 | -0.8 |
| September | -0.9 | -0.6 | -0.8 |
| October | 0.1 | 0.4 | 0.4 |
| November | 1.0 | 1.4 | 1.5 |
| December | 1.3 | 1.7 | 1.9 |
| 2010 | |||
| January | 1.9 | 2.3 | 2.7 |
| February | 1.6 | 2.0 | 2.6 |
| March | 1.4 | 1.7 | 2.5 |
| April | 1.8 | 2.1 | 3.0 |
| May | 1.4 | 1.6 | 2.4 |
| June | 1.0 | 1.1 | 1.9 |
| July | 1.8 | 1.9 | 2.8 |
| August | 1.7 | 1.7 | 2.5 |
| September | 1.9 | 1.9 | 2.5 |
| October | 2.4 | 2.3 | 2.9 |
| November | 2.0 | 1.9 | 2.3 |
| December | 2.4 | 2.2 | 2.7 |
| 2011 | |||
| January | 2.3 | 2.2 | 2.6 |
| February | 2.2 | 2.0 | 2.5 |
| March | 3.3 | 3.1 | 3.5 |
| April | 3.3 | 3.2 | 3.7 |
| May | 3.7 | 3.5 | 4.0 |
| June | 3.1 | 3.1 | 3.5 |
| July | 2.7 | 2.7 | 3.2 |
| August | 3.1 | 2.9 | 3.5 |
| September | 3.2 | 3.1 | 3.8 |
| October | 2.9 | 2.9 | 3.5 |
| November | 2.9 | 2.8 | 3.4 |
| December | 2.3 | 2.3 | 2.8 |
| 2012 | |||
| January | 2.5 | 2.4 | 2.9 |
| February | 2.6 | 2.6 | 3.0 |
| March | 1.9 | 1.9 | 2.4 |
| April | 2.0 | 1.9 | 2.4 |
| May | 1.2 | 1.3 | 1.7 |
| June | 1.5 | 1.5 | 1.9 |
| July | 1.3 | 1.2 | 1.6 |
| August | 1.2 | 1.4 | 1.7 |
| September | 1.2 | 1.2 | 1.5 |
| October | 1.2 | 1.2 | 1.5 |
| November | 0.8 | 1.0 | 1.2 |
| December | 0.8 | 1.0 | 1.2 |
| 2013 | |||
| January | 0.5 | 0.7 | 0.9 |
| February | 1.2 | 1.4 | 1.6 |
| March | 1.0 | 1.2 | 1.3 |
| April | 0.4 | 0.6 | 0.7 |
| May | 0.7 | 0.9 | 1.0 |
| June | 1.2 | 1.4 | 1.5 |
| July | 1.3 | 1.6 | 1.7 |
| August | 1.1 | 1.2 | 1.4 |
| September | 1.1 | 1.2 | 1.4 |
| October | 0.7 | 0.8 | 1.1 |
| November | 0.9 | 1.1 | 1.3 |
| December | 1.2 | 1.4 | 1.7 |
| 2014 | |||
| January | 1.5 | 1.5 | 1.9 |
| February | 1.1 | 1.1 | 1.7 |
| March | 1.5 | 1.5 | 2.0 |
| April | 2.0 | 2.0 | 2.5 |
| May | 2.3 | 2.2 | 2.7 |
| June | 2.4 | 2.2 | 2.7 |
| July | 2.1 | 2.0 | 2.5 |
| August | 2.1 | 2.0 | 2.6 |
| September | 2.0 | 2.0 | 2.6 |
| October | 2.4 | 2.3 | 2.9 |
| November | 2.0 | 1.9 | 2.4 |
| December | 1.5 | 1.4 | 2.0 |
| 2015 | |||
| January | 1.0 | 1.0 | 1.6 |
| February | 1.0 | 1.0 | 1.6 |
| March | 1.2 | 1.2 | 1.7 |
| April | 0.8 | 0.8 | 1.3 |
| May | 0.9 | 0.9 | 1.4 |
| June | 1.0 | 1.0 | 1.6 |
| July | 1.3 | 1.3 | 1.9 |
| August | 1.3 | 1.2 | 1.8 |
| September | 1.0 | 0.9 | 1.5 |
| October | 1.0 | 0.9 | 1.5 |
| November | 1.4 | 1.2 | 1.9 |
| December | 1.6 | 1.4 | 2.1 |
| 2016 | |||
| January | 2.0 | 1.8 | 2.4 |
| February | 1.4 | 1.2 | 1.8 |
| March | 1.3 | 1.1 | 1.8 |
| April | 1.7 | 1.5 | 2.3 |
| May | 1.5 | 1.3 | 2.2 |
| June | 1.5 | 1.2 | 2.2 |
| July | 1.3 | 0.9 | 2.0 |
| August | 1.1 | 0.9 | 1.9 |
| September | 1.3 | 1.1 | 2.2 |
| October | 1.5 | 1.2 | 2.3 |
| November | 1.2 | 0.9 | 2.0 |
| December | 1.5 | 1.1 | 2.3 |
| 2017 | |||
| January | 2.1 | 1.8 | 3.0 |
| February | 2.0 | 1.7 | 2.9 |
| March | 1.6 | 1.3 | 2.5 |
| April | 1.6 | 1.3 | 2.6 |
| May | 1.3 | 0.9 | 2.1 |
| June | 1.0 | 0.7 | 1.8 |
| July | 1.2 | 0.9 | 1.7 |
| August | 1.4 | 1.0 | 1.7 |
| September | 1.6 | 1.2 | 1.8 |
| October | 1.4 | 1.0 | 1.5 |
| November | 2.1 | 1.8 | 2.3 |
| December | 1.9 | 1.6 | 2.0 |
| 2018 | |||
| January | 1.7 | 1.4 | 1.8 |
| February | 2.2 | 1.8 | 2.3 |
| March | 2.3 | 1.9 | 2.3 |
| April | 2.2 | 1.9 | 2.1 |
| May | 2.2 | 2.0 | 2.2 |
| June | 2.5 | 2.1 | 2.3 |
| July | 3.0 | 2.7 | 2.8 |
| August | 2.8 | 2.6 | 2.7 |
| September | 2.2 | 2.0 | 2.1 |
| October | 2.4 | 2.2 | 2.3 |
| November | 1.7 | 1.5 | 1.5 |
| December | 2.0 | 1.8 | 1.9 |
| 2019 | |||
| January | 1.4 | 1.4 | 1.1 |
| February | 1.5 | 1.5 | 1.2 |
| March | 1.9 | 1.9 | 1.6 |
| April | 2.0 | 1.9 | 1.7 |
| May | 2.4 | 2.3 | 2.1 |
| June | 2.0 | 2.0 | 1.7 |
| July | 2.0 | 2.0 | 1.7 |
| August | 1.9 | 2.0 | 1.6 |
| September | 1.9 | 2.0 | 1.7 |
| October | 1.9 | 2.1 | 1.7 |
| November | 2.2 | 2.3 | 2.1 |
| December | 2.2 | 2.4 | 2.1 |
| 2020 | |||
| January | 2.4 | 2.4 | 2.4 |
| February | 2.2 | 2.3 | 2.4 |
| March | 0.9 | 0.9 | 0.9 |
|
Note: Last observation: March 2020. Source: Statistics Canada, Consumer Prices program. |
|||
Hence, the acquisitions approach may be helpful in reducing the perception-measurement gap. This may better reflect how consumers perceive their cost of living owing to the cost of houses. It is relatively easy to implement in the CPI compilation as it essentially relies on housing transaction prices. However, OA expenditure shares and housing transaction prices may vary considerably over time and by geographic locations. In addition, the inflation rate based on this approach would be more volatile over time, not a positive feature for monetary policy. It should be noted that this approach is not consistent with the concept of cost of housing services. Rental equivalence and user cost approaches are more aligned with the concept of cost of housing services, but the all-items CPI generated with user cost approach is far more volatile than the official index, reflecting the inconsistent impact of expected capital gain price changes on the OA estimates. The treatment of OA in the Canadian CPINote represents an acceptable compromise in the current environment of relatively low and stable inflation.
5. Psychological and behavioural factors
Overall, the measurement issues reviewed so far seem to explain a small fraction of the perception-measurement gap. Other behavioral factors might also be at play and we explore them next.
Consumers’ views of some price components (e.g., food, rent)
Inflation perceptions might be determined by consumers’ own view of a small set of products and services. In particular, analysis using the CSCE suggests that views about inflation tend to be driven by changes in food prices, the cost of renting and house prices. Perceptions about food and rent inflation are likely based on an individual’s own experience, and on average are much higher than the actual CPI inflation rates for these components (Chart 9 and Chart 10). This factor contributes to explain part of the positive bias in perceived inflation rates. About 0.7 percentage points of the 1.0 percentage points gap could be explained by higher perceived inflation for food and rent (average perceived inflation rates are 5.5% and 5.3% while average CPI inflation rates are 1.9% and 1.2% for food and rent, respectively, since 2014).
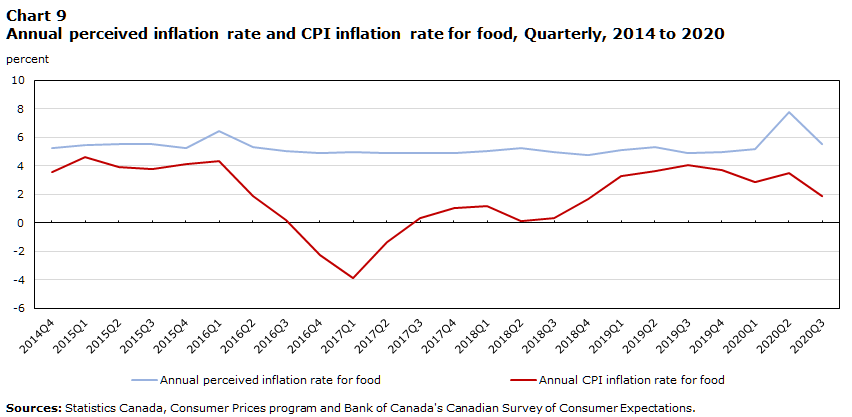
Data table for Chart 9
| Date | Annual perceived inflation rate for food | Annual CPI inflation rate for food |
|---|---|---|
| percent | ||
| 2014 | ||
| Q4 | 5.22 | 3.54 |
| 2015 | ||
| Q1 | 5.43 | 4.61 |
| Q2 | 5.51 | 3.90 |
| Q3 | 5.55 | 3.80 |
| Q4 | 5.24 | 4.12 |
| 2016 | ||
| Q1 | 6.46 | 4.33 |
| Q2 | 5.32 | 1.84 |
| Q3 | 5.03 | 0.21 |
| Q4 | 4.91 | -2.27 |
| 2017 | ||
| Q1 | 4.96 | -3.88 |
| Q2 | 4.88 | -1.37 |
| Q3 | 4.91 | 0.33 |
| Q4 | 4.92 | 1.01 |
| 2018 | ||
| Q1 | 5.06 | 1.16 |
| Q2 | 5.21 | 0.09 |
| Q3 | 4.94 | 0.33 |
| Q4 | 4.79 | 1.66 |
| 2019 | ||
| Q1 | 5.13 | 3.28 |
| Q2 | 5.31 | 3.64 |
| Q3 | 4.86 | 4.07 |
| Q4 | 4.97 | 3.71 |
| 2020 | ||
| Q1 | 5.15 | 2.84 |
| Q2 | 7.76 | 3.51 |
| Q3 | 5.53 | 1.88 |
| Sources: Statistics Canada, Consumer Prices program and Bank of Canada's Canadian Survey of Consumer Expectations. | ||

Data table for Chart 10
| Date | Annual perceived inflation rate for rented accommodation | Annual CPI inflation rate for rented accommodation |
|---|---|---|
| percent | ||
| 2014 | ||
| Q4 | 5.25 | 1.38 |
| 2015 | ||
| Q1 | 4.95 | 1.35 |
| Q2 | 4.94 | 1.28 |
| Q3 | 4.99 | 1.14 |
| Q4 | 4.90 | 0.93 |
| 2016 | ||
| Q1 | 4.84 | 0.82 |
| Q2 | 5.20 | 0.65 |
| Q3 | 5.23 | 0.59 |
| Q4 | 5.20 | 0.59 |
| 2017 | ||
| Q1 | 5.06 | 0.59 |
| Q2 | 5.59 | 0.62 |
| Q3 | 5.40 | 0.64 |
| Q4 | 5.24 | 0.70 |
| 2018 | ||
| Q1 | 5.35 | 0.89 |
| Q2 | 5.47 | 1.08 |
| Q3 | 5.35 | 1.25 |
| Q4 | 4.98 | 1.33 |
| 2019 | ||
| Q1 | 5.42 | 2.46 |
| Q2 | 5.53 | 2.23 |
| Q3 | 5.09 | 2.82 |
| Q4 | 5.34 | 3.42 |
| 2020 | ||
| Q1 | 5.41 | 2.53 |
| Q2 | 4.69 | 1.80 |
| Q3 | 5.14 | 1.36 |
| Sources: Statistics Canada, Consumer Prices program and Bank of Canada's Canadian Survey of Consumer Expectations. | ||
Frequent purchases
Recent shopping experience and frequent purchases may also affect households’ inflation perceptions. Using US transaction data, D’Acunto, Malmendier, Ospina and Weber (2019) find that household-specific grocery-price changes shape consumers' inflation expectations, with stronger impact from price changes of the frequently purchased goods.Note For Canada, Statistics Canada computed the CPI inflation for frequent purchases at the aggregate level.Note Over the past five years, the inflation rates of frequent purchases have been weaker than the inflation rates of the all-items CPI and so likely does not explain the gap with perceived inflation at the aggregate level (the perception gap is in fact amplified by about 0.2 percentage points on average by comparing perceived inflation with inflation from frequent purchased items).
Large price increases
Large price changes, especially large increases, may have a stronger impact on households’ views about inflation. This is because rising prices are more salient for consumers than declining and stable prices. To test this, an alternative CPI inflation is measured by trimming 20% of price declines and 10% of price increases by CPI basket weight. Households’ inflation views are very close to this alternative measure of inflation (Chart 11). This suggests that consumers weigh price increases more heavily and that excluding a larger proportion of extreme price declines than price increases could explain a significant part of the gap between inflation and these views (gap is narrowed from 0.8 percentage points to only 0.1 percentage points when perceived inflation is compared to this trimmed index instead of CPI-all item).
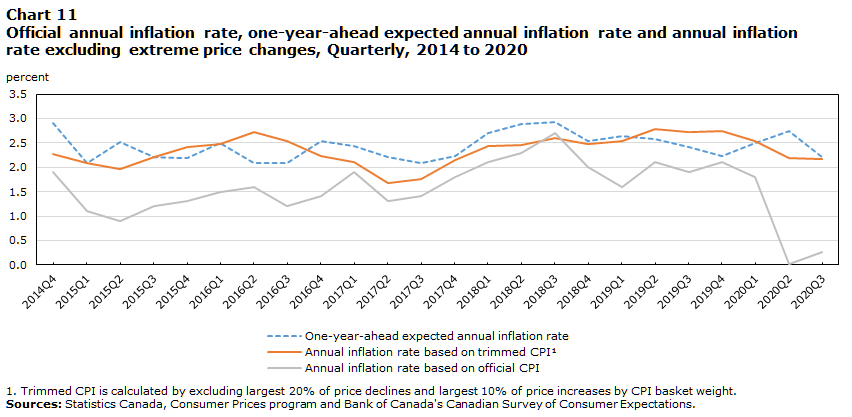
Data table for Chart 11
| Date | One-year-ahead expected annual inflation rate | Annual inflation rate based on trimmed CPIChart 11 Note 1 | Annual inflation rate based on official CPI |
|---|---|---|---|
| percent | |||
| 2014 | |||
| Q4 | 2.91 | 2.26209 | 1.9 |
| 2015 | |||
| Q1 | 2.08 | 2.07703 | 1.1 |
| Q2 | 2.51 | 1.95572 | 0.9 |
| Q3 | 2.20 | 2.19976 | 1.2 |
| Q4 | 2.18 | 2.40883 | 1.3 |
| 2016 | |||
| Q1 | 2.49 | 2.48157 | 1.5 |
| Q2 | 2.09 | 2.72115 | 1.6 |
| Q3 | 2.08 | 2.54229 | 1.2 |
| Q4 | 2.54 | 2.23097 | 1.4 |
| 2017 | |||
| Q1 | 2.44 | 2.09765 | 1.9 |
| Q2 | 2.20 | 1.68159 | 1.3 |
| Q3 | 2.08 | 1.76454 | 1.4 |
| Q4 | 2.23 | 2.14158 | 1.8 |
| 2018 | |||
| Q1 | 2.71 | 2.43325 | 2.1 |
| Q2 | 2.89 | 2.45530 | 2.3 |
| Q3 | 2.93 | 2.59998 | 2.7 |
| Q4 | 2.54 | 2.47698 | 2.0 |
| 2019 | |||
| Q1 | 2.64 | 2.53668 | 1.6 |
| Q2 | 2.57 | 2.78055 | 2.1 |
| Q3 | 2.42 | 2.72227 | 1.9 |
| Q4 | 2.23 | 2.73793 | 2.1 |
| 2020 | |||
| Q1 | 2.49 | 2.53867 | 1.8 |
| Q2 | 2.75 | 2.18160 | 0.0 |
| Q3 | 2.22 | 2.16706 | 0.3 |
|
|||
The role of knowledge and information
One explanation for the behaviour of firm and household inflation views could be related to information problems. When information is not readily available or too costly to acquire, individuals rely on their personal experiences to form perceptions and expectations. This lack of information about economic developments and policy changes might explain part of the perception-measurement gap.
Central banks and other authorities have a role to play in providing information. The Bank of Canada’s analysis shows that individuals update their views of inflation with new information, with notable impacts from information about the Bank’s inflation target and inflation forecasts by the Bank and professional forecasters.Note Information about the inflation target and past inflation has the most lasting impact on expectations.
Knowledge is also important, as individuals with higher financial and economic literacy having inflation expectations closer to measured inflation. In this context, developing communication strategies to reach a broader audience and increase financial and economic literacy is worth exploring.
6. Conclusion
Canadians’ views of inflation are above actual CPI inflation, and more so for certain demographic groups. While measurement factors can explain part of this gap, behavioral factors appear to be playing a larger role. Information gaps or limited economic literacy can partly explain the way inflation is perceived. Central banks and other authorities can play a role to make information more readily available and to support economic literacy. Statistics Canada and the Bank of Canada will continue their analysis of the CSCE data and develop communication strategies to help Canadians in their efforts to better understand consumer inflation and its measurement methods.
References
Bellemare, C., Tossou, R. K. and Moran, K. (2020). “The Determinants of Consumers’ Inflation Expectations: Evidence from the US and Canada.” Staff Working Paper/Document de travail du personnel — 2020-52, Bank of Canada.
Coibion, Olivier, Yuriy Gorodnichenko, and Saten Kumar. (2018). “How Do Firms Form Their Expectations? New Survey Evidence.” American Economic Review, 108 (9): 2671-2713.
Coibion, Olivier, Yuriy Gorodnichenko and Ropele, Tiziano. (2020). “Inflation Expectations and Firm Decisions: New Causal Evidence.” The Quarterly Journal of Economics, 135, issue 1, p. 165-219.
Coibion, Olivier, Yuriy Gorodnichenko and Michael Weber. (2019). “Monetary Policy Communications and their Effects on Household Inflation Expectations.” NBER Working Paper 25482.
D'Acunto, Francesco, Ulrike M. Malmendier, Juan Ospina and Michael Weber. (2019). “Exposure to Daily Price Changes and Inflation Expectations.” CESifo Working Paper Series 7798, CESifo.
Dion, Richard and Patrick Sabourin. (2011). “Measures of Owner-Occupied Housing in the CPI: Properties and Limitations in the Canadian Context.” Bank of Canada, unpublished document.
- Date modified: