Statistics Canada
www.statcan.gc.ca
Common menu bar links

May 2007

Archived Content
Information identified as archived is provided for reference, research or recordkeeping purposes. It is not subject to the Government of Canada Web Standards and has not been altered or updated since it was archived. Please "contact us" to request a format other than those available.
Analysis
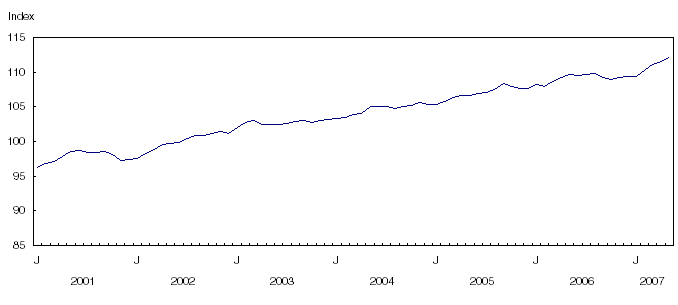
Consumer prices increased by 2.2% in May 2007 compared with May 2006, a rate of growth identical to that posted the previous month.
The upward pressure came largely from increases in the costs associated with owned accommodation, as well as higher gasoline prices. These were partially offset by a decline in the price of natural gas.
The all-items index without energy components increased by 2.1% in May 2007 compared with the same month of the previous year. This was a net slowdown in relation to the 2.3% rise posted in April. This index rose more than 2.0% for the past four months.
In May 2007, the Bank of Canada’s core index exhibited the same trend as the all-items index excluding energy, rising by 2.2% over the same month of the previous year, a marked decline from the 2.5% increase of the previous month. This index is used by the Bank of Canada to monitor the inflation control target. Since July 2006, the growth of this index has remained above 2.0%.
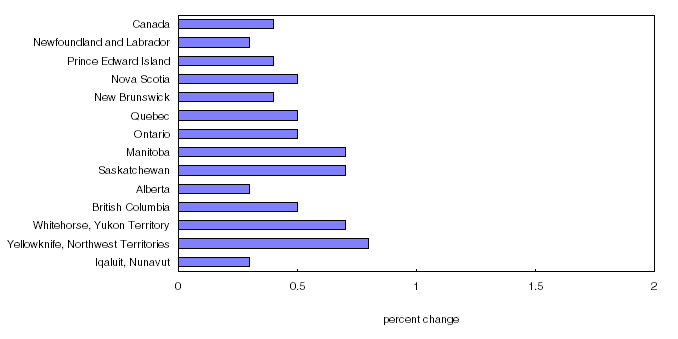
On a monthly basis, the all-items index rose by 0.4% between April and May 2007, a smaller increase than the 0.5% posted the previous month. Higher gasoline prices accounted for most of the upswing in this index in May.
The all-items index without energy components rose by 0.3% in May 2007 after posting an increase of 0.2% the previous month.
The core index was up by 0.3% between April and May 2007 after increasing by 0.1% the previous month.
12-month change: Gasoline prices, owned accommodation costs account for gain
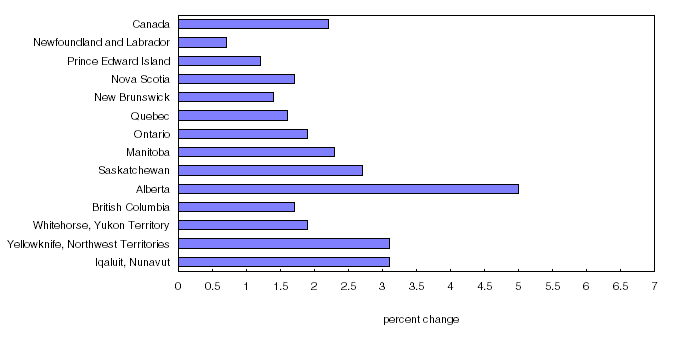
Average prices for all of the goods and services included in the Consumer Price Index rose by 2.2% in May 2007 compared with May 2006. The previous month’s increase was also 2.2%. This month, the sustained rise in costs associated with owned accommodation combined with the increase in gasoline prices explained most of the increase in the national all-items index.
Higher vehicle insurance premiums and prices for restaurant meals also exerted upward pressure to a lesser extent. However, the decrease in prices for computer equipment and video equipment, natural gas and vehicle purchases and leases mitigated the rise in the all-items CPI.
The costs associated with owned accommodation were the main source of upward pressure on consumer prices. Mortgage interest cost rose by 5.7% in May 2007 compared with the same month last year. Mortgage interest cost, which measures the changes brought about by prices in the amount owed by homeowners, has posted a 12-month change higher than 5.0% since early 2007.
Homeowners’ replacement cost, which represents the worn-out structural portion of housing and is estimated using new housing prices (excluding land), increased by 6.0% in May 2007 compared with May 2006. The contribution of replacement cost to the rise in the all-items index remained substantial this month despite the signs of tapering off posted by this index since November 2006.
Homeowners were nonetheless able to take advantage of an 8.8% drop in natural gas prices in May 2007 compared with May 2006.
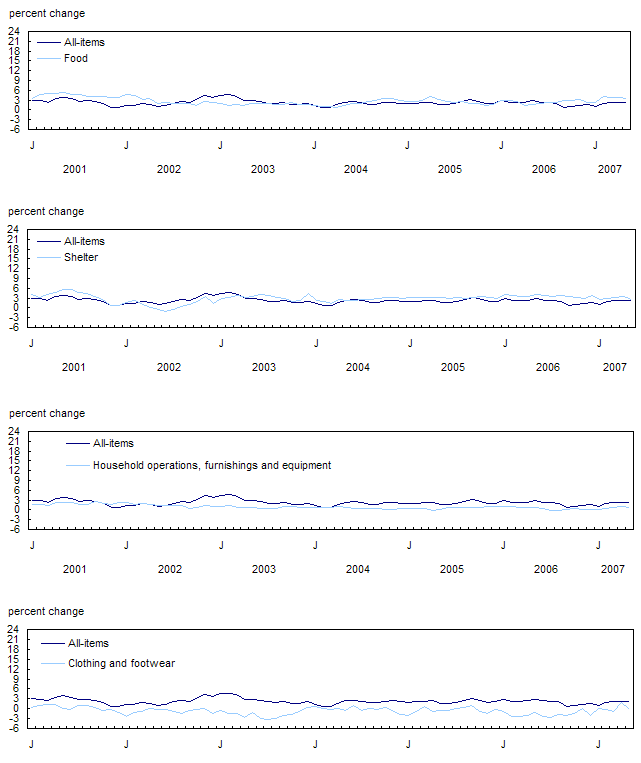
Consumers spent an average of 3.5% more to eat in May 2007 than in May 2006. They paid 2.3% more for restaurant meals and 4.0% more at the grocery store for food.
Motorists paid more to operate their vehicles, another factor behind the rise in the all-items CPI. They paid 5.8% more to fill up their vehicles in May 2007 compared with May 2006. Vehicle insurance premiums also increased by 3.7% during the same period.
Consumers nonetheless paid less to purchase new vehicles. The 0.3% downturn in the price of vehicle purchases and leases partially offset the upward movement in consumer prices. Consumers were able to purchase vehicles that were often better equipped for prices below those of last year.
Prices for computer equipment and supplies (-20.0%) and video equipment (-8.5%) continued the downward trends observed in recent months.
Albertans exposed to higher price increases than residents of other provinces
Although prices paid by consumers were on the rise in all provinces, only residents of Alberta (+5.0%), Saskatchewan (+2.7%) and Manitoba (+2.3%) posted increases that were higher than the national average. In these three provinces, the strong year-over-year increase in homeowners’ replacement cost exerted most of the upward pressure on consumer prices.
All other provinces nonetheless posted increases of less than 2.0% between May 2006 and May 2007. Consumers in Newfoundland and Labrador (+0.7%) and Prince Edward Island (+1.2%) experienced the most modest increases. Residents of Ontario (+1.9%), Quebec (+1.6%) and British Columbia (+1.7%) saw price increases lower than the national average.
Wide-range provincial costs associated with owned accommodation explained much of the portion of the differences in the growth in consumer prices across provinces. In May 2007, homeowners’ replacement cost in Alberta shot up by 26.3% in relation to the same month last year, with increases of 20.9% for residents of Saskatchewan and of 7.2% those who live in Manitoba.
Month-over-month: Gasoline prices increase for a fourth consecutive month
Between April and May 2007, prices for all goods and services rose by 0.4% on average, compared to the 0.5% increase posted the previous month. Gasoline prices accounted for much of the growth in the monthly index.
On average, gasoline prices rose by 5.5% in May, their fourth consecutive monthly increase. Prices paid at the pump rose in all provinces, with the gains ranging from 2.0% in Prince Edward Island to 10.0% in Saskatchewan.
Between January and May 2007, gasoline prices have risen by 26.3% on average across the country. Price increases were biggest in Alberta (+30.9%) and Ontario (+28.7%).
The 9.1% increase in prices for traveller accommodation between April and May 2007 also helped push up the monthly all-items CPI. This price jump stayed within historical averages usually posted in the month of May.
Prices for overnight stays were up across the country, with many hotel operators starting to apply their summer rates. This seasonal trend is normal since each year this component of the CPI displays increases in May.
Conversely, average prices for natural gas were down by 5.2% between April and May 2007, thus dampening the rise in the national all-items CPI. The price decreases granted to Alberta residents contributed to much of the decline in the national index for natural gas this month.
The drop in clothing prices also moderated the rise in the monthly all-items index. Women’s clothing prices decreased by 3.5% between April and May 2007, while men’s clothing prices were down by 1.4% during the same period.
The new collections introduced at boutiques and department stores in the previous months are now available to consumers at reduced prices. This situation is typical for this period of the year, when stores generally hold spring promotions to stimulate sales and reduce their inventories in order to make room for the next season’s collections.
The 3.5% decline in fresh vegetable prices also dampened the rise in the CPI between April and May.
The seasonally adjusted CPI increases between April and May
Pushed up by five of the eight main components, the seasonally adjusted all-items index rose by 0.3% between April and May 2007. Price increases in transportation (+1.8%) accounted for most of the seasonally adjusted monthly increase in consumer prices. To a lesser extent, the growth in indexes for health and personal care (+0.6%), food (+0.1%), and recreation, education and reading (+0.1%) contributed to most of the rise in the seasonally adjusted all-items index in May. The decline in prices for clothing and footwear (-1.4%), shelter (-0.2%), and household operations and furnishings (-0.1%) attenuated the upward pressure exerted by the other components.
The seasonally adjusted core index as established by the Bank of Canada was up by 0.1% between April and May 2007.
12-month variation: The Core Index slows
The core index is obtained by removing the effect of the changes in indirect taxes from the all-items CPI from which the eight most volatile components identified by the Bank of Canada have been excluded. These volatile components are fruit, fruit preparations and nuts; vegetables and vegetable preparations; mortgage interest cost; natural gas; heating oil and other fuels; gasoline; inter-city transportation; and tobacco products and smokers’ supplies.
The 12-month increase in the core index as identified by the Bank of Canada was 2.2% in May 2007, down from the 2.5% rise observed the previous month.
On a monthly basis, this index increased by 0.3% in May 2007, faster than the 0.1% rise recorded during the previous month.
Energy: Gasoline prices up, natural gas prices down
The energy products index increased by 1.6 % in May 2007 over the same month of the previous year. The previous month, this index rose by only 0.1%. In May, it was the 5.8% increase in gasoline prices that was the primary factor behind this increase. Higher prices for fuel, parts and supplies for recreational vehicles (+5.8%) also slightly contributed to push up this index. The pronounced decline in average prices for natural gas (-8.8%) nonetheless mitigated the rise in the national energy index. To a lesser extent, the decrease in prices for electricity (-0.8%) and for fuel oil and other fuels (-2.9%) also slowed down the growth in this index.
On a monthly basis, the energy index increased by 2.1% between April and May 2007, down from the 2.4% rise posted the previous month. Most of the rise in the monthly energy index was due to the 5.5% increase in gasoline prices. To a lesser extent, higher prices for fuel, parts and supplies for recreational vehicles (+3.1%) also caused this index to rise. The downward pressure came largely from the drop in prices for natural gas (-5.2%), the decreases in prices for fuel oil and other fuels (-1.2%) and electricity (-0.3%) having had relatively less influence.
Year-over-year: The prices of goods up slower than those of services
The goods index climbed by 1.1% in May 2007 compared with the same month of the previous year, slightly more than the 1.0% rise recorded the previous month. Non-durable goods posted increases this month, while durable goods and semi-durable goods showed decreases.
The 2.4% increase in prices for non-durable goods prices pushed up the goods index in May 2007 compared with May 2006. Gasoline (+5.8%) and fresh vegetables (+9.0%) accounted for most of the upward pressure on the non-durable goods index.
The decrease in average prices for durable goods (-1.1%) nonetheless attenuated the rise in the goods index. Price reductions for computer equipment and supplies (-20.0%), video equipment (-8.5%) and new vehicle purchases (-0.3%) represented the main factor behind this decrease.
To a lesser degree, the decrease in prices for semi-durable goods (-0.5%) also slowed down the rise in the goods index.
On a monthly basis, the goods index rose by 0.4% in May 2007, the same variation as in April. The monthly indexes for non-durable goods (+0.8%) and durable goods (+0.3%) increased between April and May, while that for semi-durable goods (-1.3%) was down owing to the drop in clothing prices.
In May 2007, the services index was up by 3.2% over the same month the previous year. This rise in the services index is largely attributable to increases in mortgage interest cost (+5.7%) and homeowners’ replacement cost (+6.0%).
The monthly services index increased by 0.5% in May 2007 after rising 0.4% for three straight months.
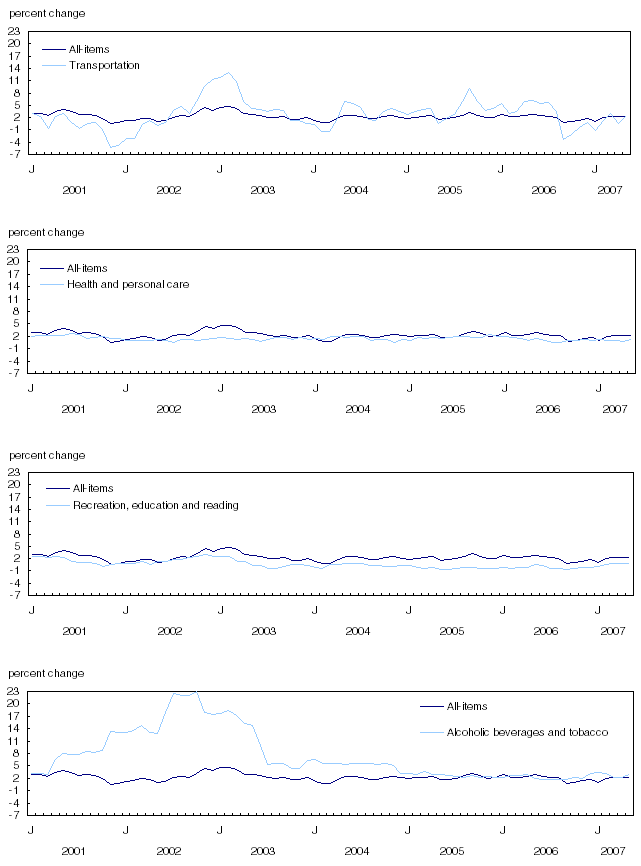
National charts

Charts by province, Whitehorse, Yellowknife and Iqaluit