
Corporations Returns Act
2019

Archived Content
Information identified as archived is provided for reference, research or recordkeeping purposes. It is not subject to the Government of Canada Web Standards and has not been altered or updated since it was archived. Please "contact us" to request a format other than those available.
Skip to text
Text begins
Introduction
Under the authority of the Minister of Innovation, Science and Industry, Statistics Canada administers the Corporations Returns Act which requires the collection of financial and ownership information on corporations conducting business in Canada. This information is used to evaluate the extent of foreign control of the Canadian corporate economy.
The Corporations Returns Act requires that an annual report be submitted to Parliament summarizing the extent to which foreign control is prevalent in Canada. This is the report for reference year 2019.
This report focuses mainly on ownership of assets as a basis for measuring foreign control because assets provide a longer term perspective. They are a stock item, reflecting economic decisions and market conditions that evolve more slowly over time. Statistics Canada also tracks revenues and profits under foreign control for the same time periods.
These statistics are compiled from enterprise level data. An enterprise can be a single corporation or a family of corporations under common ownership and/or control, for which consolidated financial statements are produced.
The report covers all incorporated enterprises in Canada, including federal and provincial government business enterprises (GBEs) but excluding enterprises classified under the North American Industry Classification System (NAICS) to Management of Companies and Enterprises (NAICS 55), Religious Organizations (NAICS 8131), Political Organizations (NAICS 81394), Public Administration (NAICS 91) and Funds and other Financial Vehicles (NAICS 526).
The all industry analysis is based on 21 groups of industries which have been defined using NAICS.
Data was compiled by geographic macro-region using the Standard Classification of Countries and Areas of Interest (SCCAI 2016) structure.
Highlights
- The foreign-controlled share of Canadian assets decreased from 15.3% to 14.8% in 2019.
- In 2019, only ten countries accounted for just over 90% of all foreign-owned assets in Canada.
- The share of assets of foreign controlled enterprises in the non financial sector was at a twelve year low of 22.6% in 2019.
- In the finance and insurance industries in 2019, the foreign-controlled share of Canadian assets has remained virtually unchanged from the previous year.
Analysis
All Industries
In 2019, enterprises operating in Canada held $15.1 trillion in assets, a value 6.8% higher than the prior year.
Foreign-controlled total asset values increased by 4.0% in 2019, while the value of Canadian-controlled assets increased by 7.4%. Consequently, the foreign-controlled asset share decreased, from 15.3% to 14.8% in 2019.

Data table for Chart 1
| 2008 | 2009 | 2010 | 2011 | 2012 | 2013 | 2014 | 2015 | 2016 | 2017 | 2018 | 2019 | |
|---|---|---|---|---|---|---|---|---|---|---|---|---|
| percent | ||||||||||||
| Assets | 20.6 | 19.7 | 19.2 | 18.9 | 18.5 | 18.3 | 18.0 | 16.9 | 16.3 | 15.7 | 15.3 | 14.8 |
| Operating revenues | 30.1 | 28.8 | 29.1 | 29.0 | 30.0 | 29.1 | 28.7 | 27.8 | 27.6 | 27.8 | 27.4 | 27.0 |
| Operating profits | 24.9 | 20.2 | 22.3 | 22.9 | 20.7 | 20.1 | 20.0 | 16.9 | 16.8 | 17.4 | 17.8 | 17.1 |
| Source: Table 33-10-0033-01. | ||||||||||||
Returns collected under the Corporations Returns Act show that enterprises in Canada are controlled by entities from over 80 countries. However, only ten countries account for 90.2% of these foreign-owned assets. American-controlled enterprises held the highest share in 2019, accounting for 51.9% of all assets under foreign control.

Data table for Chart 2
| Percent | |
|---|---|
| United States of America | 51.9 |
| United Kingdom | 11.0 |
| Japan | 6.0 |
| Germany | 4.4 |
| Switzerland | 3.8 |
| France | 3.9 |
| China | 3.7 |
| Netherlands | 2.6 |
| Rest of the world | 12.6 |
| Source: Table 33-10-0033-01. | |
Over the previous decade, the share of assets owned by foreign-controlled enterprises has steadily declined. This trend has continued in 2019 with the foreign-controlled share decreasing by 0.4 percentage points from 2018.
In 2019, more than half of all assets under foreign control belonged to enterprises from the Americas macro region, followed by Europe at 31.4% and Asia at 13.3%. While the relative ranking in asset share remains consistent, the direction of movement has shifted. The share of assets owned by enterprises in the Americas region grew slightly in 2019, whereas the shares of European and Asian controlled enterprises marked a small decline from 2018 levels.

Data table for Chart 3
| Percent | |
|---|---|
| Americas | 53.7 |
| Europe | 31.4 |
| Asia | 13.3 |
| Africa,Oceania, Antarctica and adjacent islands | 1.6 |
| Source: Table 33-10-0033-01. | |
| Assets | ||||||
|---|---|---|---|---|---|---|
| 2017 | 2018 | 2019 | 2017 | 2018 | 2019 | |
| millions of dollars | percent | |||||
| Total Americas (excluding Canada) | 1,075,033 | 1,121,248 | 1,200,540 | 52.32 | 52.14 | 53.70 |
| United States of America | 1,035,346 | 1,082,221 | 1,160,842 | 50.39 | 50.33 | 51.92 |
| Mexico | 4,587 | 4,696 | 4,286 | 0.22 | 0.22 | 0.19 |
| Brazil | 29,750 | 28,995 | 28,482 | 1.45 | 1.35 | 1.27 |
| Other Americas | 5,349 | 5,336 | 6,931 | 0.26 | 0.25 | 0.31 |
| Total Asia | 297,096 | 312,802 | 296,840 | 14.46 | 14.55 | 13.28 |
| China | 70,962 | 78,725 | 83,598 | 3.45 | 3.66 | 3.74 |
| India | 17,446 | 19,354 | 19,454 | 0.85 | 0.90 | 0.87 |
| Japan | 119,195 | 122,281 | 134,409 | 5.80 | 5.69 | 6.01 |
| South Korea | 11,197 | 12,512 | 12,808 | 0.54 | 0.58 | 0.57 |
| Other Asia | 78,296 | 79,929 | 46,572 | 3.81 | 3.72 | 2.08 |
| Total Europe | 650,652 | 690,303 | 703,101 | 31.67 | 32.10 | 31.45 |
| France | 75,432 | 83,271 | 86,872 | 3.67 | 3.87 | 3.89 |
| Germany | 87,112 | 94,849 | 97,928 | 4.24 | 4.41 | 4.38 |
| United Kingdom | 231,525 | 240,104 | 245,998 | 11.27 | 11.17 | 11.00 |
| Italy | 17,945 | 17,085 | 17,126 | 0.87 | 0.79 | 0.77 |
| Netherlands | 50,318 | 54,238 | 58,890 | 2.45 | 2.52 | 2.63 |
| Switzerland | 80,596 | 81,478 | 85,231 | 3.92 | 3.79 | 3.81 |
| Other Europe | 107,724 | 119,278 | 111,056 | 5.24 | 5.55 | 4.97 |
| Total Oceania, Antarctica and adjacent islands | 28,528 | 25,345 | 34,917 | 1.39 | 1.18 | 1.56 |
| Australia | 27,646 | 24,518 | 34,380 | 1.35 | 1.14 | 1.54 |
| Other Oceania, Antarctica and adjacent islands | 882 | 827 | 537 | 0.04 | 0.04 | 0.02 |
| Total Africa | 3,433 | 610 | 437 | 0.17 | 0.03 | 0.02 |
| Total foreign control | 2,054,740 | 2,150,309 | 2,235,836 | 100.00 | 100.00 | 100.00 |
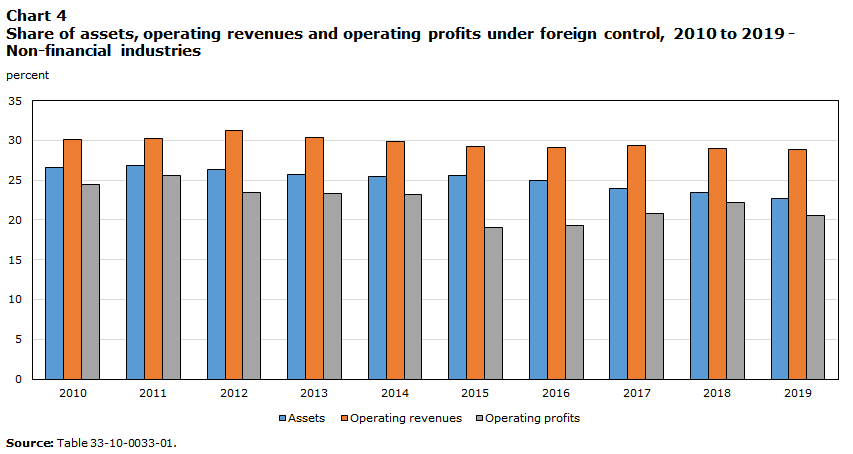
Non-financial Industries
In 2019, enterprises in non-financial industries held $6.6 trillion in assets, representing 43.5% of total assets in Canada.
Assets held by Canadian-controlled enterprises rose 8.3% in 2019, while those held by foreign-controlled enterprises increased 3.0%. As a result, the share of assets under foreign control declined from 23.5% the previous year to 22.6% in 2019.
Data table for Chart 4
| 2008 | 2009 | 2010 | 2011 | 2012 | 2013 | 2014 | 2015 | 2016 | 2017 | 2018 | 2019 | |
|---|---|---|---|---|---|---|---|---|---|---|---|---|
| percent | ||||||||||||
| Assets | 27.3 | 26.5 | 26.6 | 26.8 | 26.4 | 25.7 | 25.5 | 25.6 | 25.0 | 24.0 | 23.5 | 22.6 |
| Operating revenues | 31.0 | 29.7 | 30.1 | 30.2 | 31.3 | 30.3 | 29.9 | 29.2 | 29.1 | 29.3 | 29.0 | 28.8 |
| Operating profits | 26.5 | 20.2 | 24.5 | 25.6 | 23.5 | 23.3 | 23.2 | 19.0 | 19.3 | 20.8 | 22.2 | 20.6 |
| Source: Table 33-10-0033-01. | ||||||||||||
Wholesale trade, manufacturing, mining and quarrying, and oil and gas extraction were the non-financial industries with the largest share of foreign control as measured by assets. The share of assets under foreign control were 49.9% for wholesale trade, 45.4% for manufacturing, 40.2% for mining and 32.3% for oil and gas in 2019.
The share of assets of foreign-controlled enterprises in the non-financial sector is currently at a twelve year low of 22.6% in 2019. Enterprises controlled in the Americas macro region held 58.5% of foreign assets in 2019, an increase of 3.1 percentage points from the year before. Conversely, the share of assets held by enterprises controlled in Europe decreased to 27.1% in 2019 from 28.3% in 2018. The asset share of enterprises controlled in Asia was also down from the previous year, dropping 2.2 percentage points to 12.7%.
The countries whose enterprises controlled the most assets in Canada were the United States with 56.0%, the United Kingdom with 5.9% and China with 4.6% of foreign-controlled assets. Non-financial industry assets of enterprises controlled in China surpassed non-financial assets of enterprises controlled in Japan for the first time in 2016 and maintained their position since.

Data table for Chart 5
| Percent | |
|---|---|
| United States of America | 56.0 |
| United Kingdom | 5.9 |
| China | 4.6 |
| Japan | 4.2 |
| France | 4.1 |
| Germany | 3.5 |
| Switzerland | 3.4 |
| Netherlands | 2.9 |
| Rest of the world | 15.4 |
| Source: Table 33-10-0033-01. | |
| Assets | ||||||
|---|---|---|---|---|---|---|
| 2017 | 2018 | 2019 | 2017 | 2018 | 2019 | |
| millions of dollars | percent | |||||
| Total Americas (excluding Canada) | 759,153 | 798,712 | 868,043 | 55.4 | 55.4 | 58.5 |
| United States of America | 723,699 | 763,262 | 831,625 | 52.8 | 53.0 | 56.0 |
| Mexico | x | Note x: suppressed to meet the confidentiality requirements of the Statistics Act | Note x: suppressed to meet the confidentiality requirements of the Statistics Act | Note x: suppressed to meet the confidentiality requirements of the Statistics Act | Note x: suppressed to meet the confidentiality requirements of the Statistics Act | Note x: suppressed to meet the confidentiality requirements of the Statistics Act |
| Brazil | x | Note x: suppressed to meet the confidentiality requirements of the Statistics Act | Note x: suppressed to meet the confidentiality requirements of the Statistics Act | Note x: suppressed to meet the confidentiality requirements of the Statistics Act | Note x: suppressed to meet the confidentiality requirements of the Statistics Act | Note x: suppressed to meet the confidentiality requirements of the Statistics Act |
| Other Americas | 2,690 | 2,569 | 3,836 | 0.2 | 0.2 | 0.3 |
| Total Asia | 207,697 | 214,619 | 187,844 | 15.2 | 14.9 | 12.7 |
| China | 62,686 | 66,075 | 68,569 | 4.6 | 4.6 | 4.6 |
| India | 8,851 | 10,350 | 10,520 | 0.6 | 0.7 | 0.7 |
| Japan | 57,352 | 59,671 | 61,819 | 4.2 | 4.1 | 4.2 |
| South Korea | 7,499 | 8,192 | 8,571 | 0.5 | 0.6 | 0.6 |
| Other Asia | 71,309 | 70,331 | 38,365 | 5.2 | 4.9 | 2.6 |
| Total Europe | 383,980 | 408,320 | 402,969 | 28.0 | 28.3 | 27.1 |
| France | 50,159 | 55,906 | 60,390 | 3.7 | 3.9 | 4.1 |
| Germany | 46,931 | 50,895 | 52,527 | 3.4 | 3.5 | 3.5 |
| United Kingdom | 88,954 | 88,911 | 87,265 | 6.5 | 6.2 | 5.9 |
| Italy | 13,889 | 12,894 | 13,329 | 1.0 | 0.9 | 0.9 |
| Netherlands | 36,780 | 39,930 | 42,587 | 2.7 | 2.8 | 2.9 |
| Switzerland | 47,918 | 49,109 | 50,720 | 3.5 | 3.4 | 3.4 |
| Other Europe | 99,348 | 110,676 | 96,151 | 7.2 | 7.7 | 6.5 |
| Total Oceania, Antarctica and adjacent islands | x | Note x: suppressed to meet the confidentiality requirements of the Statistics Act | Note x: suppressed to meet the confidentiality requirements of the Statistics Act | Note x: suppressed to meet the confidentiality requirements of the Statistics Act | Note x: suppressed to meet the confidentiality requirements of the Statistics Act | Note x: suppressed to meet the confidentiality requirements of the Statistics Act |
| Australia | 15,606 | 18,127 | 25,134 | 1.1 | 1.3 | 1.7 |
| Other Oceania, Antarctica and adjacent islands | Note x: suppressed to meet the confidentiality requirements of the Statistics Act | Note x: suppressed to meet the confidentiality requirements of the Statistics Act | Note x: suppressed to meet the confidentiality requirements of the Statistics Act | Note x: suppressed to meet the confidentiality requirements of the Statistics Act | Note x: suppressed to meet the confidentiality requirements of the Statistics Act | Note x: suppressed to meet the confidentiality requirements of the Statistics Act |
| Total Africa | Note x: suppressed to meet the confidentiality requirements of the Statistics Act | Note x: suppressed to meet the confidentiality requirements of the Statistics Act | Note x: suppressed to meet the confidentiality requirements of the Statistics Act | Note x: suppressed to meet the confidentiality requirements of the Statistics Act | Note x: suppressed to meet the confidentiality requirements of the Statistics Act | Note x: suppressed to meet the confidentiality requirements of the Statistics Act |
| Total foreign control | 1,370,641 | 1,441,105 | 1,484,853 | 66.7 | 67.0 | 66.4 |
| x suppressed to meet the confidentiality requirements of the Statistics Act | ||||||
Finance and Insurance Industries
In 2019, enterprises operating in the financial sector accounted for $8.5 trillion in assets, representing 56.5% of total assets.
Enterprises in these highly regulated industries are predominantly Canadian-controlled, resulting in foreign-controlled assets representing less than a tenth of the total. In 2019 the foreign-controlled share of assets was 8.8%, down from 8.9% the previous year.

Data table for Chart 6
| 2008 | 2009 | 2010 | 2011 | 2012 | 2013 | 2014 | 2015 | 2016 | 2017 | 2018 | 2019 | |
|---|---|---|---|---|---|---|---|---|---|---|---|---|
| percent | ||||||||||||
| Assets | 14.3 | 13.4 | 12.7 | 12.5 | 12.3 | 12.2 | 12.0 | 10.0 | 9.5 | 9.3 | 8.9 | 8.8 |
| Operating revenues | 21.5 | 20.6 | 20.2 | 18.3 | 17.7 | 17.7 | 17.3 | 15.8 | 15.5 | 15.1 | 14.1 | 13.3 |
| Operating profits | 20.6 | 20.4 | 16.5 | 15.8 | 14.0 | 13.2 | 12.5 | 13.0 | 12.5 | 10.8 | 10.1 | 10.7 |
| Source: Table 33-10-0033-01. | ||||||||||||
Among all financial industries, non-depository credit intermediation has historically been and remains the one with the highest level of foreign control. The countries whose enterprises controlled the most foreign financial assets were the United States with 43.8%, the United Kingdom with 21.1% and Japan with 9.7%.

Data table for Chart 7
| Percent | |
|---|---|
| United States of America | 43.8 |
| United Kingdom | 21.1 |
| Japan | 9.7 |
| Germany | 6.0 |
| Switzerland | 4.6 |
| France | 3.5 |
| Netherlands | 2.2 |
| China | 2.0 |
| Rest of the world | 7.0 |
| Source: Table 33-10-0033-01. | |
| Assets | ||||||
|---|---|---|---|---|---|---|
| 2017 | 2018 | 2019 | 2017 | 2018 | 2019 | |
| millions of dollars | percent | |||||
| Total Americas (excluding Canada) | 315,880 | 322,537 | 332,497 | 46.2 | 45.5 | 44.3 |
| United States of America | 311,648 | 318,959 | 329,216 | 45.6 | 45.0 | 43.8 |
| Mexico | x | Note x: suppressed to meet the confidentiality requirements of the Statistics Act | Note x: suppressed to meet the confidentiality requirements of the Statistics Act | Note x: suppressed to meet the confidentiality requirements of the Statistics Act | Note x: suppressed to meet the confidentiality requirements of the Statistics Act | Note x: suppressed to meet the confidentiality requirements of the Statistics Act |
| Brazil | x | Note x: suppressed to meet the confidentiality requirements of the Statistics Act | Note x: suppressed to meet the confidentiality requirements of the Statistics Act | Note x: suppressed to meet the confidentiality requirements of the Statistics Act | Note x: suppressed to meet the confidentiality requirements of the Statistics Act | Note x: suppressed to meet the confidentiality requirements of the Statistics Act |
| Other Americas | 2,659 | 2,767 | 3,095 | 0.4 | 0.4 | 0.4 |
| Total Asia | 89,398 | 98,183 | 108,996 | 13.1 | 13.8 | 14.5 |
| China | 8,275 | 12,651 | 15,029 | 1.2 | 1.8 | 2.0 |
| India | 8,596 | 9,004 | 8,934 | 1.3 | 1.3 | 1.2 |
| Japan | 61,843 | 62,610 | 72,590 | 9.0 | 8.8 | 9.7 |
| South Korea | 3,697 | 4,320 | 4,237 | 0.5 | 0.6 | 0.6 |
| Other Asia | 6,987 | 9,598 | 8,207 | 1.0 | 1.4 | 1.1 |
| Total Europe | 266,672 | 281,983 | 300,132 | 39.0 | 39.8 | 40.0 |
| France | 25,273 | 27,365 | 26,482 | 3.7 | 3.9 | 3.5 |
| Germany | 40,181 | 43,954 | 45,400 | 5.9 | 6.2 | 6.0 |
| United Kingdom | 142,571 | 151,193 | 158,733 | 20.8 | 21.3 | 21.1 |
| Italy | 4,056 | 4,192 | 3,797 | 0.6 | 0.6 | 0.5 |
| Netherlands | 13,537 | 14,309 | 16,303 | 2.0 | 2.0 | 2.2 |
| Switzerland | 32,678 | 32,369 | 34,511 | 4.8 | 4.6 | 4.6 |
| Other Europe | 8,376 | 8,602 | 14,905 | 1.2 | 1.2 | 2.0 |
| Total Oceania, Antarctica and adjacent islands | x | Note x: suppressed to meet the confidentiality requirements of the Statistics Act | Note x: suppressed to meet the confidentiality requirements of the Statistics Act | Note x: suppressed to meet the confidentiality requirements of the Statistics Act | Note x: suppressed to meet the confidentiality requirements of the Statistics Act | Note x: suppressed to meet the confidentiality requirements of the Statistics Act |
| Australia | 12,040 | 6,391 | 9,246 | 1.8 | 0.9 | 1.2 |
| Other Oceania, Antarctica and adjacent islands | x | Note x: suppressed to meet the confidentiality requirements of the Statistics Act | Note x: suppressed to meet the confidentiality requirements of the Statistics Act | Note x: suppressed to meet the confidentiality requirements of the Statistics Act | Note x: suppressed to meet the confidentiality requirements of the Statistics Act | Note x: suppressed to meet the confidentiality requirements of the Statistics Act |
| Total Africa | x | Note x: suppressed to meet the confidentiality requirements of the Statistics Act | Note x: suppressed to meet the confidentiality requirements of the Statistics Act | Note x: suppressed to meet the confidentiality requirements of the Statistics Act | Note x: suppressed to meet the confidentiality requirements of the Statistics Act | Note x: suppressed to meet the confidentiality requirements of the Statistics Act |
| Total foreign control | 684,099 | 709,204 | 750,983 | 100.0 | 33.0 | 33.6 |
| x suppressed to meet the confidentiality requirements of the Statistics Act | ||||||
| Total assets | Assets under foreign control | |||||
|---|---|---|---|---|---|---|
| 2017 | 2018 | 2019 | 2017 | 2018 | 2019 | |
| millions of dollars | percent | |||||
| Agriculture, forestry, fishing and hunting | 167,767 | 206,107 | 220,891 | 2.2 | 2.5 | 2.0 |
| Oil and gas extraction and support activities | 715,107 | 711,685 | 703,095 | 39.0 | 39.2 | 32.3 |
| Mining and quarrying | 276,302 | 284,719 | 286,538 | 25.8 | 26.1 | 40.2 |
| Utilities | 410,411 | 444,663 | 455,043 | 2.1 | 4.6 | 4.7 |
| Construction | 354,530 | 393,326 | 414,634 | 7.3 | 6.3 | 5.8 |
| Manufacturing | 960,668 | 1,035,843 | 1,104,514 | 49.0 | 47.5 | 45.4 |
| Wholesale trade | 463,842 | 494,635 | 518,534 | 52.9 | 50 | 49.9 |
| Retail trade | 310,223 | 315,517 | 351,464 | 25.8 | 25.2 | 26.0 |
| Transportation and warehousing | 417,748 | 458,658 | 586,875 | 5.9 | 6.2 | 5.5 |
| Information and cultural industries | 269,233 | 276,356 | 295,390 | 8.0 | 8.2 | 10.5 |
| Real estate and rental and leasing | 722,703 | 776,586 | 846,638 | 5.5 | 6.9 | 6.6 |
| Professional, scientific and technical services | 250,910 | 288,881 | 304,873 | 21.4 | 22.8 | 22.8 |
| Administrative and support, waste management and remediation services | 107,426 | 119,293 | 120,824 | 18.2 | 16.3 | 18.2 |
| Educational, health care and social assistance services | 117,113 | 128,825 | 141,632 | 2.6 | 2.7 | 2.8 |
| Arts, entertainment and recreation | 39,947 | 41,656 | 43,897 | 15.3 | 14.5 | 14.3 |
| Accommodation and food services | 78,135 | 84,815 | 87,676 | 13.5 | 13.3 | 13.0 |
| Repair, maintenance and personal services | 56,234 | 63,601 | 75,744 | 12.8 | 12.4 | 10.5 |
| Total non-financial industries | 5,718,300 | 6,125,166 | 6,558,263 | 24.0 | 23.5 | 22.6 |
| Non-depository credit intermediation | 455,339 | 464,253 | 479,583 | 41.1 | 40.6 | 39.4 |
| Insurance carriers and related activities | 1,275,415 | 1,293,145 | 1,407,349 | 9.8 | 10.4 | 9.7 |
| Other financial industries | 1,106,880 | 1,358,554 | 1,407,021 | 13.2 | 10.8 | 11.5 |
| Depository credit intermediation | 4,502,833 | 4,857,429 | 5,210,712 | 5.0 | 4.9 | 5.0 |
| Total finance and insurance industries | 7,340,466 | 7,973,381 | 8,504,666 | 9.3 | 8.9 | 8.8 |
| Total all industries | 13,058,765 | 14,098,547 | 15,062,929 | 15.7 | 15.3 | 14.8 |
Data quality, concepts and methodology
In line with Statistics Canada’s modernization initiative, the full set of statistical tables can be viewed in an interactive format on our website (www.statcan.gc.ca).
Please consult Table 33-10-0084-01 “Foreign-controlled enterprises in Canada, by financial characteristic and selected country of control” for more details.
For additional details on quality, concepts and methodology, please see the program information on our website here: Corporations Returns Act.
Related Products
Selected data tables from Statistics Canada
Selected publications from Statistics Canada
Selected survey programs from Statistics Canada
- Date modified: