
Corporations Returns Act
2018

Archived Content
Information identified as archived is provided for reference, research or recordkeeping purposes. It is not subject to the Government of Canada Web Standards and has not been altered or updated since it was archived. Please "contact us" to request a format other than those available.
Skip to text
Text begins
Introduction
Under the authority of the Minister of Innovation, Science and Economic Development Canada, Statistics Canada administers the Corporations Returns Act which requires the collection of financial and ownership information on corporations conducting business in Canada. This information is used to evaluate the extent of foreign control of the Canadian corporate economy.
The Corporations Returns Act requires that an annual report be submitted to Parliament summarizing the extent to which foreign control is prevalent in Canada. This is the report for reference year 2018.
In this report, three components are used to measure foreign control: assets, operating revenues and operating profits.
- Asset-based measures of foreign control provide a longer term perspective. Assets are a stock item, reflecting economic decisions and market conditions that evolve more slowly over time.
- Revenue-based measures represent a flow item and are closely tied to the business cycle. Revenues tend to reflect current business conditions, causing them to be more volatile than asset-based measures.
- Profits are a measure of the financial health and well-being of an economy and can be used to assess its performance and sustainability.
These statistics are compiled from enterprise level data. An enterprise can be a single corporation or a family of corporations under common ownership and/or control, for which consolidated financial statements are produced.
The report covers all incorporated enterprises in Canada, including federal and provincial government business enterprises (GBEs) but excluding enterprises classified under the North American Industry Classification System (NAICS) to Management of Companies and Enterprises (NAICS 55), Religious Organizations (NAICS 8131), Political Organizations (NAICS 81394), Public Administration (NAICS 91), as well as Funds and other Financial Vehicles (NAICS 526). GBEs are public sector enterprises engaged in operations of a commercial nature.
All industry analysis is based on 21 groups of industries which have been defined using NAICS.
Data was compiled by geographic macro-region using the Standard Classification of Countries and Areas of Interest (SCCAI 2016) structure.
Highlights
- The foreign-controlled share of assets decreased marginally, from 15.7% to 15.3% in 2018. The share of operating revenues decreased slightly from 27.8% to 27.3%, while that of operating profits increased 0.6% over the previous year.
- In the non-financial industries, the share of assets under foreign control is at an eleven year low at 23.3% in 2018, down from 24.0% the year earlier. The share of operating revenue under foreign control fell slightly to 29%, while operating profits rose to 22.5% from 20.8% the year before.
- The share of assets held by Canadian-controlled enterprises in the oil and gas extraction industry increased slightly by 0.7% in 2018. The percentage of total assets owned by American-controlled enterprises in this industry fell by 1.0% and offset the gains made by Asian-controlled enterprises by 0.7%. As a result, the share of foreign-controlled assets in this industry declined to 38.3% from 39.0% in the previous year.
- In the finance and insurance industries, the foreign-controlled share of assets fell slightly to 9.1% in 2018, down from 9.3% in 2017. The revenue share decreased from 15.1% to 14.1%. The foreign-controlled share of profit was also down, from 10.8% to 9.8%.
- Enterprises controlled from the United States maintained the largest overall share of foreign-controlled assets in Canada (50.1%), followed by the United Kingdom (11.3%) and Japan (6.0%).
Analysis
All Industries
In 2018, enterprises operating in Canada held $14 trillion in assets, generated $4.5 trillion in operating revenues and earned $500.3 billion in operating profits. Their assets increased 7.4%, operating revenues 7.0% and operating profits 13.4% from 2017 levels.
Both Canadian and foreign-controlled total asset values increased in 2018, by 7.9% and 4.3%, respectively. The foreign-controlled asset share fell slightly, from 15.7% to 15.3% in 2018.
Foreign-controlled revenue growth dropped to 5.2% from 6.9% while Canadian-controlled revenue growth was up to 7.6% in 2018 from 6.2% in 2017. The share of revenues under foreign control was down slightly from 27.7% in 2017 to 27.3% in 2018.
Canadian and foreign-controlled operating profits increased by 12.7% and 17.1% respectively in 2018. The share of profits under foreign control grew from 17.4% in 2017 to 18.0% in 2018.
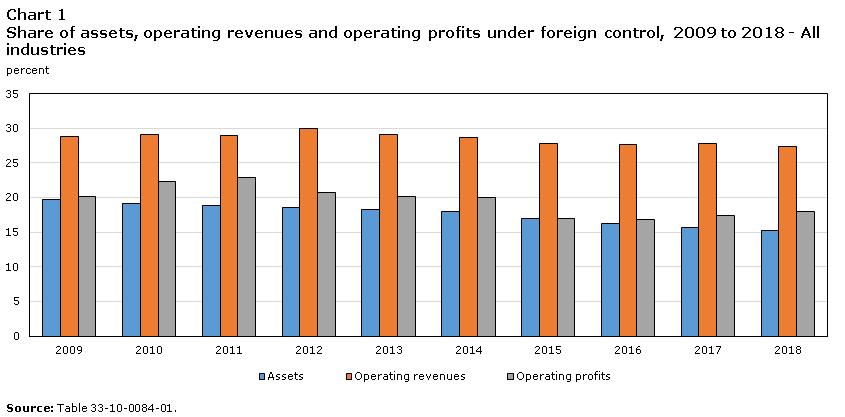
Data table for Chart 1
| Assets | Operating revenues | Operating profits | |
|---|---|---|---|
| percent | |||
| 2007 | 21.6 | 29.6 | 26.5 |
| 2008 | 20.6 | 30.1 | 24.9 |
| 2009 | 19.7 | 28.8 | 20.2 |
| 2010 | 19.2 | 29.1 | 22.3 |
| 2011 | 18.9 | 29.0 | 22.9 |
| 2012 | 18.5 | 30.0 | 20.7 |
| 2013 | 18.3 | 29.1 | 20.1 |
| 2014 | 18.0 | 28.7 | 20.0 |
| 2015 | 16.9 | 27.8 | 16.9 |
| 2016 | 16.3 | 27.6 | 16.8 |
| 2017 | 15.7 | 27.8 | 17.4 |
| 2018 | 15.3 | 27.3 | 18.0 |
Returns collected under the Corporations Returns Act show that enterprises in Canada are controlled by entities from over 80 countries. However, only eight countries account for 85.7% of these foreign-owned assets. American-controlled enterprises held the highest share in 2018, accounting for 50.1% of all assets under foreign control.

Data table for Chart 2
| Percent | |
|---|---|
| United States of America | 50.1 |
| United Kingdom | 11.3 |
| Japan | 6.0 |
| Germany | 4.4 |
| Switzerland | 3.8 |
| France | 3.9 |
| China | 3.7 |
| Netherlands | 2.5 |
| Rest of the world | 14.3 |
Over the previous decade, the share of assets owned by foreign-controlled enterprises have steadily declined. In the same period, Asian-controlled enterprises have seen a slight increase in the share of assets, while American-controlled enterprises have decreased.
In order to provide additional geographic level detail on foreign control in Canada, data has been compiled by macro region and by country, including a residual category for each macro region. The macro regions are:
- Americas (excluding Canada)
- Europe
- Africa
- Asia
- Oceania
- Antarctica and Adjacent Islands
In 2018, more than half of all assests under foreign control belonged to enterprises from the Americas macro region, followed by Europe (31.7%) and Asia at 15.1%. The share of assets owned by enterprises in the Asia region grew by 0.6% from 2017. There was little change in these proportions from the previous year for the other macro regions.

Data table for Chart 3
| Percent | |
|---|---|
| Americas | 51.9 |
| Europe | 31.7 |
| Asia | 15.1 |
| Africa,Oceania, Antarctica and adjacent islands | 1.2 |
| Assets | ||||||
|---|---|---|---|---|---|---|
| 2016 | 2017 | 2018 | 2016 | 2017 | 2018 | |
| millions of dollars | percent | |||||
| Total Americas (excluding Canada) | 1,060,679 | 1,075,033 | 1,113,849 | 52.9 | 52.3 | 51.9 |
| United States of America | 1,020,534 | 1,035,346 | 1,073,221 | 50.9 | 50.4 | 50.1 |
| Mexico | 4,576 | 4,587 | 4,512 | 0.2 | 0.2 | 0.2 |
| Brazil | 29,975 | 29,750 | 30,796 | 1.5 | 1.4 | 1.4 |
| Other Americas | 5,594 | 5,349 | 5,320 | 0.3 | 0.3 | 0.2 |
| Total Asia | 276,414 | 297,096 | 324,167 | 13.8 | 14.5 | 15.1 |
| China | 61,753 | 70,962 | 78,708 | 3.1 | 3.5 | 3.7 |
| India | 17,067 | 17,446 | 18,824 | 0.9 | 0.8 | 0.9 |
| Japan | 111,732 | 119,195 | 129,619 | 5.6 | 5.8 | 6.0 |
| South Korea | 9,876 | 11,197 | 12,371 | 0.5 | 0.5 | 0.6 |
| Other Asia | 75,987 | 78,296 | 84,645 | 3.8 | 3.8 | 3.9 |
| Total Europe | 636,635 | 650,652 | 680,563 | 31.7 | 31.7 | 31.7 |
| France | 73,904 | 75,432 | 83,473 | 3.7 | 3.7 | 3.9 |
| Germany | 89,082 | 87,112 | 94,901 | 4.4 | 4.2 | 4.4 |
| United Kingdom | 212,614 | 231,525 | 241,732 | 10.6 | 11.3 | 11.3 |
| Italy | 18,592 | 17,945 | 16,612 | 0.9 | 0.9 | 0.8 |
| Netherlands | 61,676 | 50,318 | 53,464 | 3.1 | 2.4 | 2.5 |
| Switzerland | 79,429 | 80,596 | 80,609 | 4.0 | 3.9 | 3.8 |
| Other Europe | 101,338 | 107,724 | 109,772 | 5.0 | 5.2 | 5.1 |
| Total Oceania, Antarctica and adjacent islands | 30,445 | 28,528 | 25,067 | 1.5 | 1.4 | 1.2 |
| Australia | 29,780 | 27,646 | 24,238 | 1.5 | 1.3 | 1.1 |
| Other Oceania, Antarctica and adjacent islands | 665 | 882 | 828 | 0.0 | 0.0 | 0.0 |
| Total Africa | 2,684 | 3,433 | 597 | 0.1 | 0.2 | 0.0 |
| Total foreign control | 2,006,857 | 2,054,740 | 2,144,243 | 100.0 | 100.0 | 100.0 |
Non-financial Industries
In 2018, enterprises in non-financial industries held $6.1 trillion in assets, generated $4.0 trillion in revenues and earned $322.2 billion in profits. While non-financial industries represented less than one-half (43.6%) of total assets in Canada, they generated 88.6% of revenues and 64.4% of profits.
Enterprises under foreign control have seen a decline in the share of assets, a gradual increase in the share of profits and little change in the share of operating revenues over the last three years.
Assets held by Canadian-controlled enterprises rose 7.9% in 2018, while those held by foreign-controlled enterprises increased 4.0%. As a result, the share of assets under foreign control went from 24.0% the previous year to 23.3% in 2018.
Total operating revenues increased in 2018, with revenues under Canadian and foreign-controlled enterprises up 7.0% and 5.4% respectively. The share of operating revenues under foreign control decreased slightly from 29.3% to 29.0% in 2018.
Total operating profits increased 11.2% in 2018. Profits in Canadian and foreign-controlled non-financial industries went up 8.9% and 19.9%, respectively. In dollar amounts, Canadian-controlled enterprises earned $249.8 billion, while foreign-controlled enterprises earned $72.4 billion in 2018. The foreign-controlled share of operating profits rose for a third consecutive year to 22.5%.
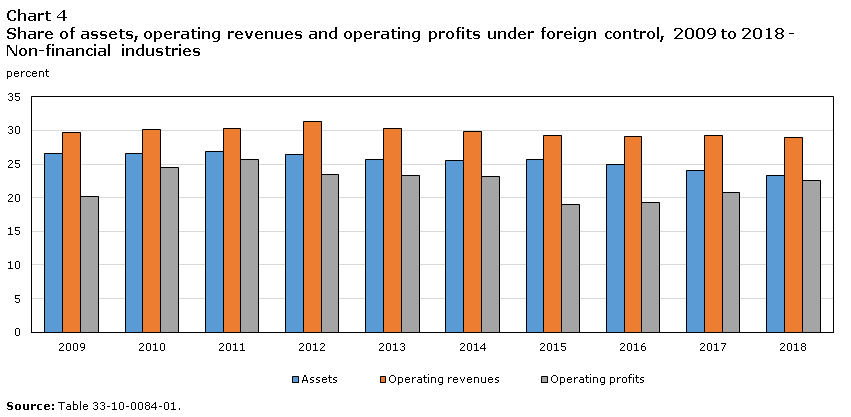
Data table for Chart 4
| Assets | Operating revenues | Operating profits | |
|---|---|---|---|
| percent | |||
| 2007 | 27.6 | 30.5 | 28.7 |
| 2008 | 27.3 | 31.0 | 26.5 |
| 2009 | 26.5 | 29.7 | 20.2 |
| 2010 | 26.6 | 30.1 | 24.5 |
| 2011 | 26.8 | 30.2 | 25.6 |
| 2012 | 26.4 | 31.3 | 23.5 |
| 2013 | 25.7 | 30.3 | 23.3 |
| 2014 | 25.5 | 29.9 | 23.2 |
| 2015 | 25.6 | 29.2 | 19.0 |
| 2016 | 25.0 | 29.1 | 19.3 |
| 2017 | 24.0 | 29.3 | 20.8 |
| 2018 | 23.3 | 29.0 | 22.5 |
Wholesale trade, manufacturing, and oil and gas extraction were the non-financial industries with the largest share of foreign control as measured by assets. The share of assets under foreign control were 50.6% for wholesale trade, 47.6% for manufacturing and 38.3% for oil and gas in 2018.
The share of assets of foreign-controlled enterprises in the non-financial sector is currently at an eleven year low. Enterprises controlled in the Americas macro region held 55.4% of foreign assets in 2018, down slightly from the year before. Additionally, the share of assets held by enterprises controlled in Europe fell slightly to 27.9%. The asset share of enterprises controlled in Asia were up slightly from the previous year to 15.4%. The countries whose enterprises controlled the most assets in Canada were the United States with 52.8%, the United Kingdom with 6.1% and China with 4.6% of foreign-controlled assets. Non-financial industry assets of enterprises controlled in China surpassed non-financial assets of enterprises controlled in Japan for the first time in 2016 and maintained their position since.
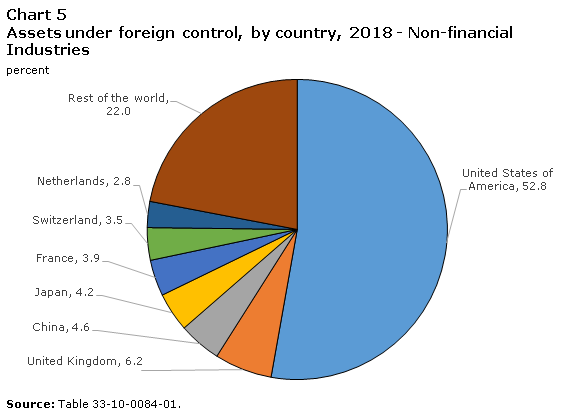
Data table for Chart 5
| Percent | |
|---|---|
| United States of America | 52.8 |
| United Kingdom | 6.2 |
| China | 4.6 |
| Japan | 4.2 |
| France | 3.9 |
| Switzerland | 3.5 |
| Netherlands | 2.8 |
| Rest of the world | 22.0 |
| Assets | ||||||
|---|---|---|---|---|---|---|
| 2016 | 2017 | 2018 | 2016 | 2017 | 2018 | |
| millions of dollars | percent | |||||
| Total Americas (excluding Canada) | 749,177 | 759,153 | 790,259 | 55.8 | 55.4 | 55.4 |
| United States of America | 713,250 | 723,699 | 753,291 | 53.1 | 52.8 | 52.8 |
| Mexico | x | x | x | Note x: suppressed to meet the confidentiality requirements of the Statistics Act | Note x: suppressed to meet the confidentiality requirements of the Statistics Act | Note x: suppressed to meet the confidentiality requirements of the Statistics Act |
| Brazil | x | x | x | Note x: suppressed to meet the confidentiality requirements of the Statistics Act | Note x: suppressed to meet the confidentiality requirements of the Statistics Act | Note x: suppressed to meet the confidentiality requirements of the Statistics Act |
| Other Americas | 2,931 | 2,690 | 2,553 | 0.2 | 0.2 | 0.2 |
| Total Asia | 195,712 | 207,697 | 219,023 | 14.6 | 15.2 | 15.4 |
| China | 56,173 | 62,686 | 66,071 | 4.2 | 4.6 | 4.6 |
| India | 8,164 | 8,851 | 9,813 | 0.6 | 0.6 | 0.7 |
| Japan | 54,840 | 57,352 | 60,010 | 4.1 | 4.2 | 4.2 |
| South Korea | 6,635 | 7,499 | 8,093 | 0.5 | 0.5 | 0.6 |
| Other Asia | 69,899 | 71,309 | 75,036 | 5.2 | 5.2 | 5.3 |
| Total Europe | 377,201 | 383,980 | 397,440 | 28.1 | 28.0 | 27.9 |
| France | 46,417 | 50,159 | 56,217 | 3.5 | 3.7 | 3.9 |
| Germany | 44,824 | 46,931 | 50,928 | 3.3 | 3.4 | 3.6 |
| United Kingdom | 84,073 | 88,954 | 87,794 | 6.3 | 6.5 | 6.2 |
| Italy | x | 13,889 | 12,421 | Note x: suppressed to meet the confidentiality requirements of the Statistics Act | 1.0 | 0.9 |
| Netherlands | 49,655 | 36,780 | 39,222 | 3.7 | 2.7 | 2.8 |
| Switzerland | 43,039 | 47,918 | 49,163 | 3.2 | 3.5 | 3.4 |
| Other Europe | x | 99,348 | 101,696 | Note x: suppressed to meet the confidentiality requirements of the Statistics Act | 7.2 | 7.1 |
| Total Oceania, Antarctica and adjacent islands | x | x | x | Note x: suppressed to meet the confidentiality requirements of the Statistics Act | Note x: suppressed to meet the confidentiality requirements of the Statistics Act | Note x: suppressed to meet the confidentiality requirements of the Statistics Act |
| Australia | 17,070 | 15,606 | 17,871 | 1.3 | 1.1 | 1.3 |
| Other Oceania, Antarctica and adjacent islands | Note x: suppressed to meet the confidentiality requirements of the Statistics Act | Note x: suppressed to meet the confidentiality requirements of the Statistics Act | Note x: suppressed to meet the confidentiality requirements of the Statistics Act | Note x: suppressed to meet the confidentiality requirements of the Statistics Act | Note x: suppressed to meet the confidentiality requirements of the Statistics Act | Note x: suppressed to meet the confidentiality requirements of the Statistics Act |
| Total Africa | Note x: suppressed to meet the confidentiality requirements of the Statistics Act | Note x: suppressed to meet the confidentiality requirements of the Statistics Act | Note x: suppressed to meet the confidentiality requirements of the Statistics Act | Note x: suppressed to meet the confidentiality requirements of the Statistics Act | Note x: suppressed to meet the confidentiality requirements of the Statistics Act | Note x: suppressed to meet the confidentiality requirements of the Statistics Act |
| Total foreign control | 1,342,508 | 1,370,641 | 1,425,909 | 100.0 | 100.0 | 100.0 |
Finance and Insurance Industries
In 2018, enterprises operating in the financial sector accounted for $7.9 trillion in assets, $509.5 billion in revenues and $178.1 billion in profits. This represented 56.4%, 11.4% and 35.6% of total assets, total operating revenues and total operating profits, respectively.
Enterprises in these industries are predominantly Canadian-controlled: 90.9% of total assets in 2018 were Canadian-controlled and reported asset growth of 8.0% from the previous year. The share of assets held by foreign-controlled enterprises shrank slightly (-0.2%) from 2017.
Revenues of Canadian-controlled enterprises rose 12% in 2018, while foreign-controlled enterprises grew by 2.8%. The share of revenues under foreign control decreased to 14.1% from 15.1% the previous year.
Operating profits of Canadian-controlled enterprises rose 19%, while foreign-controlled enterprises climbed by 6.8%. The foreign-controlled share of operating profits was 9.8%, down from 10.8% in 2017.

Data table for Chart 6
| Assets | Operating revenues | Operating profits | |
|---|---|---|---|
| percent | |||
| 2007 | 15.7 | 21.8 | 21.4 |
| 2008 | 14.3 | 21.5 | 20.6 |
| 2009 | 13.4 | 20.6 | 20.4 |
| 2010 | 12.7 | 20.2 | 16.5 |
| 2011 | 12.5 | 18.3 | 15.8 |
| 2012 | 12.3 | 17.7 | 14.0 |
| 2013 | 12.2 | 17.7 | 13.2 |
| 2014 | 12.0 | 17.3 | 12.5 |
| 2015 | 10.0 | 15.8 | 13.0 |
| 2016 | 9.5 | 15.5 | 12.5 |
| 2017 | 9.3 | 15.1 | 10.8 |
| 2018 | 9.1 | 14.1 | 9.8 |
Among all financial industries, non-depository credit intermediation has historically been and remains the one with the highest level of foreign control. The countries whose enterprises controlled the most foreign financial assets were the United States with 44.5%, the United Kingdom with 21.4% and Japan with 9.7%.
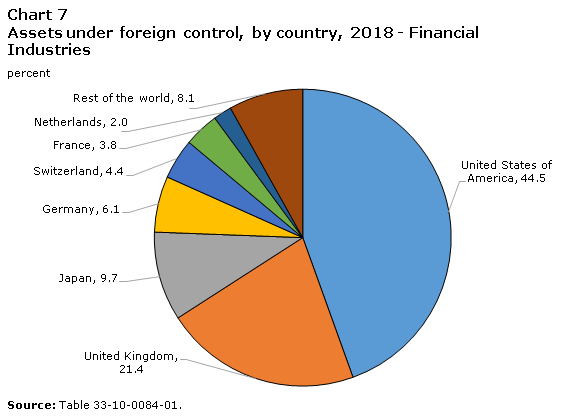
Data table for Chart 7
| Percent | |
|---|---|
| United States of America | 44.5 |
| United Kingdom | 21.4 |
| Japan | 9.7 |
| Germany | 6.1 |
| Switzerland | 4.4 |
| France | 3.8 |
| Netherlands | 2.0 |
| Rest of the world | 8.1 |
| Assets | ||||||
|---|---|---|---|---|---|---|
| 2016 | 2017 | 2018 | 2016 | 2017 | 2018 | |
| millions of dollars | percent | |||||
| Total Americas (excluding Canada) | 311,503 | 315,880 | 323,589 | 46.9 | 46.2 | 45.0 |
| United States of America | 307,284 | 311,648 | 319,930 | 46.3 | 45.6 | 44.5 |
| Mexico | x | x | x | Note x: suppressed to meet the confidentiality requirements of the Statistics Act | Note x: suppressed to meet the confidentiality requirements of the Statistics Act | Note x: suppressed to meet the confidentiality requirements of the Statistics Act |
| Brazil | x | x | x | Note x: suppressed to meet the confidentiality requirements of the Statistics Act | Note x: suppressed to meet the confidentiality requirements of the Statistics Act | Note x: suppressed to meet the confidentiality requirements of the Statistics Act |
| Other Americas | 2,663 | 2,659 | 2,767 | 0.4 | 0.4 | 0.4 |
| Total Asia | 80,703 | 89,398 | 105,143 | 12.1 | 13.1 | 14.6 |
| China | 5,580 | 8,275 | 12,637 | 0.8 | 1.2 | 1.8 |
| India | 8,903 | 8,596 | 9,010 | 1.3 | 1.3 | 1.3 |
| Japan | 56,891 | 61,843 | 69,609 | 8.6 | 9.0 | 9.7 |
| South Korea | 3,241 | 3,697 | 4,279 | 0.5 | 0.5 | 0.6 |
| Other Asia | 6,088 | 6,987 | 9,609 | 0.9 | 1.0 | 1.3 |
| Total Europe | 259,434 | 266,672 | 283,123 | 39.1 | 39.0 | 39.4 |
| France | 27,487 | 25,273 | 27,257 | 4.1 | 3.7 | 3.8 |
| Germany | 44,258 | 40,181 | 43,973 | 6.7 | 5.9 | 6.1 |
| United Kingdom | 128,541 | 142,571 | 153,938 | 19.3 | 20.8 | 21.4 |
| Italy | x | 4,056 | 4,192 | Note x: suppressed to meet the confidentiality requirements of the Statistics Act | 0.6 | 0.6 |
| Netherlands | 12,021 | 13,537 | 14,242 | 1.8 | 2.0 | 2.0 |
| Switzerland | 36,390 | 32,678 | 31,446 | 5.5 | 4.8 | 4.4 |
| Other Europe | x | 8,376 | 8,075 | Note x: suppressed to meet the confidentiality requirements of the Statistics Act | 1.2 | 1.1 |
| Total Oceania, Antarctica and adjacent islands | x | x | x | Note x: suppressed to meet the confidentiality requirements of the Statistics Act | Note x: suppressed to meet the confidentiality requirements of the Statistics Act | Note x: suppressed to meet the confidentiality requirements of the Statistics Act |
| Australia | 12,710 | 12,040 | 6,368 | 1.9 | 1.8 | 0.9 |
| Other Oceania, Antarctica and adjacent islands | x | x | x | Note x: suppressed to meet the confidentiality requirements of the Statistics Act | Note x: suppressed to meet the confidentiality requirements of the Statistics Act | Note x: suppressed to meet the confidentiality requirements of the Statistics Act |
| Total Africa | x | x | x | Note x: suppressed to meet the confidentiality requirements of the Statistics Act | Note x: suppressed to meet the confidentiality requirements of the Statistics Act | Note x: suppressed to meet the confidentiality requirements of the Statistics Act |
| Total foreign control | 664,349 | 684,099 | 718,333 | 100.0 | 100.0 | 100.0 |
Selected Industries
Wholesale trade
In 2018, enterprises in the wholesale trade industry held $499.3 billion in assets, an increase of 7.7% from the previous year. Canadian-controlled wholesalers’ assets increased 12.9%, and foreign-controlled wholesalers’ assets increased 2.9%. As a result, the share of assets held by foreign-controlled enterprises declined, to 50.6%. Since 2015, wholesale trade has been the only industry in the non-financial sector with over half of assets held by foreign-controlled enterprises.
Revenues and operating profits in the wholesale trade industry grew as well, for both Canadian-controlled and foreign-controlled enterprises. In total, revenues increased 6.4% and operating profits increased 14.0%. The share of revenues and operating profits earned by foreign-controlled enterprises fell slightly to 45.3% and 41.3%, respectively.
The countries whose enterprises controlled the most assets were the United States, with 54.6% of foreign-controlled assets, the United Kingdom with 8.8%, Japan with 8.5% and Germany with 7.0%.
Manufacturing
Enterprises in the manufacturing sector held $1.0 trillion in assets in 2018, an increase in value of 7.7% from the previous year. Canadian-controlled manufacturers’ assets increased 10.6%, and foreign-controlled manufacturers' assets increased 4.8%. As a result, the share of assets held by foreign-controlled enterprises decreased to 47.6% from 49.0%.
Revenues and operating profits in manufacturing grew as well, for both Canadian-controlled and foreign-controlled enterprises. In total, revenues increased 5.1% and operating profits increased 13.8%. The share of revenues earned by foreign-controlled enterprises was down slightly to 53.7%, and the share of profits earned by foreign-controlled enterprises increased slightly from 53.5% in 2017 to 54.0% in 2018.
The countries whose enterprises controlled the most assets were the United States, with 56.9% of foreign-controlled assets followed by United Kingdom with 7.3%.
Oil and gas extraction and support activities
In 2018, enterprises in the oil and gas extraction and support industry held $701.5 billion in assets, a decrease of 1.9% from the previous year. The assets of Canadian-controlled enterprises decreased by 0.1%, while the assets of foreign-controlled enterprises fell 3.6%. As a result, the share of assets held by foreign-controlled enterprises declined to 38.3% from 39.0% the previous year.
Revenues across the industry grew 11.6%, and operating profits marked a sizeable increase of 620% in 2018, recouping some of the losses incurred in recent past years. For the first time since 2014, foreign-controlled enterprises in this industry returned to positive profits, earning $1.48 billion in 2018. Canadian-controlled enterprises nearly doubled their operating profits from $4.3 billion to $8.3 billion in 2018.
The countries whose enterprises controlled the most assets were the United States, with 32.1% of foreign-controlled assets and China with 21.1%. Looking at assets under foreign control from a macro region perspective, enterprises in Asia held 41.2% of assets and enterprises in Europe held 22.6%.
Non-Depository Credit Intermediaries
Enterprises in the non-depository credit intermediation industry held $462 billion in assets in 2018, an increase of 1.5% from the previous year. The value of assets held by Canadian-controlled enterprises grew 2.1%, while the value of assets held by foreign-controlled enterprises grew slightly by 0.4%, to $188 billion. Of the financial industries, non-depository credit intermediation had the largest share of foreign-controlled enterprises, with 40.7% of assets under foreign control. No other industry in the financial sector had more than 15% of their assets under foreign control.
Revenues for non-depository credit intermediaries controlled in Canada grew 19.4%, outpacing the revenue growth of foreign-controlled enterprises, which grew 7.7%. Consequently, the share of revenues in foreign-controlled enterprises was 46.9%, down 2.5% from the previous year.
Profits for non-depository credit intermediaries grew 15.8% for Canadian-controlled enterprises and 10.8% for foreign-controlled enterprises. The share of profit earned by foreign-controlled enterprises shrunk from 43.9% in 2017 to 42.9% in 2018.
The countries whose enterprises controlled the most assets were the United States, with 47.6% of foreign-controlled assets and Germany with 15.1%.
| Total assets | Assets under foreign control | |||||
|---|---|---|---|---|---|---|
| 2016 | 2017 | 2018 | 2016 | 2017 | 2018 | |
| millions of dollars | percent | |||||
| Agriculture, forestry, fishing and hunting | 152,637 | 167,767 | 203,831 | 1.6 | 2.2 | 2.3 |
| Oil and gas extraction and support activities | 644,679 | 715,107 | 701,577 | 44.1 | 39.0 | 38.3 |
| Mining and quarrying | 236,188 | 276,302 | 291,373 | 26.8 | 25.8 | 25.0 |
| Utilities | 395,378 | 410,411 | 446,409 | 6.2 | 2.1 | 4.5 |
| Construction | 332,360 | 354,530 | 390,304 | 7.3 | 7.3 | 6.2 |
| Manufacturing | 991,604 | 960,668 | 1,035,112 | 47.0 | 49.0 | 47.6 |
| Wholesale trade | 430,281 | 463,842 | 499,347 | 52.7 | 52.9 | 50.6 |
| Retail trade | 291,466 | 310,223 | 315,959 | 26.5 | 25.8 | 25.5 |
| Transportation and warehousing | 341,603 | 417,748 | 455,366 | 5.6 | 5.9 | 6.1 |
| Information and cultural industries | 246,017 | 269,233 | 277,737 | 8.2 | 8.0 | 8.4 |
| Real estate and rental and leasing | 684,978 | 722,703 | 777,943 | 5.8 | 5.5 | 5.7 |
| Professional, scientific and technical services | 231,928 | 250,910 | 286,717 | 22.3 | 21.4 | 22.9 |
| Administrative and support, waste management and remediation services | 105,862 | 107,426 | 118,098 | 18.0 | 18.2 | 16.3 |
| Educational, health care and social assistance services | 108,693 | 117,113 | 128,710 | 1.4 | 2.6 | 2.7 |
| Arts, entertainment and recreation | 39,567 | 39,947 | 40,881 | 15.5 | 15.3 | 15.6 |
| Accommodation and food services | 72,069 | 78,135 | 84,751 | 11.8 | 13.5 | 13.8 |
| Repair, maintenance and personal services | 61,628 | 56,234 | 63,168 | 12.1 | 12.8 | 12.2 |
| Total non-financial industries | 5,366,937 | 5,718,300 | 6,117,283 | 25.0 | 24.0 | 23.3 |
| Non-depository credit intermediation | 449,071 | 455,339 | 461,955 | 45.2 | 41.1 | 40.7 |
| Insurance carriers and related activities | 1,263,489 | 1,275,415 | 1,280,555 | 9.5 | 9.8 | 10.3 |
| Other financial industries | 954,187 | 1,106,880 | 1,312,165 | 12.7 | 13.2 | 11.5 |
| Depository credit intermediation | 4,290,402 | 4,502,833 | 4,851,641 | 5.1 | 5.0 | 5.1 |
| Total finance and insurance industries | 6,957,149 | 7,340,466 | 7,906,315 | 9.5 | 9.3 | 9.1 |
| Total all industries | 12,324,086 | 13,058,765 | 14,023,599 | 16.3 | 15.7 | 15.3 |
Data quality, concepts and methodology
In line with Statistics Canada’s modernization initiative, the full set of statistical tables can be viewed in an interactive format on our website (www.statcan.gc.ca).
Please consult Table 33-10-0084-01 “Foreign-controlled enterprises in Canada, by financial characteristic and selected country of control” for more details.
Concepts and methods
This section outlines the basic concepts and methods needed to understand the data in this report.
Coverage
The data in this publication are compiled for statistical enterprises. An enterprise is a single corporation or a family of corporations under common ownership and/or control, for which consolidated financial statements are produced.
These enterprises are classified according to the 2017 North American Industry Classification System (NAICS). Each enterprise is assigned a six-digit NAICS code in two steps. First, a NAICS code is assigned to each establishment belonging to an enterprise. The enterprise is then assigned the NAICS code for the industry which accounts for the largest share of value-added across all the establishments that make up the enterprise. For publication purposes, enterprise data based on the six-digit NAICS codes have been aggregated into 21 industry groups, such as mining and manufacturing (Table D1).
The statistics in the report cover all incorporated enterprises in Canada, including federal and provincial government business enterprises (GBEs), but excluding enterprises classified to Management of Companies and Enterprises (NAICS 55); Religious Organizations (NAICS 8131); Political Organizations (NAICS 81394); Public Administration (NAICS 91); as well as Funds and other Financial Vehicles (NAICS 526). GBEs are public sector enterprises engaged in operations of a commercial nature.
| NAICS 2017 | |
|---|---|
| Non-financial industries | |
| Agriculture, forestry, fishing and hunting | 11 |
| Oil and gas extraction and support activities | 211, 213 |
| Mining and quarrying | 212 |
| Utilities | 22 |
| Construction | 23 |
| Manufacturing | 31, 032, 33 |
| Wholesale trade | 41 |
| Retail trade | 44, 45 |
| Transportation and warehousing | 48, 49 |
| Information and cultural industries | 51 |
| Real estate and rental and leasing | 53 |
| Professional, scientific and technical services | 54 |
| Administrative and support, waste management and remediation services | 56 |
| Educational, health care and social assistance services | 61, 62 |
| Arts, entertainment and recreation | 71 |
| Accommodation and food services | 72 |
| Repair, maintenance and personal services | 811, 812, 813 |
| Finance and insurance industries | |
| Non-depository credit intermediation | 5222 |
| Insurance carriers and related activities | 524 |
| Other financial industries | 5223, 523 |
| Depository credit intermediation | 5211, 5221 |
Data Sources
The Corporations Returns Act report focuses on the statistical enterprise. It is based on a dataset which links country of control information derived at the legal entity level, with financial data compiled at the enterprise level from Industrial Organization and Finance Division’s (IOFD) Financial and Taxation Statistics for Enterprises program.
Country of control data
The country of control data are derived from ownership schedules filed annually with Statistics Canada by corporations liable under the Corporations Returns Act, and information obtained from the Canada Revenue Agency’s administrative records.
Statistics Canada collects ownership information from incorporated businesses in Canada whose gross revenues exceed $200 million, whose assets exceed $600 million or whose long-term debt or equity owing to non-residents exceeds a book value of $1 million. This information is used to establish links between parent corporations and their subsidiaries, to define corporate ownership structures, and to determine the ultimate country of control for each corporate structure. The ownership information is supplemented by research based on other publicly available sources which include web sites, gazettes, press clippings, as well as federal and provincial business registries.
Statistics Canada relies on information from Canada Revenue Agency administrative records to determine the country of control for corporations whose assets, revenues and equity or debt are below the thresholds for collection of ownership data. These businesses tend to have a simple corporate structure and are, for the most part, Canadian-controlled. These administrative records are maintained on Statistics Canada’s Business Register.
Financial data
The IOFD Financial and Taxation Statistics for Enterprises program combined three sources of financial data to form a census of the 1,905,150 enterprises in the target population for 2018. Annualized data from IOFD’s Quarterly Survey of Financial Statements (QFS) provided consolidated data for 4,455 of the largest enterprises. Public Sector Statistics Division supplied data for 116 provincial and federal level government business enterprises. Data Stewardship Division supplied financial information for the remaining enterprises from T2 Corporation Income Tax Returns and the General Index of Financial Information (GIFI).
Reference period
The series in this report are intended to cover business activity within a calendar reference period. Data derived from the QFS approximate the calendar period. The GBE data reflect fiscal periods which often are governed by the April to March fiscal year of governments. The administrative data used from the Canada Revenue Agency are based on financial statements filed along with annual income tax returns by corporations. Historically, data from fiscal periods ending at any time between January and December were included in the reference year. However, beginning with the release of the 2004 data, data from income tax returns for fiscal periods ending between April and March have been included in order to better represent business activity in the calendar period.
Edit and imputation
At the record level, several checks are performed on the financial data to verify internal consistency and identify extreme values. Checks are also performed to ensure that financial data records have been assigned a country of control code and that this information is accurate.
Imputation of the financial data for complete non-response is performed by two methods. The preferred and most common method makes use of historical information about the non-responding unit and current trends in the principal characteristics of similar units. When historical information is not available, such as in the case of new units, a donor of similar size and industry is substituted for the missing unit.
Annual changes in the tabulated financial data are reviewed by industry and country of control. The largest changes are investigated and updates are made to the financial and country of control data as required. In addition, these data are analyzed for comparability with trends in related Statistics Canada data series and with general trends in the economy.
Estimation
As noted earlier, annual data are obtained from one of three sources for each enterprise in the population of interest. Estimates are derived by tabulating the enterprise data for this population. These estimates are produced and published by industry and country of control.
Due to certain financial reporting constraints, data for enterprises in the insurance industry could not be obtained through the administrative data source. As a result, estimates for this industry are derived using QFS weighted estimates.
Confidentiality
The confidentiality of the financial statistics is protected under the provisions of the Statistics Act.
For this reason, these data are released in aggregate form only and are subject to various confidentiality checks before they are released to prevent the publication or disclosure of any information deemed confidential. If necessary, data are suppressed to prevent direct or residual disclosure of identifiable data.
Direct disclosure could occur when the value in a tabulated cell is composed of only a few respondents or when the cell is dominated by a few companies. Residual disclosure could occur when confidential information can be derived indirectly by piecing together information from different sources or data series.
Data accuracy
While considerable effort is made to ensure high standards throughout all collection and processing operations, the resulting estimates are inevitably subject to a certain degree of error. There are two types of errors in statistical information: sampling and non-sampling. Non-sampling errors are the only type that applies to this program, given that the estimates are based on a census of the population, and not a sample (with the exception of the insurance industry).
Non-sampling errors can arise from a variety of sources and are difficult to measure. Among non-sampling errors are response errors, such as gaps in the information provided by corporations in their returns, and errors in processing, such as miscoding the industry of an enterprise.
Revisions
The most recent annual data in this report are subject to a one-year revision policy. These data may be revised to include amended information or reports from respondents that are received after the end of a collection cycle.
Key indicators
Total assets are the sum total of economic resources over which an enterprise exercises a certain control. They include cash and deposits; accounts receivable and accrued revenue; inventories; investments and accounts with parents, subsidiaries and affiliates; portfolio investments; loans given to other enterprises; and capital assets.
Operating revenues include revenues from the sales of goods and services; rental and operating lease revenues; and revenues from commissions, franchise fees, and royalties.
Operating expenses include the cost of goods and services used as inputs into production; wages and salaries; employer portion of employee benefits; indirect taxes; and depreciation, amortization and depletion of buildings, machinery and natural resources.
Operating profits are the difference between operating revenues and operating expenses.
Key concepts
Statistical Enterprise
An enterprise is a single corporation or a family of corporations under common ownership and/or control, for which consolidated financial statements are produced.
Controlling Interest
The controlling interest of an enterprise, referred to as the enterprise head, may be an individual, a related group, a corporation or a government. Controlled corporations are called subsidiaries. A multi-corporation enterprise contains one or more subsidiaries. A corporation that is not controlled by another corporation and that does not control another corporation is called a single-corporation enterprise.
Corporate control
Corporate control is the potential to affect the corporate strategic decision-making process of the board of directors of a corporation. In many cases where control is said to exist, corporations may still function with considerable autonomy in their financial, marketing, or operational activities. Majority control is exercised by a person, group or corporation if more than 50% of the voting equity of a corporation is held, directly or indirectly, other than by way of security only, by or for the benefit of that person, group or corporation. In the case of irrevocable options or the right to acquire shares, the calculation of the voting equity is made as if all options have been exercised.
Effective control of a corporation implies control of the corporation through methods other than ownership of the majority voting equity of the corporation. The assessment of effective control may be based on any of the following rules:
- If more than 50% of the directors of a corporation are also directors of a trust or an estate, or are also members of a related group, then the corporation is effectively controlled by that trust, estate or related group.
- If more than 50% of the directors of a corporation are also directors of another corporation, and if there is a significant voting ownership of the corporation by that other corporation, then the corporation is effectively controlled by that other corporation.
- If control is acknowledged by a corporation, then the acknowledgement is sufficient to assign effective control.
Country of control
In most cases of foreign control, the country of control is the country of residence of the ultimate foreign controlling parent corporation, family, trust, estate or related group. Each subsidiary within the global enterprise is assigned the same country of control as its parent. A company whose voting rights are equally owned by Canadian-controlled and foreign-controlled corporations, is Canadian-controlled. If two foreign-controlled corporations jointly own an equal amount of the voting rights of a Canadian resident company, the country of control is assigned according to an order of precedence based on their aggregate level of foreign control in Canada. For example, United States takes precedence over all other foreign countries because it has the highest level of aggregate foreign control in Canada.
Changes affecting historical comparability of data
Listed below are summaries of the main changes in coverage, classification, concepts and methods since reference year 1999 which may affect the comparability of the Corporations Returns Act data over time. The year associated with each change indicates the reference year of data to which the change was first applied.
2017 Implementation of SCCAI 2016
Beginning with reference year 2017, data has been compiled by geographic macro-regions using the Standard Classification of Countries and Areas of Interest (SCCAI 2016) structure. The main impact is the addition of residual groupings for each macro-region which allows for more granularity of data rather than having one large Other Foreign category. The second impact is the discontinuation of the European Union as a grouping. Using a geography-based macro-region of Europe enables a more stable comparison over time. Data has been back cast to 2008 to allow a ten-year comparison under the new groupings.
2014 Change to the Corporations Returns Act Regulations
Beginning with reference year 2014, the reporting thresholds requiring corporations to file returns under the Corporations Returns Act were revised. As prescribed in the Regulations, the new thresholds are as follows: gross revenues exceeding $200 million, assets exceeding $600 million or foreign equity exceeding a book value of $1 million. The impact on the levels of foreign control reported in this publication is minimal.
2013 Methodology note
Program estimates include only units that have been assigned a valid NAICS code on Statistics Canada’s Business Register database. Starting with the release of data for reference year 2013, many units that had previously not been assigned to an industry were added to the database, using NAICS codes they supplied with their tax returns. These consisted of mostly smaller units that had not previously been classified on the Business Register. This change resulted in a significant increase in the number of enterprises covered by the program.
2013 Change in definition of European Union
Beginning with reference year 2013, statistics for the European Union (EU) cover 28 countries, reflecting the addition of Croatia. Data for this country were previously included in estimates for the Other Foreign country of control category.
2011 Introduction of NAICS 2012
Beginning with reference year 2011, statistics by industry have been compiled based on the 2012 North American Industry Classification System (NAICS). The data are published at an aggregate level such that there is no effect on historical comparability.
2007 Change in definition of European Union
Beginning with reference year 2007, statistics for the European Union (EU) cover 27 countries, reflecting the addition of Bulgaria and Romania. Data for these countries were previously included in estimates for the Other Foreign country of control category.
2006 Introduction of NAICS 2007
Beginning with reference year 2006, statistics by industry have been compiled based on the 2007 North American Industry Classification System (NAICS). Data for reference years 1999 to 2005 were revised in order to reflect this classification system.
2006 Refinement of Country of Control Concept
For reference year 2006, the country of control was assigned to enterprises based on the country of residence of their ultimate, controlling parent, rather than based on the country which has majority ownership of the enterprise's voting shares. When the preliminary 2006 data were released, data for reference years 1999 to 2005 were revised to reflect the new country of control method, technical improvements and late returns.
The use of the new country of control method for the 1999 to 2005 data resulted in a small increase in the level of Canadian-controlled assets when compared with statistics for the same years based on the previous method. On average, over the 1999 to 2005 period, Canadian-controlled assets were 1.9% higher under the new method compared with the old method.
2004 Change in definition of European Union
Beginning with reference year 2004, statistics for the European Union (EU) cover 25 countries, reflecting the addition of the following ten countries to the EU: Czech Republic, Cyprus, Estonia, Hungary, Latvia, Lithuania, Malta, Poland, Slovakia and Slovenia. Prior to reference year 2004, the EU included the following countries: Austria, Belgium, Denmark, Finland, France, Germany, Greece, Italy, Ireland, Luxembourg, the Netherlands, Portugal, Spain, Sweden and the United Kingdom.
2003 Introduction of NAICS 2002
Beginning with reference year 2003, statistics by industry were compiled based on the 2002 North American Industry Classification System (NAICS). Data for reference years 1999 to 2002 were revised in order to reflect this classification system.
1999 Introduction of NAICS 1997
Starting with reference year 1999, statistics by industry were compiled based on the 1997 North American Industry Classification System (NAICS 1997). For reference periods 1988 to 1998 inclusive, the statistics were compiled based on the Standard Industrial Classification for Companies and Enterprises (SIC-C 1980). Prior to 1988, the 1960 Standard Industrial Classification for Establishments was used.
1997 Change to Corporations Returns Act
The Corporations Returns Act was formerly known as the Corporations and Labour Unions Returns Act (CALURA). The original CALURA was first introduced in 1962 and Statistics Canada has prepared annual reports to Parliament since that time. Parliament officially amended the Act as of January 1999, deleting the requirement of labour unions to report under the Act.
Related Products
Selected data tables from Statistics Canada
Selected publications from Statistics Canada
Selected survey programs from Statistics Canada
- Date modified: