
Housing Statistics in Canada
Housing Experiences in Canada: Renters who are in poverty, seniors and recent immigrants, 2021
Skip to text
Text begins
Highlights
- Data from the 2021 Census offer an opportunity to provide an update on the housing experiences of renters living in poverty, senior renters and recent immigrant renters since the last census in 2016.
- In 2021, core housing need remained an important issue for renters living in poverty (58.6%), as the proportion of individuals who lived in core housing need was over triple the rate for the total renter population (17.2%).
- At the same time, the core housing need rate decreased for renters living in poverty, from 64.5% in 2016 to 58.6% in 2021.
- While senior renters aged 65 and older experienced a similar decrease in the unaffordable housing rate compared with the total renter population, the rate remained high in 2021, at 38.8%.
- Recent immigrant renters continued to live in crowded conditions, at a rate of 37.8%, which was much higher than the rate of the total renter population (18.9%). Concurrently, this group of renters saw a decline in the unsuitable housing rate from 41.4% to 37.8%.
Introduction
In today’s evolving housing system, it is important to understand the progressive realization of the human right to adequate housing faced by different population groups across Canada.Note To improve this understanding, the Housing Experiences in Canada fact sheets, first released in November 2021, were developed in partnership with the Office of the Federal Housing Advocate, based in the Canadian Human Rights Commission. This fact sheet uses 2021 Census data to provide an update on housing experiences faced by renters living in poverty, senior renters aged 65 and older, and recent immigrant renters since the last census in 2016.Note Note It evaluates changes in the rates of housing indicators such as core housing need, unaffordable housing, unsuitable housing and dwellings requiring major repairs for these population groups, where significant differences with the total renter population were observed.
In 2021, renters living in poverty were over three times as likely to live in core housing need, compared with all renters
Among the population groups studied in the Housing Experiences in Canada series, renters living in poverty were the most likely to live in core housing need, with 64.5% of renters in poverty living in core housing need in 2016.Note Core housing need refers to whether an individual’s housing falls below at least one of the indicator thresholds for housing adequacy, affordability or suitability, and they would have to spend 30% or more of total before‑tax income to pay the median rent of alternative local housing that is acceptable (attains all three housing indicator thresholds).
Data from the 2021 Census revealed a decrease in the core housing need rate for renters in poverty, falling 5.9 percentage points from 64.5% in 2016 to 58.6% in 2021.
The decrease was mainly driven by improvements in housing affordability for renters in poverty in 2021. The unaffordable housing rate for renters living in poverty declined from 71.1% in 2016 to 69.2% in 2021. The rate of dwellings in need of major repairs also declined, from 10.0% in 2016 to 8.2% in 2021. The unsuitable housing rate remained relatively unchanged over the same period.
The decrease in the core housing need rate occurred at the same time as temporary increases in government transfers in response to the COVID-19 pandemic. Household incomes grew faster than shelter costs, creating the conditions for improved housing affordability.Note
The increase in government transfers also lifted people out of poverty in the short term, especially those who were living near the poverty line, leading to a decrease in the total number of renters in poverty in 2020. Renters may also have moved into and out of poverty for other reasons, such as an increase in income or change in employment status, contributing to the decline in the core housing need rate for this population in 2021.
While the 5.9 percentage point decrease in the core housing need rate indicates some improvement in the housing experience of renters in poverty, the improvement was larger for the total population of renters. This group saw its core housing need rate decrease by 8.1 percentage points from 25.3% in 2016 to 17.2% in 2021.

Data table for Chart 1
| 2016 | 2021 | |
|---|---|---|
| percent of population living in rented dwellings | ||
| People in poverty | 62.7 | 63.3 |
| Recent immigrants | 56.7 | 56.9 |
| Total population | 26.7 | 27.9 |
| Seniors aged 65 years and older | 20.8 | 21.5 |
| Sources: Statistics Canada, Census of Population, 2016 and 2021. | ||

Data table for Chart 2
| 2016 | 2021 | |
|---|---|---|
| percent of renter population living in core housing need | ||
| People in poverty | 64.5 | 58.6 |
| Seniors aged 65 years and older | 28.6 | 22.4 |
| Recent immigrants | 33.1 | 19.6 |
| Total population | 25.3 | 17.2 |
| Sources: Statistics Canada, Census of Population, 2016 and 2021. | ||
Housing affordability challenges remain for senior renters, despite a decrease in the unaffordable housing rate in 2021
In 2021, the number of seniors aged 65 and older rose 18.3% to 7.0 million, which was the second-largest increase in 75 years.Note In comparison, the total population grew by 5.2% over the same period.Note Just over one in five seniors living in private dwellings, or 21.5%, lived in rented dwellings.
In 2016, senior renters had one of the highest unaffordable housing rates, at 45.4%, and by 2021, the unaffordable housing rate for senior renters (38.8%) had declined by 6.6 percentage points. This was less than the decrease in the unaffordable housing rate for the total renter population (-7.3 percentage points) over the same period.
Temporary government transfers in response to the COVID-19 pandemic also helped eligible senior renters. While younger Canadians most often received the top-up to the goods and services tax / harmonized sales tax (GST/HST) credit and the Canada Emergency Response Benefit (CERB), seniors most often received top-ups to the GST/HST rebate, Old Age Security and the Guaranteed Income Supplement.Note These top-up payments, while smaller than CERB payments, helped lift seniors who were close to paying 30% or more of their income for housing above the unaffordable housing threshold.
Despite the decrease in the unaffordable housing rate in 2021, senior renters continued to deal with unaffordable housing at a higher rate than the total renter population (38.8% versus 27.2%, respectively). In 2022, rather than adding to their household savings, seniors aged 65 years and older drew a net average of $19,090 (current dollars) from their household savings. This suggests that reserving part of one’s monthly budget for savings is less necessary at these ages compared with younger generations, making a larger proportion available for housing.
Similarly, the core housing need rate for senior renters (22.4%) remained higher than that of the total renter population (17.2%) in 2021, despite decreasing 6.2 percentage points from 28.6% in 2016. By comparison, the rate for the total renter population decreased 8.1 percentage points from 25.3% in 2016. While this indicates some improvement in the housing experiences of senior renters since 2016, the gap with the total renter population increased.

Data table for Chart 3
| 2016 | 2021 | |
|---|---|---|
| percent of renter population spending 30% or more of income on shelter costs | ||
| People in poverty | 71.1 | 69.2 |
| Seniors aged 65 years and older | 45.4 | 38.8 |
| Recent immigrants | 40.7 | 28.3 |
| Total population | 34.5 | 27.2 |
| Sources: Statistics Canada, Census of Population, 2016 and 2021. | ||
Recent immigrant renters in 2021 were less likely to live in crowded housing
From 2016 to 2021, Canada received the highest number of recent immigrants ever recorded in a Canadian census (1,328,240 recent immigrants).Note Of these recent immigrants, 56.9% lived in rented dwellings.
Crowding is an important issue for recent immigrant renters, who had one of the highest rates of unsuitable housing (37.8%) in 2021, according to the National Occupancy Standard. Compared with 2016, the proportion of recent immigrant renters living in crowded housing conditions (41.4%) declined 3.6 percentage points.
The unsuitable housing rate increased for the total renter population in 2021 (+1.1 percentage points since 2016), leading to a smaller gap between the rates of unsuitable housing of recent immigrant renters and the total renter population in 2021. Despite this, the unsuitable housing rate for recent immigrant renters remained twice as high, compared with the total renter population (18.9%).
For recent immigrant renters, the decrease in the unsuitable housing rate occurred simultaneously with more recent immigrants settling in Atlantic Canada and in the Ottawa–Gatineau and Kitchener–Cambridge–Waterloo census metropolitan areas (CMAs) in 2021, where unsuitable housing rates tend to be lower than in Canada’s three largest CMAs (Toronto, Montréal and Vancouver).
Changes in household living arrangements were also observed for recent immigrant renters in 2021. Compared to recent immigrant renters in 2016, the percentage of recent immigrant renters living in couple families with children decreased (from 54.1% in 2016 to 50.0% in 2021), along with multiple family households (from 5.3% in 2016 to 3.9% in 2021). More recent immigrant renters (8.6%) lived in two-or-more-person non-census-family households in 2021 compared with 2016 (6.2%).
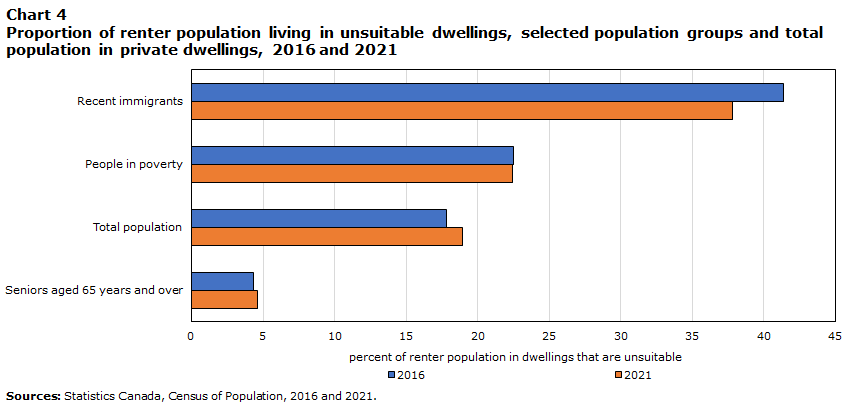
Data table for Chart 4
| 2016 | 2021 | |
|---|---|---|
| percent of renter population in dwellings that are unsuitable | ||
| Recent immigrants | 41.4 | 37.8 |
| People in poverty | 22.5 | 22.4 |
| Total population | 17.8 | 18.9 |
| Seniors aged 65 years and over | 4.3 | 4.6 |
| Sources: Statistics Canada, Census of Population, 2016 and 2021. | ||
Looking ahead
It is important to note that increases in government transfers in response to the COVID-19 pandemic were temporary, and most temporary income support programs were phased out by the fall of 2021 as economic activity resumed. While these transfers helped to increase incomes and reduce the poverty rate, recent data have shown that the poverty rate increased in 2021. Whether people in poverty and senior renters can retain the reductions in unaffordable and core housing need rates will depend on the evolution of factors such as incomes, housing costs, interest rates, inflation and employment in the years to come.
More data on the population groups featured in the Housing Experiences in Canada series are available through the 2021 Census of Population data tables.
- Date modified: