
Canada's Official Poverty Dashboard of Indicators: Trends, May 2023

Archived Content
Information identified as archived is provided for reference, research or recordkeeping purposes. It is not subject to the Government of Canada Web Standards and has not been altered or updated since it was archived. Please "contact us" to request a format other than those available.
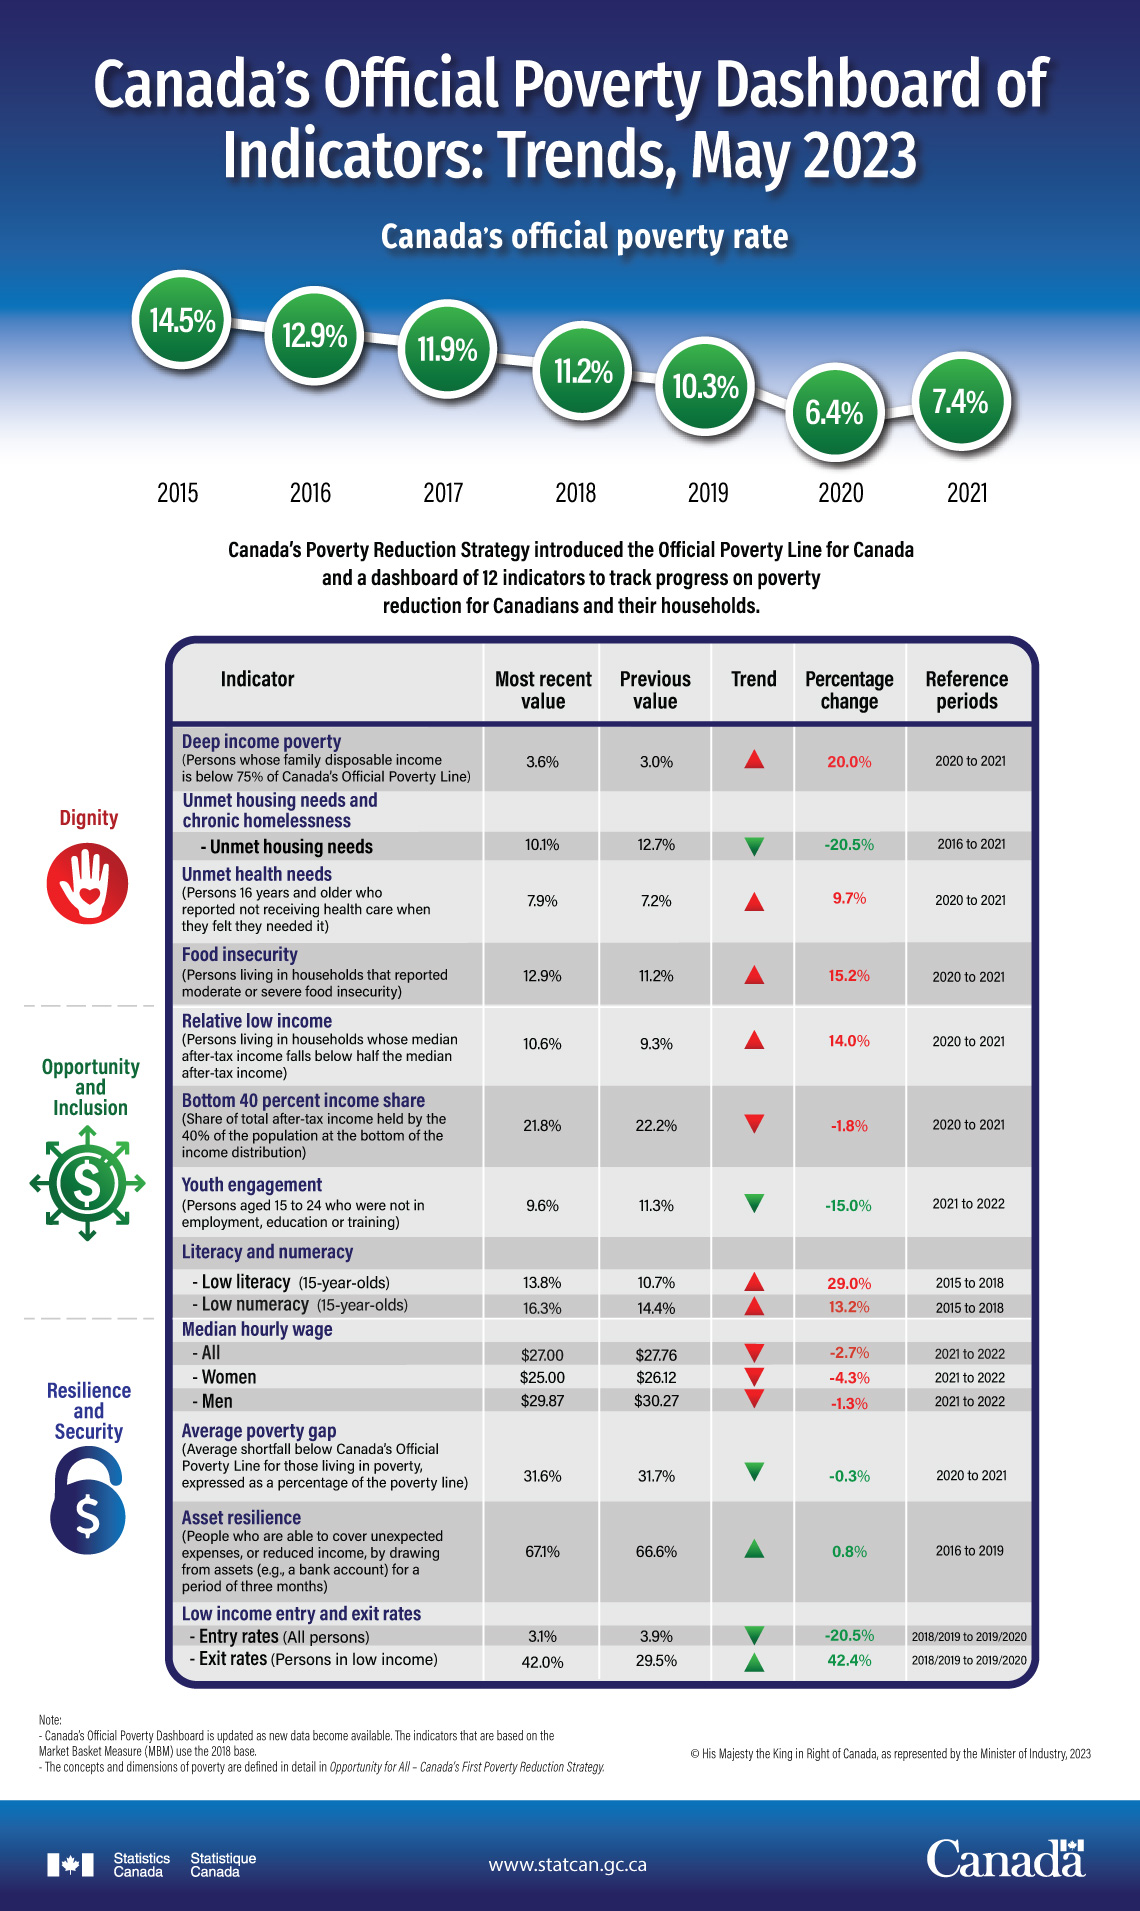
Description: Canada's Official Poverty Dashboard of Indicators: Trends, May 2023
| Year | Rate |
|---|---|
| 2015 | 14.5 |
| 2016 | 12.9 |
| 2017 | 11.9 |
| 2018 | 11.2 |
| 2019 | 10.3 |
| 2020 | 6.4 |
| 2021 | 7.4 |
Canada’s Poverty Reduction Strategy introduced the Official Poverty Line for Canada and dashboard of 12 Indicators to track progress on poverty reduction for Canadians and their households.
| Indicator | Most recent value | Previous value | Trend | Percentage change | Reference periods |
|---|---|---|---|---|---|
| Dignity | |||||
| Deep income poverty (Persons whose family disposable income is below 75% of Canada's Official Poverty Line) | 3.60% | 3.00% | Up | 20.00% | 2020 to 2021 |
| Unmet housing needs and chronic homelessness - Unmet housing needs | 10.10% | 12.70% | Down | -20.50% | 2016 to 2021 |
| Unmet health needs (Persons 16 years and older who reported not receiving health care when they felt they needed it) | 7.90% | 7.20% | Up | 9.70% | 2020 to 2021 |
| Food insecurity (Persons living in households that reported moderate or severe food insecurity) | 12.90% | 11.20% | Up | 15.20% | 2020 to 2021 |
| Opportunity and Inclusion | |||||
| Relative low income (Persons living in households whose median after-tax income falls below half the median after-tax income) | 10.60% | 9.30% | Up | 14.00% | 2020 to 2021 |
| Bottom 40 percent income share (Share of total after-tax income held by the 40% of the population at the bottom of the income distribution) | 21.80% | 22.20% | Down | -1.80% | 2020 to 2021 |
| Youth engagement (Persons aged 15 to 24 who were not in employment, education or training) | 9.60% | 11.30% | Down | -15.00% | 2021 to 2022 |
| Literacy and numeracy - Low literacy (15-year-olds) | 13.80% | 10.70% | Up | 29.00% | 2015 to 2018 |
| Literacy and numeracy - Low numeracy (15-year-olds) | 16.30% | 14.40% | Up | 13.20% | 2015 to 2018 |
| Resilience and Security | |||||
| Median hourly wage - All | $27.00 | $27.76 | Down | -2.70% | 2021 to 2022 |
| Median hourly wage - Women | $25.00 | $26.12 | Down | -4.30% | 2021 to 2022 |
| Median hourly wage - Men | $29.87 | $30.27 | Down | -1.30% | 2021 to 2022 |
| Average poverty gap (Average shortfall below Canada’s Official Poverty Line for those living in poverty, expressed as a percentage of the poverty line) | 31.6% | 31.70% | Down | -0.30% | 2020 to 2021 |
| Asset resilience (People who are able to cover unexpected expenses, or reduced income, by drawing from assets (e.g., a bank account) for a period of three months) | 67.1% | 66.60% | Up | 0.80% | 2016 to 2019 |
| Low income entry and exit rates - Entry rates (All persons) | 3.1% | 3.90% | Down | -20.50% | 2018/2019 to 2019/2020 |
| Low income entry and exit rates - Exit rates (Persons in low income) | 42.0% | 29.50% | Up | 42.40% | 2018/2019 to 2019/2020 |
Note:
- Canada’s Official Poverty Dashboard is updated as new data become available. The indicators that are based on the Market Basket Measure (MBM) use the 2018 base.
- The concepts and dimensions of poverty are defined in detail in Opportunity for All – Canada's First Poverty Reduction Strategy.
- Date modified: