
 StatCan COVID-19: Data to Insights for a Better Canada Canadian aviation amid the COVID-19 pandemic: Part 3. International comparison
Text begins
Introduction
The COVID-19 pandemic has caused an unprecedented disruption to aviation. Air transportation is all about connecting the world through the movement of people and goods. At the start of the pandemic, the movement of people by air was essentially stopped by public health measures and travel restrictions implemented around the world to combat the spread of the virus. In response, airlines grounded their fleets and laid off employees. While passenger numbers and revenues both dwindled, high fixed costs remained, resulting in financial losses. A number of airlines around the world had to file bankruptcy, while others have been kept on financial life support from governments.
Beyond the airlines, the pandemic touched every aspect of aviation. For instance, airports and air navigation service providers lost revenue as the number of passengers and flights decreased. Flight training units in many countries, including Canada, were closed for a period of time as “non-essential” businesses. General aviation activity declined as people were asked to stay home.
This is the third in a series of articles that examines the impact of COVID-19 on aviation in Canada and looks for signs of recovery up to the end of 2021. The first article examined the impact on Canada’s large and medium air carriers and found that passenger airlines bore the brunt of this impact, while the increased demand for air cargo was insufficient to offset this decline. The second article focused on the impacts across various types of flying activities and compared their speed of recovery, finding that those such as general aviation, flight training, aerial work and smaller air carriers were able to recover faster than the larger airlines. This third article puts Canada into an international context with a focus on airlines and finds that Canada had the most sluggish recovery among countries with the largest land mass until mid-2021 but then recovered to position itself in the middle by the end of the year.
Results
Canada’s recovery starts slow before picking up
The largest countries in the world by area are Russia, Canada, USA, China, Brazil and AustraliaNote . Having a large area makes air transportation a necessity. Due to this commonality, this article will compare the impact of and recovery from the pandemic for airlines in Canada to these five other large countries.
Chart 1 shows the percentage changes from the same month of 2019 in the total number of passengers for the six largest countries by area. China was the first to see a large decline, in February 2020. Other countries followed in March, with Australia, Canada and the United States recording more than 96% declines in April 2020. China had the smallest decline among the countries examined (85% in February 2020) and began recovering thereafter.

Data table for Chart 1
| Canada | Australia | Brazil | China | Russia | United States | |
|---|---|---|---|---|---|---|
| percentage change from same month of 2019 | ||||||
| 2020 | ||||||
| January | 3.1 | 1.0 | 2.0 | -5.3 | 6.8 | 5.6 |
| February | 4.2 | -3.2 | 2.2 | -84.5 | 6.5 | 6.7 |
| March | -43.8 | -40.4 | -36.8 | -71.1 | -28.1 | -51.3 |
| April | -97.0 | -97.7 | -95.2 | -68.5 | -92.1 | -96.1 |
| May | -96.7 | -97.0 | -93.4 | -52.6 | -91.3 | -90.1 |
| June | -93.8 | -93.4 | -89.2 | -42.4 | -77.4 | -80.3 |
| July | -89.3 | -89.0 | -84.1 | -34.1 | -52.4 | -72.3 |
| August | -86.6 | -90.9 | -76.7 | -24.6 | -35.4 | -69.2 |
| September | -86.5 | -89.0 | -67.0 | -12.5 | -31.7 | -65.2 |
| October | -86.6 | -86.7 | -58.2 | -11.7 | -39.0 | -61.8 |
| November | -87.3 | -82.6 | -49.1 | -16.3 | -47.9 | -60.6 |
| December | -87.0 | -66.6 | -44.6 | -19.8 | -42.5 | -61.5 |
| 2021 | ||||||
| January | -88.4 | -74.0 | -42.9 | -43.6 | -33.9 | -59.3 |
| February | -92.8 | -70.6 | -52.0 | -55.5 | -33.3 | -58.1 |
| March | -93.2 | -54.6 | -65.3 | -8.8 | -27.2 | -46.6 |
| April | -92.6 | -44.0 | -69.6 | -3.8 | -23.3 | -37.4 |
| May | -92.5 | -42.4 | -57.5 | -6.3 | -19.6 | -29.1 |
| June | -88.3 | -58.5 | -49.7 | -22.7 | -11.9 | -21.1 |
| July | -75.0 | -79.3 | -42.2 | -17.2 | -7.3 | -15.1 |
| August | -60.7 | -88.6 | -40.2 | -63.4 | -3.3 | -20.0 |
| September | -57.5 | -84.3 | -34.6 | -34.1 | -3.8 | -19.0 |
| October | -52.7 | -84.7 | -31.7 | -31.8 | -1.3 | -16.2 |
| November | -48.5 | -76.1 | -23.3 | -59.5 | -8.3 | -10.0 |
| December | -45.2 | -60.2 | -20.7 | -48.7 | -7.4 | -16.0 |
| Sources: Statistical agencies or aviation regulators of the countries, see references. | ||||||
The paths to recovery have diverged among countries. Initially for example, Canada had the most sluggish recovery, remaining 88% below pre-pandemic levels as of June 2021. While Australia also had a slow start to recovery, from November 2020 until June 2021 passenger numbers there reached higher proportions relative to pre-pandemic levels than in Canada. This trend reversed beginning in July 2021 as Australia introduced new lockdowns while Canada began relaxing restrictions.
China and Russia had the strongest recoveries initially. Both were subsequently affected by new waves of infections, resulting in passenger numbers dipping at certain points in time. In China, the impact of strict lockdowns can be observed in the large fluctuations.
Until July 2021 and except for December 2020, the United States had the steadiest recovery among these countries as percentage declines from 2019 were getting smaller every month. In the second half of 2021, however, the recovery in the US stagnated.
By December 2021, Russia (-7%), the United States (-16%) and Brazil (-21%) had the smallest declines from the same month of 2019. Australia (-60%) had the largest decline among the large countries while, at -45%, Canada was in the middle, a significant improvement from early 2021.
Domestic market size has limited impact
During the pandemic, international travel was more restricted than domestic travel and, as shown in the first article, the declines in the domestic sector were smaller than in the transborder and other international sectors. All else being equal, it would be expected that if the domestic sector accounts for a larger share of the total number of passengers, the overall declines would be smaller. It will now be examined whether Canada’s domestic market share can explain why before mid-2021 its total passenger counts continued to experience some of the largest declines.
Chart 2 shows passengers on domestic routes as a percentage of total passengers in 2019, 2020 and 2021. In 2019, pre-pandemic, China (89%) and the United States (88%) had the largest shares. Canada had the lowest share (52%), followed by Russia (57%). While in Canada and in Russia the domestic sector represented less than 60% of the total passengers, in the other four countries this percentage was above or very close to 80%. Therefore, the closest comparison to Canada in terms of domestic market share is Russia. Moreover, there are geographic similarities between the two countries: large area with many remote regions, sparsely-settled population outside major urban centres, small population size for the amount of land mass, and northern climate.

Data table for Chart 2
| 2019 | 2020 | 2021 | |
|---|---|---|---|
| percent | |||
| Australia | 81.5 | 86.9 | 98.9 |
| Brazil | 79.8 | 87.0 | 92.9 |
| Canada | 51.5 | 56.4 | 70.1 |
| China | 88.5 | 94.3 | 99.7 |
| Russia | 57.0 | 81.1 | 78.8 |
| United States | 87.6 | 90.8 | 91.0 |
| Sources: Statistical agencies or aviation regulators of the countries, see references. | |||
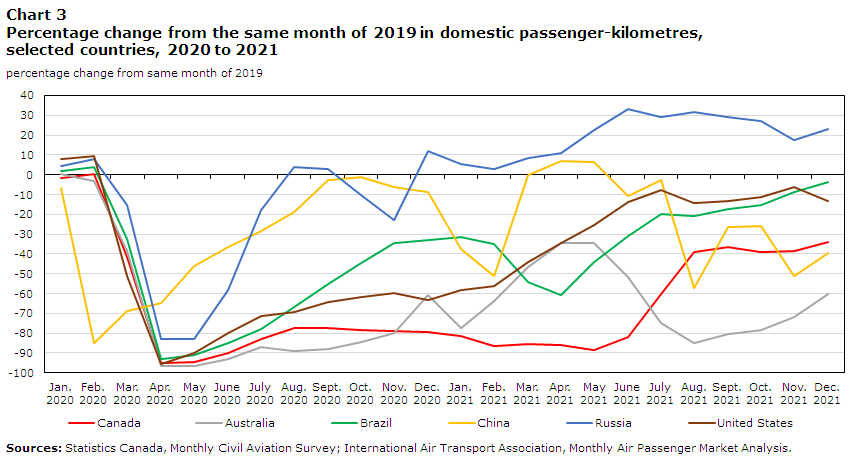
Despite these similarities, Russia had a much stronger recovery than what was observed in Canada. The number of domestic passengers as a percentage of total passengers in Russia increased significantly from 57% in 2019 to around 80% in 2020 and 2021. While some people opted not to travel at all in 2020, others appeared to have undertaken domestic trips instead of travelling abroad. In 2021, the number of passengers on domestic flights in Russia was above pre-pandemic levels (Chart 3), implying such a substitution. Canada did not experience this to the same extent, as the number of passengers in the domestic sector remained well below 2019 levels in 2021. In 2020, the share of the domestic sector (56%) in Canada was slightly above that of 2019 (52%) before increasing to 70% in 2021.
Moreover, while Brazil and the United States have larger domestic markets than Russia, their recovery was not as swift. Australia has a noticeably larger domestic share than Canada, but both experienced similarly stagnant recoveries until November 2020, and in the second half of 2021 Australian airlines’ recovery dipped below Canada’s. Therefore, the size of the domestic market as a share of the total before the pandemic is not enough to explain the speed of recovery.
If the size of the domestic market explains the differences in overall recovery, then the recoveries in the domestic sector on its own should be similar in different countries. Chart 3 combines data from Statistics Canada’s Monthly Civil Aviation Survey for Canada and data from the International Air Transport Association (IATA) for the other countries. It shows the percentage change in domestic passenger-kilometres when compared to the same month of 2019. Passenger-kilometres are used instead of passengers due to data availability.
Data table for Chart 3
| Canada | Australia | Brazil | China | Russia | United States | |
|---|---|---|---|---|---|---|
| percentage change from same month of 2019 | ||||||
| 2020 | ||||||
| January | -1.9 | 0.5 | 2.1 | -6.8 | 4.3 | 8.0 |
| February | 0.4 | -3.3 | 3.8 | -84.8 | 7.7 | 9.5 |
| March | -41.4 | -38.7 | -32.2 | -68.7 | -15.4 | -51.1 |
| April | -94.8 | -96.4 | -93.1 | -64.6 | -82.7 | -95.6 |
| May | -94.6 | -96.4 | -91.1 | -46.3 | -82.7 | -89.8 |
| June | -90.0 | -93.2 | -84.9 | -36.5 | -58.0 | -80.0 |
| July | -82.9 | -87.1 | -77.7 | -28.4 | -17.8 | -71.5 |
| August | -77.3 | -88.8 | -67.0 | -18.8 | 3.8 | -69.4 |
| September | -77.2 | -88.1 | -55.3 | -2.8 | 2.7 | -64.2 |
| October | -78.2 | -84.4 | -44.5 | -1.4 | -10.0 | -61.5 |
| November | -78.8 | -80.0 | -34.5 | -6.3 | -23.0 | -59.6 |
| December | -79.2 | -60.8 | -33.0 | -8.5 | 12.0 | -63.2 |
| 2021 | ||||||
| January | -81.2 | -77.3 | -31.4 | -37.5 | 5.5 | -58.4 |
| February | -86.5 | -64.0 | -34.9 | -51.2 | 2.9 | -56.2 |
| March | -85.6 | -46.6 | -54.0 | 0.0 | 8.5 | -43.9 |
| April | -86.2 | -34.4 | -60.9 | 6.8 | 11.0 | -34.5 |
| May | -88.5 | -34.7 | -44.0 | 6.3 | 22.6 | -25.4 |
| June | -82.0 | -51.4 | -31.1 | -10.8 | 33.0 | -14.0 |
| July | -60.4 | -74.8 | -19.6 | -2.5 | 28.9 | -7.6 |
| August | -38.9 | -84.8 | -20.7 | -57.0 | 31.9 | -14.1 |
| September | -36.7 | -80.3 | -17.3 | -26.2 | 29.3 | -13.1 |
| October | -38.8 | -78.5 | -15.4 | -25.7 | 27.0 | -11.1 |
| November | -38.6 | -71.6 | -8.5 | -50.9 | 17.5 | -6.2 |
| December | -34.2 | -60.4 | -3.8 | -39.6 | 23.2 | -13.1 |
| Sources: Statistics Canada, Monthly Civil Aviation Survey; International Air Transport Association, Monthly Air Passenger Market Analysis. | ||||||
The general trends seen for domestic passenger-kilometres in chart 3 resemble those for total passengers in chart 1. Canada had little recovery before improving in the summer of 2021, while China and Russia reached pre-pandemic levels and above in the domestic sector in certain months. Increases as high as 33% (June 2021) over pre-pandemic levels in Russia show a strong substitution from international travel to domestic travel, while Canada’s domestic traffic was still down 82% from 2019 levels in June 2021, before the improvement of the second half of the year. As Canada’s domestic travel increased, by December 2021 it then recovered to a higher proportion relative to pre-pandemic levels than in Australia and China, where recovery had reversed amid lockdowns.
In summary, among the world’s largest countries by area, domestic market share does not explain the speed of air travel recovery. Rather, the recovery of the domestic market appears to be the driving force of the overall recovery, regardless of what proportion of passengers were domestic before the pandemic.
Stringency of restrictions plays a role
One of the factors that affected the number of people travelling were travel restrictions and other measures imposed by governments to combat the pandemic. The Oxford COVID-19 Government Response Tracker (OxCGRT) publishes the COVID stringency index which combines domestic and international travel restrictions with other measures, such as stay-at-home orders, school and workplace closures, restrictions on gatherings and events, etc.
This daily index was converted to a monthly index for the six countries (Chart 4). The index itself ranges from zero (0), which represents no restrictions, to one hundred (100), the strictest possible value.

Data table for Chart 4
| Canada | Australia | Brazil | China | Russia | United States | |
|---|---|---|---|---|---|---|
| COVID stringency index | ||||||
| 2020 | ||||||
| January | 0.9 | 1.3 | 0.5 | 21.6 | 0.5 | 0.0 |
| February | 2.8 | 19.1 | 5.6 | 77.0 | 8.3 | 5.4 |
| March | 39.9 | 38.6 | 44.0 | 79.5 | 41.9 | 45.8 |
| April | 74.7 | 71.1 | 75.0 | 60.2 | 85.5 | 72.7 |
| May | 72.8 | 67.4 | 80.5 | 74.7 | 80.7 | 72.7 |
| June | 70.3 | 55.0 | 77.3 | 78.5 | 70.5 | 70.7 |
| July | 67.6 | 69.8 | 80.0 | 78.2 | 65.2 | 68.3 |
| August | 66.9 | 75.1 | 72.0 | 78.2 | 59.5 | 67.1 |
| September | 64.3 | 74.7 | 69.2 | 60.1 | 39.0 | 64.2 |
| October | 65.1 | 67.2 | 62.7 | 63.1 | 45.8 | 64.1 |
| November | 70.0 | 63.9 | 56.1 | 69.5 | 46.2 | 69.6 |
| December | 72.7 | 66.0 | 63.8 | 79.1 | 47.7 | 71.9 |
| 2021 | ||||||
| January | 75.0 | 60.7 | 68.1 | 78.2 | 49.9 | 71.8 |
| February | 75.5 | 62.5 | 71.7 | 74.1 | 45.8 | 68.3 |
| March | 73.2 | 50.9 | 68.9 | 53.0 | 40.5 | 63.6 |
| April | 75.5 | 49.1 | 66.9 | 74.5 | 39.4 | 56.9 |
| May | 75.3 | 46.4 | 60.1 | 67.8 | 36.6 | 51.9 |
| June | 72.9 | 62.5 | 61.8 | 72.3 | 44.2 | 55.2 |
| July | 65.1 | 68.1 | 57.7 | 75.3 | 32.8 | 52.3 |
| August | 62.2 | 70.4 | 51.7 | 70.8 | 46.3 | 54.3 |
| September | 71.0 | 71.8 | 59.7 | 73.2 | 56.3 | 54.5 |
| October | 69.9 | 70.5 | 55.5 | 74.1 | 55.2 | 56.0 |
| November | 72.7 | 67.1 | 50.8 | 68.1 | 52.5 | 57.9 |
| December | 67.8 | 59.3 | 59.8 | 73.3 | 54.5 | 50.9 |
| Source: Oxford COVID-19 Government Response Tracker. | ||||||
In the first half of 2021, restrictions in Canada were some of the strictest, and its aviation’s recovery the slowest. Russia had the least strict restrictions among these countries for many months, and the recovery of aviation there was among the strongest. The United States had a gradual relaxation of restrictions and a steady increase in air passengers.
However, restrictions in China remained fairly strict even in those months when passenger numbers reached almost pre-pandemic levels, and the large fluctuations in air travel are not mirrored in the stringency index. One issue with the stringency index is that it is based on the jurisdictions with the strictest measures in each country. If one region in China has strict restrictions, for example, the index will be high, but at the same time people might be free to travel around the rest of the country.
This association does not imply causation however. Government measures and people’s desire to travel are both affected by confounding factors such as the number of new COVID-19 cases, vaccination rates and economic conditions. Moreover, the timing and intensity of the different waves of the virus vary across countries. Additionally, there are unmeasurable factors such as cultural differences between countries that can change over time.
In summary, while government restrictions did have an impact on air travel recovery, it was part of a complex interplay of many factors related to the pandemic.
Summary and conclusion
The COVID-19 pandemic was the biggest shock to aviation in history, and this article compared the impact on passenger air transportation in the six largest countries in the world by area as well as the road to recovery up to December 2021.
Canada’s recovery was amongst the slowest until mid-2021 but then passenger numbers strengthened by the end of the year. While the relative size of the domestic market appears to have had little bearing on the speed of recovery, the recovery and the fluctuations of the domestic market itself mirror the overall path in all six countries. Restrictions on travel and other activities are likely to have had more of an impact, but other pandemic-related factors, such as for example vaccination rates and general economic conditions, also played a role.
Data and methods
The selection of variables for this article was affected by the availability of data from different countries. The data are not seasonally adjusted, and percentage changes from the same month of 2019 in total passengers and domestic passenger-kilometres were used. The share of passengers in the domestic sector as a percentage of total passengers was calculated using annual values.
Data for Canada comes from Statistics Canada’s Monthly Civil Aviation Survey (monthly passengers and passenger-kilometres) and Quarterly Civil Aviation Survey (passengers by sector for the calculation of domestic passengers as a percentage of total passengers). Percentage changes in domestic passenger-kilometres for other countries were obtained from the International Air Transport Association's (IATA) monthly Air Passenger Market Analysis. Data on passenger numbers were obtained from national statistical agencies or aviation regulators of the countries examined (see references). These data were used to calculate percentage changes in total passengers from the corresponding months of 2019, and the domestic sector as a percentage of total passengers.
The stringency index was obtained from the Oxford COVID-19 Government Response Tracker (OxCGRT) and converted from a daily index to a monthly index by taking the average of the values for all the days in each month.
References
Australia:
Bureau of Infrastructure and Transport Research Economics (BITRE). Domestic Aviation Activity. https://www.bitre.gov.au/publications/ongoing/domestic_airline_activity-monthly_publications
Bureau of Infrastructure and Transport Research Economics (BITRE). International Airline Activity. https://www.bitre.gov.au/publications/ongoing/international_airline_activity-monthly_publications
Brazil:
National
Civil Aviation Agency (ANAC). Demand and supply of air transport. https://app.powerbi.com/view?r=eyJrIjoiM2UzMGE2ZmQtOTBkMy00ZjMzLTk2MjAtMWE0MDI0YzkzYjFiIiwidCI6ImI1NzQ4ZjZlLWI0YT
QtNGIyYi1hYjJhLWVmOTUyMjM2ODM2NiIsImMiOjR9
Canada:
Statistics Canada. Table 23-10-0079-01 Operating and financial statistics for major Canadian airlines, monthly. DOI: https://doi.org/10.25318/2310007901-eng
Statistics Canada. Table 23-10-0259-01 Civil aviation operating statistics, by sector, Canadian air carriers, Levels I and II, quarterly. DOI: https://doi.org/10.25318/2310025901-eng
China:
Civil Aviation Administration of China (CAAC). Statistics of key performance indicators for China’s civil aviation industry. http://www.caac.gov.cn/en/HYYJ/SJ/
Russia:
Federal State Statistics Service (Rosstat). Main indicators of carrying activity of transport, table Passengers carried by mode of transport. https://rosstat.gov.ru/statistics/transport
Federal Air Transport Agency (FAVT). Main performance indicators of civil aviation of Russia. http://favt.gov.ru/dejatelnost-vozdushnye-perevozki-osnovnye-proizvodstvennye-pokazateli-ga/
United States:
Bureau of Transportation Statistics (BTS). T-100 Market, Passengers - all US carriers, all airports. https://www.transtats.bts.gov/Data_Elements.aspx?Data=1
International:
International Air Transport Association (IATA). Air Passenger Market Analysis. https://www.iata.org/en/publications/economics/
Hale, T., Angrist, N., Goldszmidt, R., Kira, B., Petherick, A., Phillips, T., Webster, S., Cameron-Blake, E., Hallas, L., Majumdar, S., & Tatlow, H. (2021). A global panel database of pandemic policies (Oxford COVID-19 Government Response Tracker). Nature Human Behaviour . DOI: https://doi.org/10.1038/s41562-021-01079-8
Data retrieved from GitHub: https://github.com/OxCGRT/covid-policy-tracker/blob/master/data/timeseries/stringency_index.csv
- Date modified: