
 StatCan COVID-19: Data to Insights for a Better Canada Canadian aviation amid the COVID-19 pandemic: Part 1. Impact on Canadian airlines

Archived Content
Information identified as archived is provided for reference, research or recordkeeping purposes. It is not subject to the Government of Canada Web Standards and has not been altered or updated since it was archived. Please "contact us" to request a format other than those available.
Text begins
Introduction
The COVID-19 pandemic has caused an unprecedented disruption to aviation. Air transportation is all about connecting the world through the movement of people and goods. At the start of the pandemic, the movement of people by air was essentially stopped by public health measures and travel restrictions implemented around the world to combat the spread of the virus. In response, airlines grounded their fleets and laid off employees. While passenger numbers and revenues both dwindled, high fixed costs remained, resulting in financial losses. A number of airlines around the world had to file bankruptcy,Note while others have been kept on financial life support from governments.Note
Beyond the airlines, the pandemic touched every aspect of aviation. For instance, airports and air navigation service providers lost revenue as the number of passengers and flights decreased. Flight training units in many countries, including Canada, were closed for a period of time as “non-essential” businesses. General aviation activity declined as people were asked to stay home.
This is the first in a series of articles looking at the impact of COVID-19 on aviation in Canada and examining whether there are signs of recovery up to the end of 2021. This first article focuses on Canada’s large and medium airlines and finds that passenger airlines bore the brunt of the impact. It also examines the change in airline operations, such as the shift from passengers to cargo during the pandemic. For example, the volume of cargo transported did not decline nearly as much as passenger numbers, and the proportion of total revenue that is generated from cargo operations increased significantly.
Data and methods
Statistics Canada’s Civil Aviation Surveys collect data on operating and financial statistics from Canadian air carriers. Data from the beginning of 2018 through the end of 2021 were used for this analysis.
The Monthly Civil Aviation Survey is a census of Canadian Level I air carriers. Level I air carriers are the largest Canadian airlines: Air Canada (including Air Canada Rouge), Air Transat, Jazz, Porter, Sunwing, and WestJet (including Swoop, WestJet Encore and WestJet Link).
The Quarterly Civil Aviation Survey is a census of Canadian Level I and II air carriers. The number of carriers in the population ranged from 24 to 26 during the time period analysed. Level II air carriers include air carriers that, in the calendar year before the year in which information is provided, transported either at least 100,000 but fewer than 2 million revenue passengers, or at least 50,000 tonnes but less than 400,000 tonnes of cargo. In 2021, carrier levels were not changed due to the impact of the pandemic on passenger numbers, and all carriers remained in the same level they were in 2020 based on 2019 volumes.
The populations of these surveys, while representative of the airline industry, do not represent the entire air transportation subsector. Analysis in this article should be understood to apply only to the carrier levels being analysed. In other words, it looks at the impact of the pandemic on the largest carriers and does not make conclusions about small air operators.
Data published in the Civil Aviation Surveys are not seasonally adjusted. To deal with seasonality, and to make variables with different scales or units of measure comparable to each other, percentage changes from the same month or quarter of pre-pandemic 2019 were calculated.Note The comparison to 2019 levels is also consistent with what has been done by other organizations, such as the International Air Transport Association (IATA), the Official Airline Guide (OAG) and the United States Bureau of Transportation Statistics.
Results
Unprecedented declines and slow improvements in operating statistics
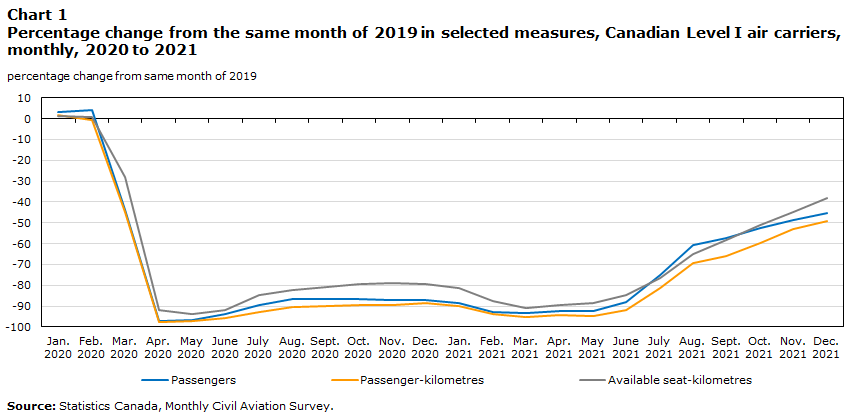
With the introduction of travel restrictions (such as closing the border to foreigners), stay-at-home advisories and restrictions on gatherings and activities in March 2020, passenger air travel was affected to an unprecedented extent. In April 2020, there was a 97% year-over-year decline in the number of passengers carried by Canadian Level I air carriers. Previously the largest year-over-year declines recorded were 26% following both the September 11, 2001, terrorist attacks in the US and during the SARS (severe acute respiratory syndrome) outbreak in 2003.
Chart 1 shows percentage changes from the same month of 2019 for passengers carried, passenger-kilometres and capacity (measured in available seat-kilometres) for Canadian Level I air carriers. Since Statistics Canada aviation surveys are not seasonally adjusted, percentage changes from the same month of 2019 were used to deal with seasonality. These 2019 levels will also be referred to as “pre-pandemic levels”.
Data table for Chart 1
| Passengers | Passenger-kilometres | Available seat-kilometres | |
|---|---|---|---|
| percentage change from the same month of 2019 | |||
| 2020 | |||
| January | 3.1 | 1.9 | 1.3 |
| February | 4.2 | -0.5 | 1.0 |
| March | -43.8 | -45.0 | -27.9 |
| April | -97.0 | -97.6 | -92.1 |
| May | -96.7 | -97.4 | -93.7 |
| June | -93.8 | -95.6 | -91.8 |
| July | -89.3 | -92.7 | -84.7 |
| August | -86.6 | -90.3 | -82.3 |
| September | -86.5 | -89.9 | -80.9 |
| October | -86.6 | -89.7 | -79.3 |
| November | -87.3 | -89.6 | -79.1 |
| December | -87.0 | -88.4 | -79.4 |
| 2021 | |||
| January | -88.4 | -89.8 | -81.2 |
| February | -92.8 | -94.0 | -87.8 |
| March | -93.2 | -95.1 | -90.9 |
| April | -92.6 | -94.5 | -89.6 |
| May | -92.5 | -94.8 | -88.7 |
| June | -88.3 | -91.7 | -84.8 |
| July | -75.0 | -81.5 | -76.7 |
| August | -60.7 | -69.3 | -65.1 |
| September | -57.5 | -66.1 | -58.2 |
| October | -52.7 | -59.5 | -51.3 |
| November | -48.5 | -53.0 | -44.6 |
| December | -45.2 | -49.4 | -38.2 |
| Source: Statistics Canada, Monthly Civil Aviation Survey. | |||
All three measures follow a similar pattern with an initial decline during March 2020, when restrictions were put in place mid-month, followed by much larger declines in April – the first full month of restrictions – and into May. Small improvements were observed over the summer of 2020, typically the busiest time of the year for air travel, but in autumn the recovery stagnated amid new waves of the pandemic. As 2021 began, the recovery stalled, with declines from pre-pandemic levels growing. In response to new variants, new travel restrictions were introduced, including pre-departure testing as of January 7 and hotel quarantine as of February 22 for air travellers arriving from abroad, as well as targeted flight suspensions.Note
Some recovery resumed in June 2021 when, amid lowering COVID-19 cases and increasing vaccination rates, provinces began coming out of lockdowns and relaxing interprovincial travel restrictions. In the third quarter of 2021, international travel restrictions were gradually relaxed. Improvements continued every month through the end of the year. Even so, in December 2021, passenger numbers were slightly over half (55%) of the pre-pandemic (December 2019) levels.
While the general pattern is similar, differences can be observed among the three variables. Beginning in March 2020 and throughout the pandemic, declines in passenger-kilometres have been larger than declines in the number of passengers or declines in capacity. Passenger-kilometres declining more than passengers reflects the decrease in the average distance travelled as international travel was more restricted than domestic travel.
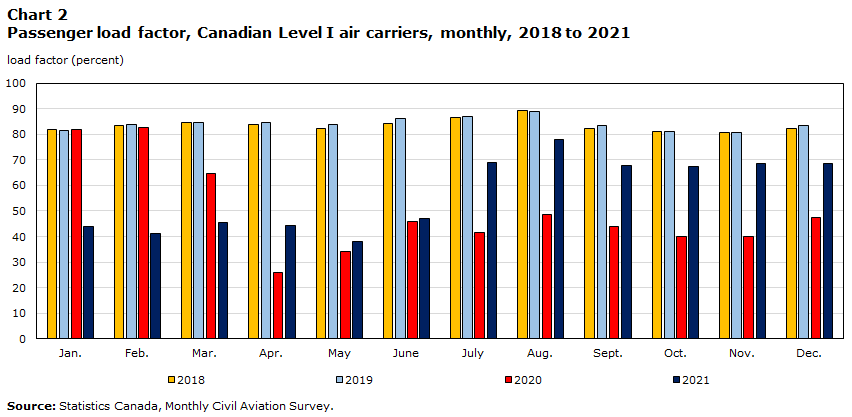
Capacity (i.e. available seat kilometres) declining less than output (i.e. passenger-kilometres) meant that passenger load factors also dropped (Chart 2). The passenger load factor is calculated by dividing passenger-kilometres by available seat-kilometres. At the beginning of the pandemic, carriers did not reduce capacity as quickly as demand declined, and the load factor reached a low point of 26% in April 2020. Following that, load factors improved slightly, but remained below 50% through June 2021. While load factors increased, reaching 78% in August, they stabilized between 67%-70% in the second half of 2021, well below the more than 80% consistently recorded in pre-pandemic times.Note
Data table for Chart 2
| 2018 | 2019 | 2020 | 2021 | |
|---|---|---|---|---|
| load factor (percent) | ||||
| January | 81.9 | 81.6 | 82.0 | 44.1 |
| February | 83.3 | 84.0 | 82.7 | 41.1 |
| March | 84.5 | 84.7 | 64.6 | 45.4 |
| April | 83.8 | 84.8 | 26.0 | 44.4 |
| May | 82.2 | 83.9 | 34.1 | 38.1 |
| June | 84.1 | 86.3 | 45.9 | 46.9 |
| July | 86.4 | 86.8 | 41.5 | 69.1 |
| August | 89.4 | 88.8 | 48.8 | 78.1 |
| September | 82.3 | 83.6 | 44.0 | 67.8 |
| October | 81.2 | 81.0 | 40.1 | 67.4 |
| November | 80.8 | 80.8 | 40.1 | 68.5 |
| December | 82.2 | 83.6 | 47.4 | 68.4 |
| Source: Statistics Canada, Monthly Civil Aviation Survey. | ||||
International flights hit harder than domestic
Statistics Canada categorizes aviation data using three sectors – domestic (within Canada), transborder (between Canada and the United States) and other international (between Canada and other countries, except the United States). Using data from the quarterly survey, in 2019, Level I and II carriers transported 47.8 million passengers (51.5%) in the domestic sector, 19.8 million (21.3%) in the transborder sector, and 25.3 million (27.2%) in the other international sector.
During the pandemic, restrictions on international travel have been stricter than on domestic travel, as reflected in the data (Chart 3). Beginning in the second quarter of 2020, declines from pre-pandemic levels in the transborder and other international sectors were both steeper than in the domestic sector. However, in most quarters, all three sectors experienced movement in the same direction – either an improvement, or a deterioration.

Data table for Chart 3
| Domestic | Transborder | Other international | |
|---|---|---|---|
| percentage change from the same quarter of 2019 | |||
| 2020 | |||
| Q1 | -17.2 | -24.0 | -10.9 |
| Q2 | -90.3 | -99.3 | -98.1 |
| Q3 | -77.9 | -97.5 | -95.0 |
| Q4 | -77.7 | -95.5 | -92.0 |
| 2021 | |||
| Q1 | -82.1 | -97.8 | -96.0 |
| Q2 | -82.1 | -97.4 | -96.9 |
| Q3 | -50.2 | -75.5 | -83.9 |
| Q4 | -42.6 | -54.4 | -57.6 |
| Source: Statistics Canada, Quarterly Civil Aviation Survey. | |||
Cargo increases in importance
While passenger air transportation experienced steep declines during the pandemic, cargo transportation became a more important component. Before the pandemic, around half of all air cargo was carried in the cargo holds on passenger flights (IATA, 2020). When these flights were grounded by the pandemic, air cargo faced a capacity crunch as supply was down but demand was up due to the need to transport personal protective equipment and an increase in e-commerce.Note Cargo carriers increased fleet utilization (the number of hours flown by each aircraft in a given time period) and added more freighters to their fleets (IATA, 2020). Some postponed retirement of older aircraft or brought them back to service out of retirement (Dron, 2020).
Passenger carriers entered the cargo domain by removing seats from passenger cabins, or using only cargo holds and leaving passenger cabins empty, or even placing boxes on the seats, secured by nets (Dron, 2020). Some airlines also chose to convert some of their older passenger planes to freighters, with businesses doing the conversions facing orders well into the future and new companies entering the conversion business (Perry, 2021). Even so, according to IATA (2022), in 2021 global cargo capacity was 11% below pre-pandemic levels, and the cargo load factor (cargo tonne-kilometres divided by available cargo tonne-kilometres) was over 9 percentage points higher than in 2019.
As a result of this lower supply and higher demand, yields increased. Table 1 presents cargo yields for Canadian Level I and II air carriers calculated by dividing goods revenue from the Quarterly Civil Aviation Survey by goods tonne-kilometres from the same survey. Percentage changes from the same quarter of 2019 are also presented and exceed 59% every quarter during the pandemic. This is in line with international data from IATA (2021c).
| Q1 | Q2 | Q3 | Q4 | |
|---|---|---|---|---|
| dollars | ||||
| 2018 | 0.48 | 0.48 | 0.47 | 0.51 |
| 2019 | 0.49 | 0.49 | 0.45 | 0.51 |
| 2020 | 0.53 | 1.06 | 0.83 | 0.82 |
| 2021 | 0.79 | 0.78 | 0.75 | 0.85 |
| percentage change | ||||
| Change from 2019 to 2020 | 8.2 | 116.3 | 84.4 | 60.8 |
| Change from 2019 to 2021 | 61.2 | 59.2 | 66.7 | 66.7 |
| Source: Statistics Canada, Quarterly Civil Aviation Survey. | ||||
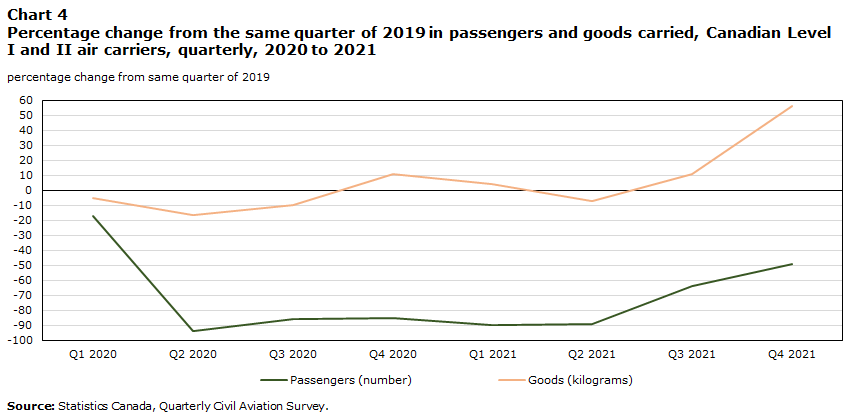
Chart 4 shows the stark difference between passengers and cargo (measured in kilograms of goods carried) for Canadian Level I and II air carriers. Once again, percentage changes from the same quarter of 2019 are shown to deal with seasonality and compare across different units of measure. While the number of passengers remained significantly below pre-pandemic levels, the amount of cargo carried increased in some quarters during the pandemic compared to pre-pandemic levels. In other quarters, there were declines in cargo carried due to capacity shortages, but these were nowhere near the magnitude of the declines in passengers. Overall, in 2020 these carriers transported 872 million kilograms of cargo, compared with 920 million kilograms in 2019. In 2021, they carried over one billion kilograms of goods.
Data table for Chart 4
| Passengers (number) | Goods (kilograms) | |
|---|---|---|
| percentage change from the same quarter of 2019 | ||
| 2020 | ||
| Q1 | -16.9 | -4.8 |
| Q2 | -94.2 | -16.2 |
| Q3 | -86.1 | -9.8 |
| Q4 | -85.2 | 10.9 |
| 2021 | ||
| Q1 | -90.2 | 4.1 |
| Q2 | -89.1 | -7.3 |
| Q3 | -63.8 | 11.1 |
| Q4 | -49.0 | 56.1 |
| Source: Statistics Canada, Quarterly Civil Aviation Survey. | ||
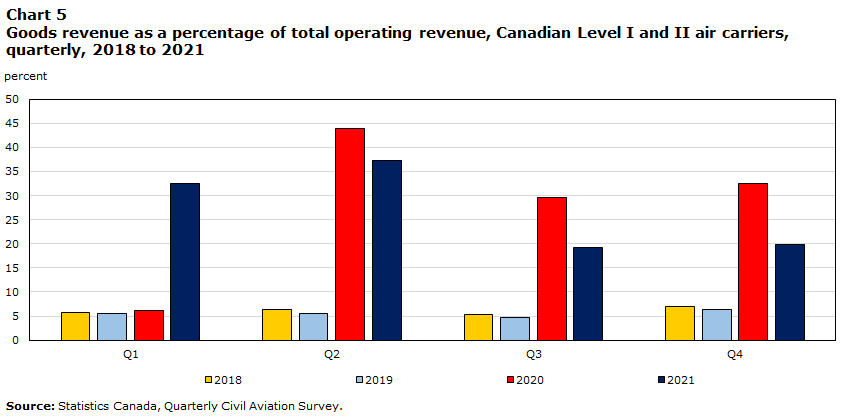
As a result of the large declines in passenger air transportation and increases or smaller declines in cargo transportation, cargo revenue became a much larger component of air carriers’ revenue. As shown in chart 5, goods revenue went from making up 4%-7% of total operating revenue of Canadian Level I and II air carriers, to more than 19% every quarter since the second quarter of 2020. In the second quarter of 2020, when passenger travel was at its lowest, goods revenue accounted for an unprecedented 44% of total operating revenue.
Data table for Chart 5
| 2018 | 2019 | 2020 | 2021 | |
|---|---|---|---|---|
| percent | ||||
| Q1 | 5.8 | 5.6 | 6.2 | 32.6 |
| Q2 | 6.3 | 5.6 | 44.0 | 37.2 |
| Q3 | 5.4 | 4.7 | 29.5 | 19.3 |
| Q4 | 7.0 | 6.4 | 32.6 | 19.9 |
| Source: Statistics Canada, Quarterly Civil Aviation Survey. | ||||
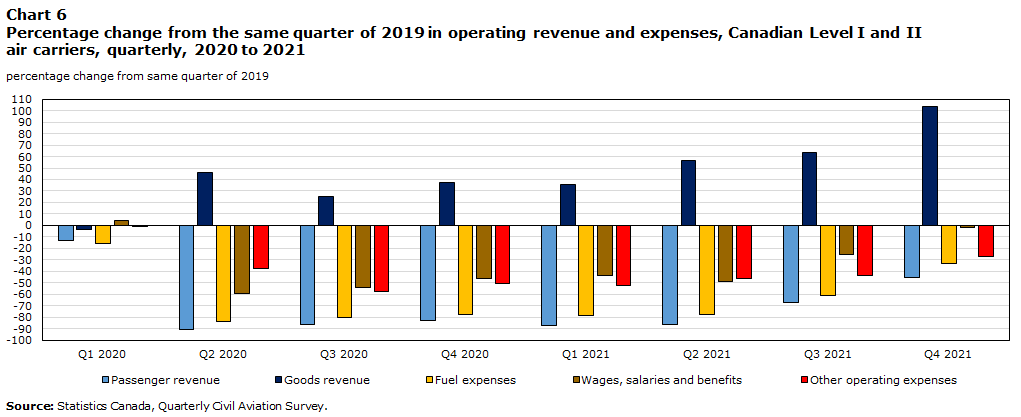
Fixed costs contribute to losses
Higher volumes and higher yields contributed to increases in goods revenue compared to pre-pandemic levels beginning in the second quarter of 2020 (Chart 6). Even in those quarters when the volume of goods carried decreased, revenue increased due to high yields. At the same time, passenger revenue declined over 80% in each quarter compared to the corresponding quarters of 2019, until the second half of 2021 when the declines were not as large.
Expenses, on the other hand, did not decrease as much due to high fixed costs. Before the pandemic, in 2019, Level I and II air carriers spent $6.7 billion on fuel, $4.6 billion on wages, salaries and benefits, and $14.6 billion on other operating expenses. During the pandemic, only fuel expenses, which are directly proportional to the amount of flying, experienced declines to an extent similar to total operating revenue (not on the chart), also helped by lower fuel prices in 2020 amid low demand.Note Expenses on wages, salaries and benefits were reduced through both workforce reductions (layoffs, furloughs and unpaid leaves) and salary reductions for those employees that remained employed. In order to reduce other expenses, airlines retired older, less fuel efficient aircraft ahead of schedule, suspended many routes, reduced frequencies on others, deployed smaller aircraft on certain routes, and closed operations at some airports.
Data table for Chart 6
| Passenger revenue | Goods revenue | Fuel expenses | Wages, salaries and benefits | Other operating expenses | |
|---|---|---|---|---|---|
| percentage change from the same quarter of 2019 | |||||
| 2020 | |||||
| Q1 | -12.9 | -3.9 | -15.6 | 4.0 | -0.3 |
| Q2 | -90.9 | 46.3 | -83.8 | -59.3 | -37.3 |
| Q3 | -86.2 | 24.8 | -80.6 | -54.0 | -58.0 |
| Q4 | -82.9 | 37.4 | -78.0 | -46.4 | -50.4 |
| 2021 | |||||
| Q1 | -86.9 | 36.0 | -78.4 | -43.4 | -52.1 |
| Q2 | -86.5 | 56.6 | -77.7 | -49.3 | -46.5 |
| Q3 | -66.8 | 63.6 | -60.8 | -25.4 | -43.6 |
| Q4 | -45.3 | 103.2 | -33.4 | -2.2 | -27.0 |
| Source: Statistics Canada, Quarterly Civil Aviation Survey. | |||||
The dramatic decline in revenue in this high-fixed-cost industry had a serious effect on the bottom line. In the first year of the pandemic – the period from the second quarter of 2020 through the first quarter of 2021 – Canadian Level I and II air carriers posted a total aggregate net loss of $5 billion. In order to stay in business, some carriers received government support, first through the Canada Emergency Wage Subsidy and then also through loans, used their existing credit lines, and issued bonds on financial markets. As a result, debt levels in the industry increased significantly.Note
Summary and conclusion
The COVID-19 pandemic is the biggest shock to the aviation industry in history. This article examined its impact on Canadian airlines and the road to recovery up to December 2021.
The biggest impact was on passenger airlines, as passenger traffic dropped to an unprecedented extent and has been sluggish to recover. High fixed costs amid falling revenue led to large financial losses. Cargo has been a bright spot for airlines, as demand and yields increased, but it was not enough to offset passenger losses. Operating and financial statistics for air carriers all show the catastrophic declines and very little improvement until the summer of 2021 when the recovery picked up.
With the new variant of concern, Omicron, being declared in late November and prompting new travel restrictions to be introduced, operating metrics took a hit in January 2022. Although a slight improvement was observed in February, it remains to be seen at what pace the recovery will resume.
References
Dron, Alan. (2020, November). Air freight shifts its centre of gravity. AEROSPACE, 47(11), 18-21.
IATA. (2022, January 25). Air cargo market analysis, December 2021. https://www.iata.org/en/iata-repository/publications/economic-reports/air-freight-monthly-analysis---december-2021/
IATA. (2021a, October). Annual review 2021. https://www.iata.org/contentassets/c81222d96c9a4e0bb4ff6ced0126f0bb/iata-annual-review-2021.pdf
IATA. (2021b, October 4). Airline industry economic performance – October 2021. https://www.iata.org/en/iata-repository/publications/economic-reports/airline-industry-economic-performance---october-2021---presentation/
IATA. (2021c, December 14). Cargo chartbook, Q4 2021. https://www.iata.org/en/iata-repository/publications/economic-reports/cargo-chartbook---q4-2021/
IATA. (2020, November). Annual review 2020. https://www.iata.org/contentassets/c81222d96c9a4e0bb4ff6ced0126f0bb/iata-annual-review-2020.pdf
Perry, Dominic. (2021, May 12). Why passenger-to-freighter conversion market is booming. FlightGlobal. https://www.flightglobal.com/air-transport/why-passenger-to-freighter-conversion-market-is-booming/143706.article
Statistics Canada. Surveys and statistical programs – Monthly Civil Aviation Survey. https://www23.statcan.gc.ca/imdb/p2SV.pl?Function=getSurvey&SDDS=5026
Statistics Canada. Surveys and statistical programs – Quarterly Civil Aviation Survey. https://www23.statcan.gc.ca/imdb/p2SV.pl?Function=getSurvey&SDDS=2712
Statistics Canada. (2021a). Table 18-10-0266-01 Industrial product price index, by product, monthly [Data table]. https://doi.org/10.25318/1810026601-eng
Statistics Canada. (2021b, February 19). Retail trade, December 2020. The Daily. https://www150.statcan.gc.ca/n1/daily-quotidien/210219/dq210219a-eng.htm
- Date modified: