
 StatCan COVID-19: Data to Insights for a Better Canada The outlook of rural businesses, fourth quarter of 2021

Archived Content
Information identified as archived is provided for reference, research or recordkeeping purposes. It is not subject to the Government of Canada Web Standards and has not been altered or updated since it was archived. Please "contact us" to request a format other than those available.
by Andrew Balcom, Anne Munro, Darren Ytsma and Eric Baxter
Text begins
The fall of 2021 saw unemployment rates continue to declineNote as the economy expanded and Canadians from coast to coast continued to adapt to COVID-19 related measures. Real gross domestic product (GDP) rose by 1.3% during the third quarter following a slight decline of 0.8% in the previous quarter.Note
The impacts of these conditions on businesses have varied across regions and industries. The Canadian Survey on Business Conditions (CSBC) provides detailed information on the environment businesses are currently operating in and their expectations moving forward. This analysis focuses on businesses in rural areasNote using results from the CSBC, fourth quarter 2021, conducted from October 1st to November 5th, 2021.Note
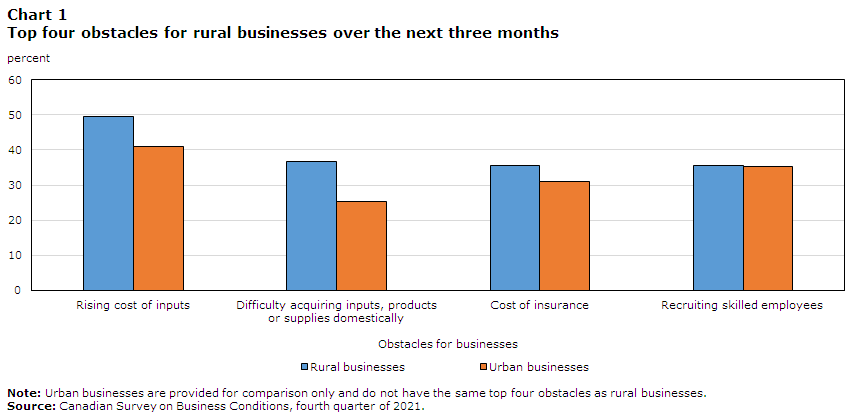
The most frequently expected short-term obstacles among rural businesses were the rising cost of inputs (49.4%), difficulty acquiring inputs, products or supplies domestically (36.7%), cost of insurance (35.7%), and recruiting skilled employees (35.5%). Among rural businesses that expected challenges with domestic supply chains, just over half (50.5%) expected the difficulties to persist for six months or longer.
Almost three-quarters (72.0%) of rural businesses reported being somewhat or very optimistic about the future outlook of their business or organization over the next 12 months. Rural businesses were significantly less likely to have employees working remotely (either partially or fulltime) compared to urban businesses. In the labour market, nearly half of rural businesses planned to increase current employee wages.
Close to half of rural businesses expect rising cost of inputs to be an obstacle in the near future
By September 2021, the prices of raw materials purchased by manufacturers operating in Canada had increased by 31.9% over the last year.Note Rising cost of inputsNote was the most commonly cited short-term obstacleNote expected by rural businesses for the fourth quarter in a row, increasing from 40.2% of businesses in the first quarter to 49.4% in the fourth quarter. Rising cost of inputs was also the most frequently cited short-term obstacle for urban businesses in the fourth quarter of 2021 at 41.0%.
Difficulty acquiring inputs, products or supplies domestically was the second most common obstacle for rural businesses at 36.7%, up from 31.7% in the third quarter. Half as many rural businesses (18.9%) expected to have difficulty acquiring these same goods abroad.
The third most commonly cited obstacle by rural businesses was cost of insurance, which has increased every quarter of 2021, rising from 25.4% in the first quarter to 35.7% in the fourth quarter.
Recruiting skilled employees was the fourth most common obstacle, with 35.5% of rural businesses expecting recruitment to be a challenge over the short-term, a small decrease from the third quarter, when 37.6% of rural businesses reported it as an expected obstacle.
Data table for Chart 1
| Rising cost of inputs | Difficulty acquiring inputs, products or supplies domestically | Cost of insurance | Recruiting skilled employees | |
|---|---|---|---|---|
| percent | ||||
| Rural businesses | 49.4 | 36.7 | 35.7 | 35.5 |
| Urban businesses | 41.0 | 25.2 | 31.1 | 35.3 |
|
Note: Urban businesses are provided for comparison only and do not have the same top four obstacles as rural businesses. Source: Canadian Survey on Business Conditions, fourth quarter of 2021. |
||||
Difficulty acquiring inputs, products or supplies expected to continue
Among the rural businesses that expected to have difficulty acquiring inputs, products or supplies from within Canada, only 11.8% expected these difficulties to subside within the next six months. Just over half (50.5%) expected this to continue for six months or longer, while 37.7% were unsure how long the difficulties would remain.
Rural businesses expecting difficulty acquiring inputs, products or supplies from abroad were similarly pessimistic, with only 10.4% expecting the difficulties to be resolved within six months, 48.9% expecting them to remain for six months or longer, and 40.7% being unsure.
Of the rural businesses that expected difficulty with maintaining inventory levels over the next three months, 11.6% expected this challenge to be resolved within 6 months. In contrast, 41.0% expected difficulties with inventory levels to continue for six months or longer, and 47.4% were unsure how long those difficulties would continue.
Close to half of rural businesses plan to increase current employee wages
In the face of a tightening labour market, many businesses are taking steps to make themselves more attractive to current and prospective employees. Just under half (49.1%) of rural businesses reported that they would increase wages offered to their existing employees within the next twelve months, with a similar percentage of urban businesses doing the same (48.2%).
Encouraging employees to participate in on-the-job training (28.3%) and increasing the wages offered to new employees (22.2%) were the other most common approaches that rural businesses were planning to implement over the next twelve months. By contrast, 38.6% of rural businesses said that they would not be implementing any labour-retention strategies.

Data table for Chart 2
| Increase wages offered to existing employees |
Encourage employees to participate in on-the-job training |
Increase wages offered to new employees |
|
|---|---|---|---|
| percent | |||
| Rural businesses | 49.1 | 28.3 | 22.2 |
| Urban businesses | 48.2 | 26.8 | 25.7 |
| Source: Canadian Survey on Business Conditions, fourth quarter of 2021. | |||
Over half of rural businesses are expecting their sales to match or surpass pre-pandemic values in the upcoming months
Close to three-quarters (72.0%) of rural businesses reported being somewhat or very optimistic about the future outlook of their business or organization over the next 12 months. Over half (58.5%) expected that their sales from October to December 2021 would match or exceed those seen in the same period of 2019, before the pandemic.
Rural businesses in the accommodation and food services (28.0%) and information and cultural industries (22.2%) were the most likely to be somewhat or very pessimistic about their future outlook. Rural businesses in accommodation and food services were also one of the most likely to expect that their October 2021 to December 2021 sales would be below pre-pandemic levels, with 41.8% expressing this expectation.
Rural businesses have a smaller share of their workforce working remotely compared to urban businesses
A higher share (80.9%) of rural businesses reported that their workforce would exclusively work on-site over the next three months compared to urban businesses (61.5%). For businesses that reported teleworking arrangements as an option,Note rural businesses reported that on average 10.9% of their staff would be working remotely either exclusively or part of the time, less than half that reported by urban businesses (26.4%).
Among businesses where teleworking was an option, Yukon was the only province or territory where rural businesses had a higher percentage of their employees expected to work remotely than their urban counterparts, at 35.4% to 15.9%.

Data table for Chart 3
| Rural businesses | Urban businesses | |
|---|---|---|
| percent | ||
| Canada | 10.9 | 26.4 |
| Newfoundland | 7.9 | 14.7 |
| Prince Edward Island | 7.6 | 17.0 |
| Nova Scotia | 11.4 | 19.5 |
| New Brunswick | 9.6 | 13.8 |
| Quebec | 11.5 | 25.0 |
| Ontario | 5.7 | 28.2 |
| Maniobta | 8.8 | 19.6 |
| Saskatchewan | 9.6 | 18.7 |
| Alberta | 11.9 | 27.7 |
| British Columbia | 19.9 | 27.6 |
| Yukon | 35.4 | 15.9 |
| Northwest Territories | 11.3 | 25.0 |
| Nunavut | 17.1 | Note ...: not applicable |
|
... not applicable Notes: These values were for businesses where at least 1% of employees were expected to work remotely. Nunavut does not have an urban entry as it does not have any CMA or CA areas. Source: Canadian Survey on Business Conditions, fourth quarter of 2021. |
||
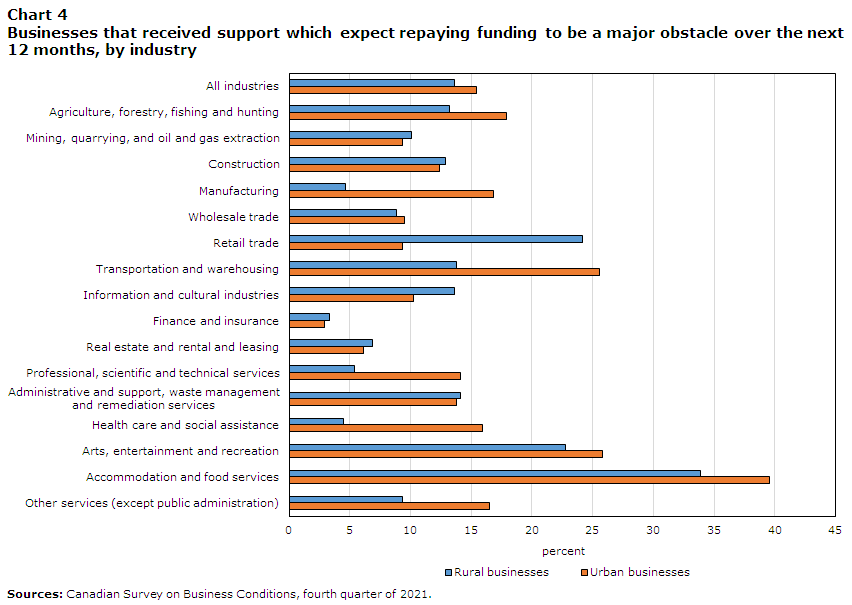
Over a third of rural businesses in arts, entertainment and recreation report a lack of government support would highly impact their survival
When asked how the absence of government support programs would affect their businesses over the next 12 months, 12.6% of rural businesses anticipated that a lack of government support would highly impact the survival of their business. Rural businesses in arts, entertainment and recreation were over three times more likely than the average business to expect high impacts, at 40.4%.
Urban businesses were slightly more likely to expect high impacts to their survival if government support programs were absent, at 16.2% compared to 12.6% for rural. This difference was greatest in the accommodation and food industries, where just under half (45.2%) of urban businesses said that such an absence would highly impact their survival compared to 31.6% of rural businesses in the same sector. When rural businesses were asked to what extent they foresaw challenges in repaying funding received from repayable government support programs over the next 12 months, 13.6% of rural businesses foresaw that being a major challenge, while 23.6% saw it as a minor challenge.
Data table for Chart 4
| Industry | Rural businesses | Urban businesses |
|---|---|---|
| percent | ||
| All industries | 13.6 | 15.4 |
| Agriculture, forestry, fishing and hunting | 13.2 | 17.9 |
| Mining, quarrying, and oil and gas extraction | 10.1 | 9.3 |
| Construction | 12.9 | 12.4 |
| Manufacturing | 4.6 | 16.8 |
| Wholesale trade | 8.8 | 9.5 |
| Retail trade | 24.2 | 9.3 |
| Transportation and warehousing | 13.8 | 25.6 |
| Information and cultural industries | 13.6 | 10.2 |
| Finance and insurance | 3.3 | 2.9 |
| Real estate and rental and leasing | 6.9 | 6.1 |
| Professional, scientific and technical services | 5.4 | 14.1 |
| Administrative and support, waste management and remediation services |
14.1 | 13.8 |
| Health care and social assistance | 4.5 | 15.9 |
| Arts, entertainment and recreation | 22.8 | 25.8 |
| Accommodation and food services | 33.9 | 39.6 |
| Other services (except public administration) | 9.3 | 16.5 |
| Sources: Canadian Survey on Business Conditions, fourth quarter of 2021. | ||
Methodology
From October 1 to November 5, 2021, representatives from businesses across Canada were invited to take part in an online questionnaire about business conditions and business expectations moving forward. This iteration of the Canadian Survey on Business ConditionsNote used a stratified random sample of business establishments with employees classified by geography, industry sector, and size. Estimation of proportions is done using calibrated weights to calculate the population totals in the domains of interest.
Businesses were classified as rural or urban based on their geographic location. The 2016 Census Subdivision Boundary File was used to identify all businesses’ Census Subdivisions (CSD) based on location. Businesses located in CSDs classified as either Census Metropolitan Areas or Census Agglomerations were classified as urban. All businesses in other locations were classified as rural.
References
Statistics Canada. (2021). Canadian Survey on Business Conditions, fourth quarter of 2021.
Statistics Canada. (2021). Canadian Survey on Business Conditions, third quarter of 2021.
Statistics Canada. (2021). Canadian Survey on Business Conditions, second quarter of 2021.
Statistics Canada. (2021). Canadian Survey on Business Conditions, first quarter of 2021.
- Date modified: