
 StatCan COVID-19: Data to Insights for a Better Canada Impact of COVID-19 on small businesses in Canada, first quarter of 2021

Archived Content
Information identified as archived is provided for reference, research or recordkeeping purposes. It is not subject to the Government of Canada Web Standards and has not been altered or updated since it was archived. Please "contact us" to request a format other than those available.
by Stephanie Tam, Shivani Sood and Chris Johnston
Following the onset of the pandemic, Canada experienced a drastic drop in its real gross domestic product (GDP), with the economy contracting 18.2% between March and April 2020.Note With the gradual easing of pandemic-related restrictions, the business climate began to improve. GDP grew for eight consecutive months, although overall economic activity is about 3% below February’s pre-pandemic level.Note While recent months showed an improvement in economic activity, in light of the resurgence of COVID-19 and a return to a partial shutdown this winter in several provinces, there remain challenges and uncertainty ahead for businesses. By the end of 2020, the Canadian economy had experienced nearly a full year of COVID-19, and businesses were adapting to the new reality by shifting to online sales, reducing hours, laying off staff, applying for government funding or seeking rent relief.
Small businesses make up 98.0% of all employer businesses in CanadaNote , therefore these businesses have a significant impact on the overall Canadian economy. From mid-January to mid-February, Statistics Canada conducted the Canadian Survey on Business Conditions to better understand the ongoing effects of the pandemic on businesses. Based on the results of the survey, while the majority of businesses in Canada expected to be impacted, smaller businesses expected more significant impacts, such as a decrease in profitability and sales. Small businesses were more likely to experience a year-over-year decrease in revenue, and also less likely to be able to take on more debt and adopt or incorporate various technologies. This article provides insights on the specific realities faced by small businesses during these unprecedented times.
Small businesses shift to increase online sales capabilities
Over one in ten businesses with 1 to 4 (11.2%) employees and around one-quarter of businesses with 5 to 19 employees (22.0%) and 20 to 99 employees (26.2%) had an online sales platform or had plans to implement one. About one in ten businesses with 1 to 4 employees (7.6%), 5 to 19 employees (10.2%), and 20 to 99 employees (12.9%) adopted or incorporated digital technology to move business operations or sales online.
In 2020, around one in ten businesses with 1 to 4 employees (10.7%), 5 to 19 employees (9.0%), and 20 to 99 employees (9.7%) made 50% or more of their total sales online. In comparison, in 2019, 7.8% of businesses with 1 to 4 employees, 4.9% of businesses with 5 to 19 employees, and 6.7% of businesses with 20 to 99 employees made 50% or more of their total sales online.
| Made sales online in 2019 (% of businesses) | Made sales online in 2020 (% of businesses) | % change of sales online in 2020 compared with 2019 | Made 50% or more of total sales online in 2019 (% of businesses) | Made 50% or more of total sales online in 2020 (% of businesses) | % change of 50% or more of total sales online in 2020 compared with 2019 | |
|---|---|---|---|---|---|---|
| All employment sizes | 17.6 | 21.6 | 4.0 | 6.8 | 10.0 | 3.2 |
| 1 to 4 employees | 15.0 | 18.3 | 3.3 | 7.8 | 10.7 | 2.9 |
| 5 to 19 employees | 18.1 | 23.7 | 5.6 | 4.9 | 9.0 | 4.1 |
| 20 to 99 employees | 25.6 | 32.2 | 6.6 | 6.7 | 9.7 | 3.0 |
| 100 or more employees | 27.6 | 30.9 | 3.3 | 8.4 | 11.6 | 3.2 |
|
Note: Respondents were asked what percentage of total sales were made online in 2019 and 2020.
Source: Canadian Survey on Business Conditions, first quarter of 2021 (Table 33-10-0316-01). |
||||||
Small businesses expect a decrease in sales and profitability
Close to one-third of businesses with 1 to 4 employees (30.4%), 5 to 19 employees (32.6%), and 20 to 99 employees (28.1%) expected to see a decrease in sales over the next three monthsNote , while under one-fifth (19.2%) of businesses with 100 or more employees said the same.
Additionally, around two-fifths of businesses with 1 to 4 employees (42.3%), 5 to 19 employees (43.9%), and 20 to 99 employees (36.6%) expect to see a decrease in profitability, while just under one-quarter (24.3%) of businesses with 100 or more employees reported the same.
Around 10% of businesses with 1 to 4 employees (6.1%), 5 to 19 employees (10.2%), and 20 to 99 employees (13.9%) reported that the number of employees over the next three months is expected to increase, compared to under one-quarter of businesses with 100 or more employees (23.2%).
| Increase (% of businesses) | Stay about the same (% of businesses) | Decrease (% of businesses) | Not applicable (% of businesses) | |
|---|---|---|---|---|
| All employment sizes | 11.8 | 41.5 | 30.6 | 16.0 |
| 1 to 4 employees | 9.9 | 39.2 | 30.4 | 20.5 |
| 5 to 19 employees | 12.7 | 44.0 | 32.6 | 10.7 |
| 20 to 99 employees | 16.8 | 45.2 | 28.1 | 9.9 |
| 100 or more employees | 23.9 | 44.4 | 19.2 | 12.4 |
|
Note: Respondents were asked: Over the next three months, how are each of the following expected to change for this business or organization?
Source: Canadian Survey on Business Conditions, first quarter of 2021 (Table 33-10-0307-01). |
||||
| Increase (% of businesses) | Stay about the same (% of businesses) | Decrease (% of businesses) | Not applicable (% of businesses) | |
|---|---|---|---|---|
| All employment sizes | 8.3 | 42.3 | 41.8 | 7.6 |
| 1 to 4 employees | 7.6 | 42.2 | 42.3 | 8.0 |
| 5 to 19 employees | 8.2 | 40.9 | 43.9 | 7.0 |
| 20 to 99 employees | 10.9 | 45.4 | 36.6 | 7.1 |
| 100 or more employees | 17.2 | 50.0 | 24.3 | 8.5 |
|
Note: Respondents were asked: Over the next three months, how are each of the following expected to change for this business or organization?
Source: Canadian Survey on Business Conditions, first quarter of 2021 (Table 33-10-0307-01). |
||||
| Increase (% of businesses) | Stay about the same (% of businesses) | Decrease (% of businesses) | Not applicable (% of businesses) | |
|---|---|---|---|---|
| All employment sizes | 8.6 | 70.6 | 11.7 | 9.1 |
| 1 to 4 employees | 6.1 | 71.5 | 8.1 | 14.2 |
| 5 to 19 employees | 10.2 | 70.7 | 15.9 | 3.1 |
| 20 to 99 employees | 13.9 | 67.4 | 16.9 | 1.8 |
| 100 or more employees | 23.2 | 60.7 | 14.4 | 1.7 |
|
Note: Respondents were asked: Over the next three months, how are each of the following expected to change for this business or organization?
Source: Canadian Survey on Business Conditions, first quarter of 2021 (Table 33-10-0307-01). |
||||
Small businesses more likely to have experienced a drop in revenue in 2020
Over one-quarter of businesses with 1 to 4 employees (32.7%), 5 to 19 employees (30.8%), and 20 to 99 employees (25.2%) reported revenues were down 30% or more in 2020 compared with 2019. However, under one-fifth (17.5%) of businesses with 100 or more employees reported the same. Additionally, close to one-fifth of businesses with 1 to 4 employees (15.7%) and 5 to 19 employees (19.4%), and nearly one-quarter of businesses with 20 to 99 employees (23.2%) reported an increase in revenue. Conversely, over one-third (35.8%) of businesses with 100 or more employees reported an increase in revenue.
| Percentage of businesses that reported an increase in revenue | Percentage of businesses that reported no change in revenue | Percentage of businesses that reported a 1% to less than 30% decline in revenue | Percentage of businesses that reported a 30% or more decline in revenue | Not applicable e.g., started operating after December 31st, 2019 | |
|---|---|---|---|---|---|
| All employment sizes | 18.1 | 20.7 | 29.5 | 31.0 | 0.8 |
| 1 to 4 employees | 15.7 | 23.4 | 27.1 | 32.7 | 0.9 |
| 5 to 19 employees | 19.4 | 16.8 | 32.5 | 30.8 | 0.7 |
| 20 to 99 employees | 23.2 | 19.0 | 32.2 | 25.2 | 0.5 |
| 100 or more employees | 35.8 | 16.5 | 28.9 | 17.5 | 1.4 |
|
Note: Respondents were asked: Compared to 2019, how did the revenues of this business change in 2020? Source: Canadian Survey on Business Conditions, first quarter of 2021 (Table 33-10-0317-01). |
|||||
While small businesses were more likely to experience a drop in revenue, some small businesses saw lower expenses in 2020 compared with 2019. Under one-fifth of businesses with 1 to 4 employees (19.2%), nearly one-quarter of businesses with 5 to 19 employees (24.2%), and close to one-third of businesses with 20 to 99 employees (30.4%) reported lower expenses.
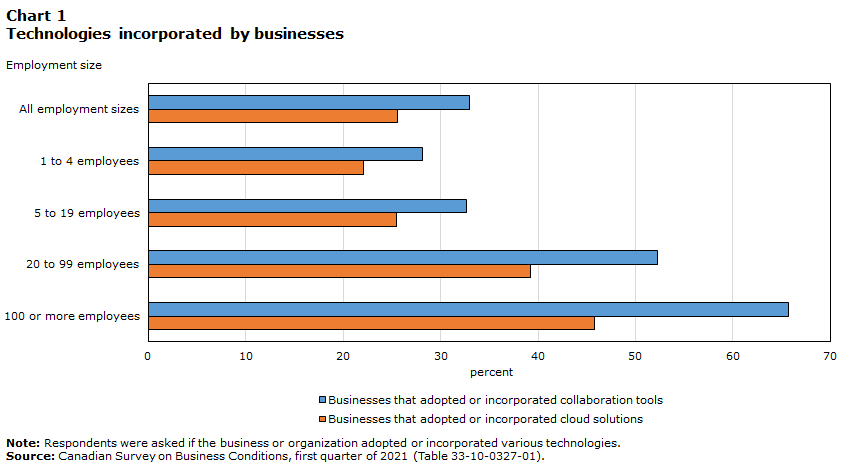
Smaller businesses less likely to adopt technologies such as collaboration tools and cloud solutions
With more and more businesses shifting their operations online and transitioning employees to a teleworking model, there has been a rise in the adoption of various technologies. Smaller businesses were less likely to adopt or incorporate various technologies.
For example, in terms of collaboration tools such as Zoom and Microsoft Teams, under one-third of businesses with 1 to 4 employees (28.1%) and 5 to 19 employees (32.6%) adopted or incorporated collaboration tools into their business. However, over half of businesses with 20 to 99 employees (52.3%) and almost two-thirds (65.7%) of businesses with 100 or more employees did the same.
Similarly, smaller businesses were less likely to adopt or incorporate cloud solutions such as Google Cloud and Dropbox. Around one-quarter of businesses with 1 to 4 employees (22.1%) and 5 to 19 employees (25.5%) adopted or incorporated cloud solutions. By contrast, nearly two-fifths of businesses with 20 to 99 employees (39.2%) and under half of businesses with 100 or more employees (45.8%) reported doing the same.
Data table for Chart 1
| Employment size | Businesses that adopted or incorporated collaboration tools | Businesses that adopted or incorporated cloud solutions |
|---|---|---|
| percent | ||
| All employment sizes | 33.0 | 25.6 |
| 1 to 4 employees | 28.1 | 22.1 |
| 5 to 19 employees | 32.6 | 25.5 |
| 20 to 99 employees | 52.3 | 39.2 |
| 100 or more employees | 65.7 | 45.8 |
|
Note: Respondents were asked if the business or organization adopted or incorporated various technologies. Source: Canadian Survey on Business Conditions, first quarter of 2021 (Table 33-10-0327-01). |
||
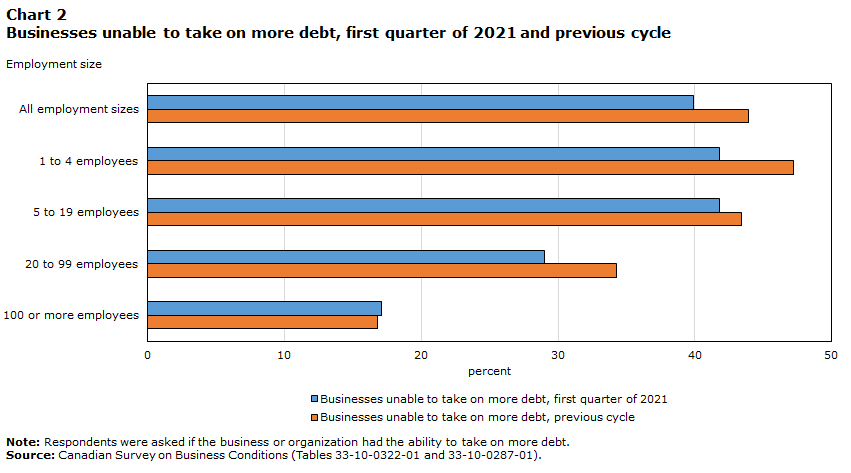
Smaller businesses less likely to be able to take on more debt
As COVID-19 restrictions were put in place, many businesses were forced to seek external financing in order to survive. As a result, some businesses have now reached a point where they do not have the ability to take on more debt. Smaller businesses were more likely to report this being the case.
Similarly to the previous cycleNote , over two-fifths of businesses with 1 to 4 employees (41.8%) and 5 to 19 employees (41.8%), and about one-third of businesses with 20 to 99 employees (29.0%) reported that they did not have the ability to take on more debt. In contrast, 17.1% of businesses with 100 or more employees reported not being able to take on more debt.
Data table for Chart 2
| Employment size | Businesses unable to take on more debt, first quarter 2021 | Businesses unable to take on more debt, previous cycle |
|---|---|---|
| percent | ||
| All employment sizes | 39.9 | 43.9 |
| 1 to 4 employees | 41.8 | 47.2 |
| 5 to 19 employees | 41.8 | 43.4 |
| 20 to 99 employees | 29.0 | 34.3 |
| 100 or more employees | 17.1 | 16.8 |
|
Note: Respondents were asked if the business or organization had the ability to take on more debt. Source: Canadian Survey on Business Conditions (Tables 33-10-0322-01 and 33-10-0287-01). |
||
One-fifth of businesses with 1 to 4 employees (21.8%) and 20 to 99 employees (20.9%), and under one-third of businesses with 5 to 19 employees (30.4%) expected maintaining sufficient cash flow to be an obstacle over the next three months. Conversely, 13.2% of businesses with 100 or more employees reported the same expectations.
Around two-fifths of businesses with 1 to 4 employees (38.3%), 5 to 19 employees (36.5%), and 20 to 99 employees (41.5%) expected to be able to operate for 12 months or more before considering closure and bankruptcy. However, over half (51.9%) of businesses with 100 or more employees said the same.
Smaller businesses less likely to provide employee support such as sick leave and additional time off during COVID-19
The challenges of the COVID-19 pandemic have resulted in many businesses implementing new programs to better support their employees during these difficult times. The most common types of new employee support measures providedNote were additional time off (39.8%), virtual social gatherings (35.1%), and paid COVID-19 sick leave (32.7%). If employee support was provided, smaller businesses were slightly more likely to provide additional paid or unpaid time off, but slightly less likely to provide paid COVID-19 sick leave.
One-quarter of businesses with 1 to 4 employees (25.7%), two-fifths of businesses with 5 to 19 employees (39.9%) and over half of businesses with 20 to 99 employees (53.7%) reported that they provided some sort of employee support that was not already available before the pandemic. Conversely, over two-thirds (68.8%) of businesses with 100 or more employees reported providing additional support to their employees due to the pandemic.

Data table for Chart 3
| Employment size | Businesses that provided additional paid or unpaid time off | Businesses that provided paid sick leave specifically for COVID-19 | Businesses that provided virtual social gatherings with work colleagues |
|---|---|---|---|
| percent | |||
| All employment sizes | 39.8 | 32.7 | 35.1 |
| 1 to 4 employees | 42.8 | 28.4 | 32.3 |
| 5 to 19 employees | 41.6 | 33.1 | 32.3 |
| 20 to 99 employees | 31.8 | 40.0 | 43.2 |
| 100 or more employees | 24.1 | 43.3 | 54.4 |
|
Note: Respondents were asked if the business or organization provided various support to their employees that was not available before the pandemic. Respondents that selected that they did not provide any support to employees during the pandemic were excluded from calculations. Source: Canadian Survey on Business Conditions, first quarter of 2021 (Table 33-10-0313-01). |
|||
Methodology
From January 11 to February 11, representatives from businesses across Canada were invited to take part in an online questionnaire about how COVID-19 is affecting their business. This iteration of the Canadian Survey on Business Conditions used a stratified random sample of business establishments with employees classified by geography, industry sector, and size. Estimation of proportions is done using calibrated weights to calculate the population totals in the domains of interest.
References
Statistics Canada. (2021). Canadian Survey on Business Conditions, first quarter of 2021.
- Date modified: