
 StatCan COVID-19: Data to Insights for a Better Canada Impact of COVID-19 on small businesses in Canada, third quarter 2020

Archived Content
Information identified as archived is provided for reference, research or recordkeeping purposes. It is not subject to the Government of Canada Web Standards and has not been altered or updated since it was archived. Please "contact us" to request a format other than those available.
by Stephanie Tam, Shivani Sood and Chris Johnston
Text begins
As a result of the widespread measures taken to contain the spread of COVID-19, the Canadian economy contracted 11.6% in April, following a 7.5% drop in March.Note Real gross domestic product (GDP) grew 1.2% in August, the fourth consecutive monthly increase which continued to offset the steepest drops on record in Canadian economic activity observed in March and April. However, overall economic activity was still about 5% below February’s pre-pandemic level.Note Since the end of May, many businesses had begun to adapt to the new reality by shifting to teleworking, reducing hours, laying off staff, applying for government funding or seeking rent relief.
With small businesses making up 98.0% of all employer businesses in CanadaNote , these businesses have an impact on the overall Canadian economy. From mid-September to late-October, Statistics Canada conducted the Canadian Survey on Business Conditions to better understand the ongoing effects of the pandemic on businesses. Based on the results of the survey, while the majority of businesses in Canada were impacted, smaller businesses reported being more affected. Small businesses were more likely to experience a decrease in revenue and have less liquidity, and more likely to be unable to take on more debt and to be considering bankruptcy in the current economic environment. This article provides insights on the specific realities faced by small businesses during these unprecedented times.
Revenue changes
Over half of businesses in Canada reported a revenue decrease compared to August 2019, irrespective of their employment size. However, it was more likely for smaller businesses to report a revenue decrease of 40% or more.
Close to one-quarter of businesses with 1 to 4 employees (23.7%) and under one-fifth of businesses with 5 to 19 employees (18.5%) reported revenues in August were down 40% or more year over year. On the other hand, 16.8% of businesses with 20 to 99 employees and 14.5% of businesses with 100 or more employees reported the same. Additionally, close to one-third (30.3%) of businesses with 1 to 4 employees reported their revenues stayed the same when comparing their revenue from August 2020 to August 2019. Around one-fifth of businesses with 5 to 19 employees (19.0%), 20 to 99 employees (21.7%), and 100 or more employees (18.8%) reported their revenues remained the same. Businesses with 1 to 4 employees were least likely to report an increase (12.3%) in revenue compared to August 2019.
| Percentage of businesses that reported an increase in revenue | Percentage of businesses that reported no change in revenue | Percentage of businesses that reported a 1% to less than 20% decline in revenue | Percentage of businesses that reported a 20% to less than 40% decline in revenue | Percentage of businesses that reported a 40% or more decline in revenue | Not applicable | |
|---|---|---|---|---|---|---|
| All employment sizes | 17.2 | 25.5 | 14.6 | 20.8 | 21.1 | 0.8 |
| 1 to 4 employees | 12.3 | 30.3 | 12.9 | 20.3 | 23.7 | 0.7 |
| 5 to 19 employees | 23.5 | 19 | 15.2 | 23 | 18.5 | 0.7 |
| 20 to 99 employees | 21.9 | 21.7 | 20.1 | 18.1 | 16.8 | 1.4 |
| 100 or more employees | 27.5 | 18.8 | 14.6 | 18.4 | 14.5 | 0.6 |
|
Note: Respondents were asked: Compared to August 2019, how did the revenues of this business change in August 2020? Source: Canadian Survey on Business Conditions: Impact of COVID-19 on businesses in Canada (Table 33-10-0281-01). |
||||||
Debt, liquidity and bankruptcy
Small businesses were less likely to have the ability to take on debt and also slightly less likely to have the liquidity to operate. Close to half of businesses with 1 to 4 employees (47.2%), around two-fifths of businesses with 5 to 19 employees (43.4%), and over a third of businesses with 20 to 99 employees (34.3%) reported that they did not have the ability to take on more debt. In contrast, 16.8% of businesses with 100 or more employees reported not being able to take on more debt.
Around three-quarters of businesses with 1 to 4 employees (75.4%) and 5 to 19 employees (77.0%) reported that they had the cash or liquid assets required to operate. However, over four-fifths of businesses with 20 to 99 employees (83.2%) and 100 or more employees (80.8%) said the same.

Data table for Chart 1
| Percent of businesses unable to take on more debt | Percent of businesses that had the cash or liquid assets required to operate | |
|---|---|---|
| percent | ||
| All employment sizes | 43.9 | 76.9 |
| 1 to 4 employees | 47.2 | 75.4 |
| 5 to 19 employees | 43.4 | 77.0 |
| 20 to 99 employees | 34.3 | 83.2 |
| 100 or more employees | 16.8 | 80.8 |
|
Note: Respondents were asked if the business or organization had the ability to take on more debt, and if they had the cash or liquid assets required to operate. Source: Canadian Survey on Business Conditions: Impact of COVID-19 on businesses in Canada (Table 33-10-0286-01 and 33-10-0287-01). |
||
Of businesses that were operational at the time the survey was conducted, 6.0% of businesses with 1 to 4 employees, 4.4% of businesses with 5 to 19 employees, and 3.6% of businesses with 20 to 99 employees reported that they were actively considering bankruptcy or closing as a result of the pandemic, in comparison to 2.6% of businesses with 100 or more employees.

Data table for Chart 2
| Percent | |
|---|---|
| All employment sizes | 5.2 |
| 1 to 4 employees | 6.0 |
| 5 to 19 employees | 4.4 |
| 20 to 99 employees | 3.6 |
| 100 or more employees | 2.6 |
|
Note: Respondents were asked to report what extent they agreed to various statements about the future operations of the business or organization. Source: Canadian Survey on Business Conditions: Impact of COVID-19 on businesses in Canada (Table 33-10-0292-01). |
|
Employment since the start of the pandemic
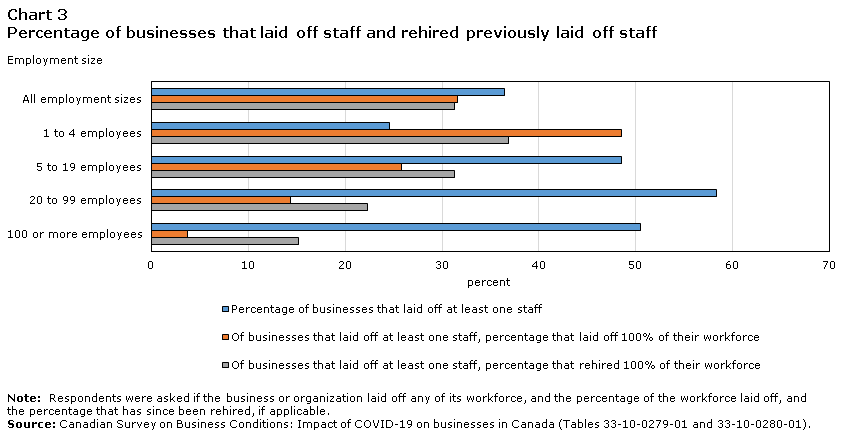
Small businesses were less likely to lay off staff. However, when layoffs were made, small businesses were more likely to layoff all of their staff. These businesses were also most likely to rehire all staff back. Nearly one-quarter of businesses with 1 to 4 employees (24.6%) reported that they laid off at least one employee since the start of the pandemic while around half of businesses with 5 to 19 employees (48.5%) and 100 or more employees (50.5%) reported the same.
Of businesses that laid off at least one staff, businesses with 1 to 4 employees were more likely to lay off 100% of their workforce. Close to half (48.5%) of businesses with 1 to 4 employees reported laying off 100% of their workforce. If the business laid off staff, small businesses were more likely to rehire 100% of their laid off since the start of the pandemic. Over one-third of businesses with 1 to 4 employees (36.9%) and nearly one-third of businesses with 5 to 19 employees (31.3%) reported that they rehired 100% of their workforce, while 15.2% of businesses with 100 or more employees said the same.
Data table for Chart 3
| Percentage of businesses that laid off at least one staff | Of businesses that laid off at least one staff, percentage that laid off 100% of their workforce | Of businesses that laid off at least one staff, percentage that rehired 100% of their workforce | |
|---|---|---|---|
| percent | |||
| All employment sizes | 36.5 | 31.6 | 31.3 |
| 1 to 4 employees | 24.6 | 48.5 | 36.9 |
| 5 to 19 employees | 48.5 | 25.8 | 31.3 |
| 20 to 99 employees | 58.4 | 14.4 | 22.3 |
| 100 or more employees | 50.5 | 3.7 | 15.2 |
|
Note: Respondents were asked if the business or organization laid off any of its workforce, and the percentage of the workforce laid off, and the percentage that has since been rehired, if applicable. Source: Canadian Survey on Business Conditions: Impact of COVID-19 on businesses in Canada (Tables 33-10-0279-01 and 33-10-0280-01). |
|||
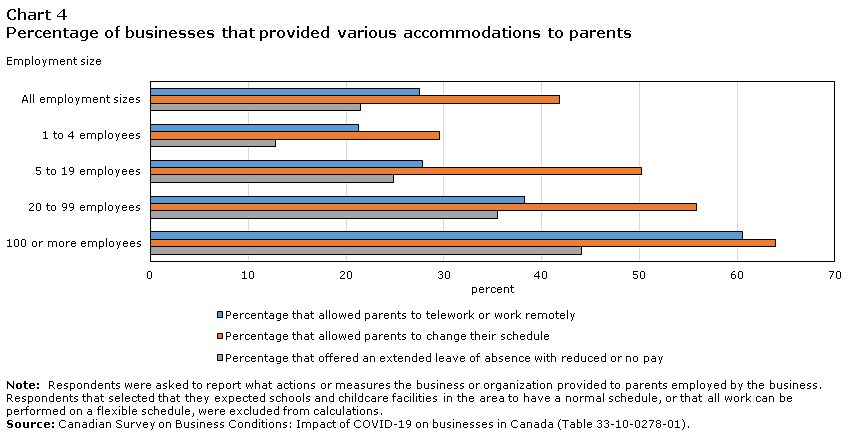
Special accommodations for employees who are parents
Over half (59.4%) of businessesNote are providing or considering providing special accommodations for parents. Small businesses were less likely to offer or consider these accommodations. One-fifth of businesses with 1 to 4 employees (21.3%) offered parents the option to telework or work remotely, while three-fifths of businesses with 100 or more employees (60.6%) offered the same. Similarly, less than one third of businesses with 1 to 4 employees (29.6%) allowed parents to change their schedules, while close to two-thirds of businesses with 100 or more employees (63.9%) offered this flexibility. Lastly, 12.8% of businesses with 1 to 4 employees offered an extended leave of absence with reduced or no pay to their employees, whereas over two-fifths of businesses with 100 or more employees (44.1%) offered this type of leave.
Data table for Chart 4
| Percentage that allowed parents to telework or work remotely | Percentage that allowed parents to change their schedule | Percentage that offered an extended leave of absence with reduced or no pay | |
|---|---|---|---|
| percent | |||
| All employment sizes | 27.5 | 41.8 | 21.5 |
| 1 to 4 employees | 21.3 | 29.6 | 12.8 |
| 5 to 19 employees | 27.8 | 50.2 | 24.9 |
| 20 to 99 employees | 38.3 | 55.9 | 35.5 |
| 100 or more employees | 60.6 | 63.9 | 44.1 |
|
Note: Respondents were asked to report what actions or measures the business or organization provided to parents employed by the business. Respondents that selected that they expected schools and childcare facilities in the area to have a normal schedule, or that all work can be performed on a flexible schedule, were excluded from calculations. Source: Canadian Survey on Business Conditions: Impact of COVID-19 on businesses in Canada (Table 33-10-0278-01). |
|||
Methodology
From September 15th to October 23rd, representatives from businesses across Canada were invited to take part in an online questionnaire about how COVID-19 is affecting their business. This iteration of the Canadian Survey on Business Conditions used a stratified random sample of business establishments with employees classified by geography, industry sector, and size. Estimation of proportions is done using calibrated weights to calculate the population totals in the domains of interest.
References
Statistics Canada - Canadian Survey on Business Conditions: Impact of COVID-19 on businesses in Canada, third quarter 2020
- Date modified: