
Economic and Social Reports
From research labs to departure gates: Retention and labour market outcomes of foreign postdoctoral fellows in Canada

DOI: https://doi.org/10.25318/36280001202600600005-eng
Text begins
Abstract
Using data from the Longitudinal Immigration Database, this article examines recent trends in the admission, retention and labour market outcomes of foreign postdoctoral fellows in Canada. Foreign postdoctoral fellows are identified as individuals whose first Canadian work permit was issued under the Labour Market Impact Assessment exemption code designated for postdoctoral appointments within the International Mobility Program (IMP). Their outcomes are compared with those of other IMP work permit holders, Temporary Foreign Worker Program participants and immigrants who entered Canada directly as permanent residents.
The analysis shows that annual inflows of foreign postdoctoral fellows fluctuated between 2,000 and 3,300 in the 2000s and 2010s but decreased from 2021 to 2024. About 28% of foreign postdoctoral fellows who received their first work permit in the 2000-to-2004 period obtained permanent residency within 10 years of their first arrival. This rate decreased to 22% for 2010-to-2014 arrivals. Among those who became permanent residents, active presence in Canada—as measured by income tax filing—declined gradually over time.
Despite relatively low long-term retention, foreign postdoctoral fellows who remained actively present and employed in Canada exhibited strong labour market outcomes after obtaining permanent residency. Both observed and regression-adjusted earnings were higher than those of other immigrant groups in the initial years following admission and over the longer term.
These findings are consistent with the internationally mobile nature of postdoctoral labour markets and highlight the importance of interpreting retention outcomes within the context of globally connected research careers.
Authors
Feng Hou is with the Economic and Social Analysis and Modelling Division, Analytical Studies and Modelling Branch, at Statistics Canada.
Acknowledgements
The author would like to thank Youssouf Azmi, Mark Kinack, Alda Kokallaj and Zofia Olszowka for their advice and comments on an earlier version of this article.
Introduction
In recent years, advanced economies have increasingly relied on the global circulation of research talent to sustain innovation and scientific competitiveness. Postdoctoral researchers, many of whom are foreign-born and hold temporary resident status, play a pivotal role in advancing scientific knowledge and maintaining the productivity and vitality of research institutions (Kahn & MacGarvie, 2024; Youyou & Feng, 2025). Postdoctoral fellows often lead independent projects, collaborate across disciplines, support graduate training, and contribute significantly to scientific publications and knowledge dissemination. As such, they are indispensable in pushing scientific boundaries and addressing complex societal challenges through research innovation and interdisciplinary approaches.
The nature of postdoctoral appointments is inherently temporary and transitional. These positions are often designed as fixed-term engagements, typically lasting a few years, during which postdoctoral researchers gain additional training and experience critical for pursuing further academic or other careers. The temporary nature of these roles underscores the importance of mobility—disciplinary, institutional and geographic. Postdoctoral researchers often relocate internationally or transnationally to pursue these opportunities, following specialized programs or funding schemes that encourage cross-border knowledge exchange (OECD, 2021; Thomas, 2025).
Canada has actively sought to attract foreign postdoctoral fellows through a mix of targeted research funding and immigration policies that facilitate high-skill mobility. Federally, the tri-council’s prestigious, internationally open fellowships signal a commitment to global talent and integrate postdoctoral fellows into major research programs (Government of Canada, n.d.). These funding streams are paired with some immigration pathways that enable universities to recruit foreign postdoctoral fellows. People with postdoctoral appointments qualify for temporary work permits under the International Mobility Program (IMP) (IRCC, n.d.). Their Canadian work experience can also support later transitions to permanent residency. Together, these measures create a policy environment that lowers administrative barriers, expands research opportunities and enhances Canada’s appeal as a destination for internationally trained postdoctoral scholars.
From a policy perspective, understanding the retention of foreign postdoctoral fellows and their labour market outcomes after obtaining permanent residency is essential to informing both immigration and research strategy. In particular, the issue of postdoctoral retention intersects with broader debates about “brain circulation” versus “brain drain.” While Canada benefits from attracting foreign postdoctoral fellows, ensuring their long-term stay and labour market success is critical for realizing the durable economic and scientific gains they can generate. Studies in the United States, the United Kingdom and the European Union have documented difficulties in converting temporary research mobility into permanent settlement, often attributing low retention to precarious employment conditions, limited career progression and restrictive immigration pathways (Aksenfeld & Ahart, 2025; OECD, 2021; Stephan, 2012). Yet systematic evidence for Canada remains scarce.
This article addresses this gap by examining recent trends in the admission, retention and labour market outcomes of foreign postdoctoral researchers admitted to Canada as temporary foreign workers under the IMP. Foreign postdoctoral fellows are identified as individuals whose first work permit was issued under the Labour Market Impact Assessment exemption code designated for postdoctoral fellows (C44). To be eligible for this program, a foreign national “must be appointed to a time-limited position in a field related to that in which they earned, or are earning, their PhD; be receiving a stipend or salary to compensate for periods of teaching, advanced study or research; [and] be chosen on the basis of academic excellence” (IRCC, n.d.). Work permits in this program are employer-specific, such that permit holders are authorized to work only for the sponsoring employer.
The analysis also compares foreign postdoctoral fellows with other IMP work permit holders and Temporary Foreign Worker Program (TFWP)Note participants to assess differences in their retention patterns and labour market outcomes. The comparison of labour market outcomes also includes permanent residents who were admitted directly from abroad.
Declining inflows and changing countries of origin
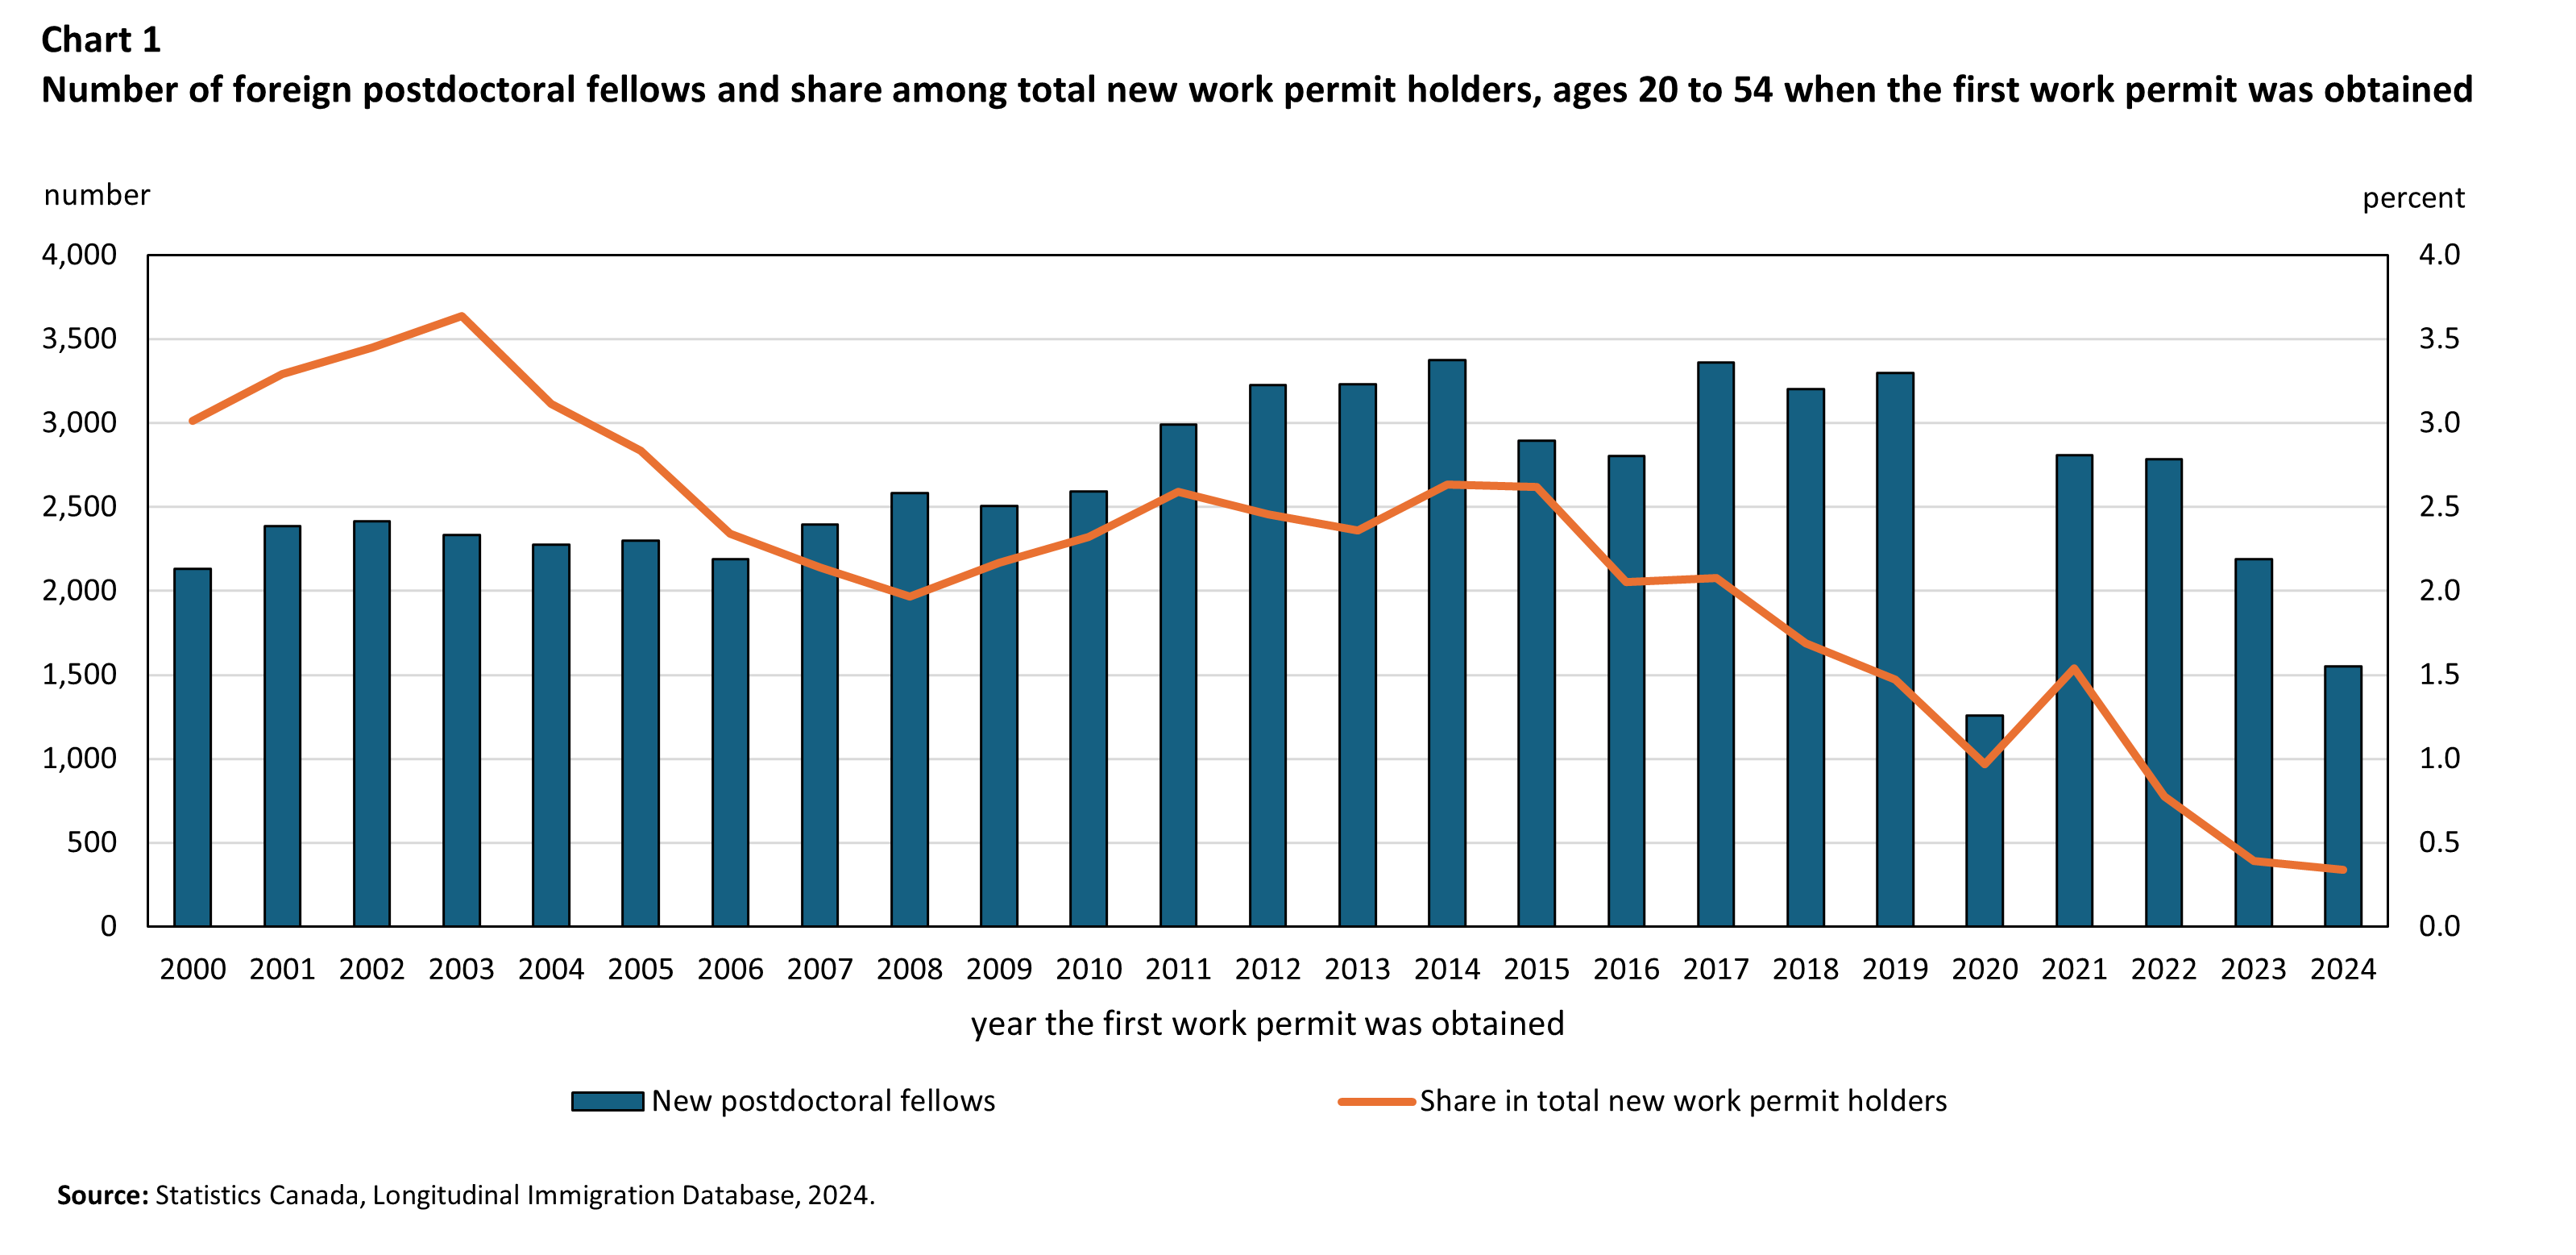
In the 2000s and 2010s, the number of foreign postdoctoral fellows entering Canada as temporary foreign workers fluctuated between 2,100 and 3,400 annually (Chart 1). However, after a recovery from a sharp decline in 2020 during the height of the COVID-19 pandemic, there appears to be a downward trend. From 2021 to 2024, inflows fell to levels below those observed in the early 2000s.Note
It is useful to situate trends in foreign postdoctoral fellows within the broader evolution of Canada’s temporary foreign worker population. While the inflow of foreign postdoctoral fellows has decreased in recent years, the number of other temporary foreign workers has increased substantially, particularly since the mid-2010s. As a result, the share of foreign postdoctoral fellows among all temporary work permit holders for work purposes (including both TFWP and IMP work permits) declined from about 3% in the early 2000s to roughly 0.3% in 2024 (Chart 1). The large decline in the relative share of postdoctoral fellows primarily reflects broader growth in other temporary foreign worker categories.
Data table for Chart 1
| New postdoctoral fellows | Share in total new work permit holders | |
|---|---|---|
| Source: Statistics Canada, Longitudinal Immigration Database, 2024 | ||
| 2000 | 2130 | 3.0 |
| 2001 | 2386 | 3.3 |
| 2002 | 2413 | 3.5 |
| 2003 | 2335 | 3.6 |
| 2004 | 2274 | 3.1 |
| 2005 | 2302 | 2.8 |
| 2006 | 2189 | 2.3 |
| 2007 | 2394 | 2.1 |
| 2008 | 2581 | 2.0 |
| 2009 | 2508 | 2.2 |
| 2010 | 2592 | 2.3 |
| 2011 | 2992 | 2.6 |
| 2012 | 3225 | 2.5 |
| 2013 | 3231 | 2.4 |
| 2014 | 3376 | 2.6 |
| 2015 | 2894 | 2.6 |
| 2016 | 2806 | 2.1 |
| 2017 | 3362 | 2.1 |
| 2018 | 3201 | 1.7 |
| 2019 | 3299 | 1.5 |
| 2020 | 1260 | 1.0 |
| 2021 | 2811 | 1.5 |
| 2022 | 2787 | 0.8 |
| 2023 | 2191 | 0.4 |
| 2024 | 1550 | 0.3 |
A similar pattern emerges when examining the contribution of foreign postdoctoral fellows to the supply of doctorate-level labour in Canada. From 2010 to 2023, the annual number of Canadian-educated new graduates with a doctoral or equivalent degree rose from 5,950 to 8,810 (Statistics Canada, n.d.). Correspondingly, the ratio of foreign postdoctoral fellows to Canadian-educated doctorate holders decreased from 0.44 in 2010 to 0.25 in 2023. This suggests that foreign postdoctoral fellows have been an important source for the doctoral-educated labour force in Canada, though their relative importance has declined.
In terms of sociodemographic characteristics, most foreign postdoctoral fellows were men, although their share declined from 70% in the 2000-to-2004 arrival cohort to 60% in the 2020-to-2024 cohort (Table 1). Across cohorts, 47% to 58% of postdoctoral fellows were aged 30 to 39, and 30% to 46% were aged 20 to 29.
Foreign postdoctoral fellows came from increasingly diverse source regions (Table 1). Eastern Asia and Northern and Western Europe have long been the two leading source regions, but their combined share decreased from 57% in the 2000-to-2004 cohort to 40% in the 2020-to-2024 cohort. The share from Southern and Eastern Europe also declined, while a growing proportion of postdoctoral fellows arrived from Southern Asia, the Caribbean and Central and South America, Africa, and the United States.
| Issue year of first work permit | ||||||||||
|---|---|---|---|---|---|---|---|---|---|---|
| 2000 to 2004 | 2005 to 2009 | 2010 to 2014 | 2015 to 2019 | 2020 to 2024 | ||||||
| number | ||||||||||
|
||||||||||
| Total number of new postdoctoral fellows | 11540 | 11970 | 15420 | 15560 | 10600 | |||||
| percent Table 1 Note 2 | ||||||||||
| Gender Table 1 Note 1 | ||||||||||
| Men | 69.6 | 66.7 | 62.3 | 59.6 | 59.5 | |||||
| Women | 30.4 | 33.3 | 37.7 | 40.4 | 40.5 | |||||
| Age group | ||||||||||
| 20 to 29 | 30.1 | 37.4 | 46.3 | 43.8 | 33.8 | |||||
| 30 to 39 | 53.2 | 51.5 | 46.5 | 49.3 | 57.8 | |||||
| 40 to 54 | 16.7 | 11.1 | 7.3 | 7.0 | 8.3 | |||||
| Source Region | ||||||||||
| United States | 3.5 | 4.6 | 4.8 | 5.7 | 6.1 | |||||
| Caribbean and Central and South America | 6.9 | 8.5 | 16.4 | 15.5 | 13.2 | |||||
| Northern and Western Europe | 24.1 | 24.6 | 22.2 | 16.5 | 17.1 | |||||
| Southern and Eastern Europe | 12.1 | 13.2 | 9.2 | 8.2 | 7.7 | |||||
| Africa | 3.8 | 5.6 | 8.8 | 5.3 | 7.6 | |||||
| Southern Asia | 5.0 | 8.5 | 8.3 | 8.8 | 12.2 | |||||
| Southeastern Asia | 1.9 | 2.5 | 2.2 | 1.7 | 2.1 | |||||
| Eastern Asia | 32.4 | 25.1 | 20.3 | 29.8 | 23.2 | |||||
| Western Asia | 8.3 | 5.8 | 6.3 | 7.2 | 9.7 | |||||
| Other regions | 2.3 | 1.6 | 1.5 | 1.3 | 1.1 | |||||
About one in four foreign postdoctoral fellows obtained permanent residency within 10 years
Foreign postdoctoral fellows can remain in Canada in the long term either by obtaining permanent residency or by continuing to hold temporary residency permits (work, study or another temporary residency permit). Among those who first arrived from 2000 to 2014, a moderate proportion obtained permanent residency, and few maintained temporary residency in Canada after 10 yearsNote (Table 2).
Specifically, 10 years after receiving their first work permit under the category for postdoctoral fellows, 28% of the 2000-to-2004 cohort had become permanent residents. This share changed to 26% for the 2005-to-2009 cohort and further declined to 22% for the 2010-to-2014 cohort (Table 2). For the two earliest cohorts, for whom additional years of information are available, cumulative permanent residency rates increased only slightly beyond the 10-year mark—gaining 1 percentage point by the 15th year.
These trends contrast with those of other temporary foreign workers. Among other IMP work permit holders, the 10-year cumulative rate of obtaining permanent residency rose from 15% for the 2000-to-2004 cohort to 25% for the 2005-to-2009 cohort, and then to 28% for the 2010-to-2014 cohort (data not shown). For TFWP work permit holders, the 10-year cumulative rate increased from 29% to 48% and then to 49% across the three cohorts (data not shown). Previous studies suggest that group differences in transition rates to permanent residency among temporary foreign workers are jointly shaped by motivations and opportunities (Prokopenko & Hou, 2018). While opportunities have generally expanded as Canada increasingly selects permanent residents from the temporary foreign worker population, motivations to pursue permanent residency among foreign postdoctoral fellows may have weakened over time.
| Years since the first work permit |
Cumulative rate of obtaining permanent residency (Issue year of first work permit) |
Percentage holding a valid non-permanent residency permit (Issue year of first work permit) |
||||||
|---|---|---|---|---|---|---|---|---|
| 2000 to 2004 | 2005 to 2009 | 2010 to 2014 | 2015 to 2019 | 2000 to 2004 | 2005 to 2009 | 2010 to 2014 | 2015 to 2019 | |
| percent | ||||||||
|
||||||||
| 1 | 3.9 | 3.3 | 1.4 | 1.8 | 81.0 | 84.3 | 78.3 | 81.3 |
| 2 | 9.7 | 8.6 | 4.1 | 7.9 | 45.8 | 51.7 | 49.1 | 46.5 |
| 3 | 16.0 | 15.1 | 9.5 | 13.2 | 25.8 | 30.0 | 29.1 | 25.9 |
| 4 | 20.8 | 19.6 | 14.1 | 17.0 | 14.5 | 17.1 | 17.0 | 15.5 |
| 5 | 23.5 | 22.2 | 16.8 | 19.5 | 9.3 | 10.8 | 10.9 | 9.7 |
| 6 | 24.9 | 23.8 | 18.5 | .. not available for a specific reference period | 6.6 | 7.3 | 7.3 | .. not available for a specific reference period |
| 7 | 26.0 | 24.8 | 19.6 | .. not available for a specific reference period | 4.8 | 5.2 | 5.1 | .. not available for a specific reference period |
| 8 | 26.6 | 25.5 | 20.6 | .. not available for a specific reference period | 3.8 | 3.9 | 3.6 | .. not available for a specific reference period |
| 9 | 27.1 | 26.0 | 21.2 | .. not available for a specific reference period | 3.0 | 3.0 | 2.5 | .. not available for a specific reference period |
| 10 | 27.5 | 26.3 | 21.6 | .. not available for a specific reference period | 2.4 | 2.2 | 1.8 | .. not available for a specific reference period |
| 11 | 27.8 | 26.6 | .. not available for a specific reference period | .. not available for a specific reference period | 2.0 | 1.7 | .. not available for a specific reference period | .. not available for a specific reference period |
| 12 | 28.0 | 26.9 | .. not available for a specific reference period | .. not available for a specific reference period | 1.7 | 1.3 | .. not available for a specific reference period | .. not available for a specific reference period |
| 13 | 28.2 | 26.9 | .. not available for a specific reference period | .. not available for a specific reference period | 1.4 | 1.1 | .. not available for a specific reference period | .. not available for a specific reference period |
| 14 | 28.3 | 27.1 | .. not available for a specific reference period | .. not available for a specific reference period | 1.1 | 0.8 | .. not available for a specific reference period | .. not available for a specific reference period |
| 15 | 28.4 | 27.2 | .. not available for a specific reference period | .. not available for a specific reference period | 0.9 | 0.6 | .. not available for a specific reference period | .. not available for a specific reference period |
Among foreign postdoctoral fellows, men and women had similar rates of obtaining permanent residency, based on five-year cumulative rates (Table 3). Those aged 30 to 39 when they received their first work permit had higher rates than the 20 to 29 and 40 to 54 age groups. The 20 to 29 age group had the lowest rates and showed a clear trend of decline across cohorts, but they had a slightly higher rate of holding non-permanent residency permits than the two older age groups.
Across major source regions, those from Africa, Southern Asia and Western Asia tended to have the highest rates of obtaining permanent residency, while those from the United States and from the Caribbean and Central and South America tended to have the lowest rates. Postdoctoral fellows from Eastern Asia showed a steady decline in the five-year cumulative rates, from 28% for the 2000-to-2004 cohort to 9% for the 2015-to-2019 cohort, which was the lowest rate in that cohort. This large decline was linked to the growing proportions of postdoctoral fellows from China and the steady decrease in their rates of obtaining permanent residency, likely responding to rising academic and other work opportunities in China.Note
| Cumulative rate of obtaining permanent residency (Issue year of first work permit) |
Percentage holding a valid non-permanent residency permit (Issue year of first work permit) |
|||||||
|---|---|---|---|---|---|---|---|---|
| 2000 to 2004 | 2005 to 2009 | 2010 to 2014 | 2015 to 2019 | 2000 to 2004 | 2005 to 2009 | 2010 to 2014 | 2015 to 2019 | |
| Source: Statistics Canada, Longitudinal Immigration Database, 2024. | ||||||||
| percent | ||||||||
| Gender | ||||||||
| Men | 23.0 | 21.9 | 16.4 | 19.2 | 9.5 | 10.9 | 11.5 | 10.0 |
| Women | 24.6 | 22.7 | 17.3 | 19.9 | 8.8 | 10.6 | 10.0 | 9.2 |
| Age when the first work permit was obtained | ||||||||
| 20 to 29 | 17.9 | 17.3 | 10.4 | 9.3 | 6.6 | 6.1 | 7.0 | 6.2 |
| 30 to 39 | 28.0 | 26.8 | 22.8 | 25.9 | 3.7 | 4.9 | 4.3 | 3.8 |
| 40 to 54 | 21.6 | 22.1 | 15.1 | 16.6 | 3.3 | 2.5 | 2.6 | 4.3 |
| Source region | ||||||||
| United States | 17.1 | 12.7 | 10.2 | 14.9 | 8.3 | 7.3 | 5.0 | 5.0 |
| Caribbean and Central and South America | 17.6 | 16.3 | 8.7 | 14.9 | 7.1 | 6.7 | 6.2 | 6.8 |
| Northern and Western Europe | 18.2 | 19.2 | 16.5 | 19.0 | 5.3 | 6.0 | 5.1 | 3.4 |
| Southern and Eastern Europe | 22.4 | 19.9 | 19.0 | 18.6 | 4.8 | 4.7 | 4.0 | 3.7 |
| Africa | 48.0 | 40.0 | 22.0 | 33.6 | 3.0 | 2.8 | 6.1 | 8.4 |
| Southern Asia | 37.3 | 35.1 | 25.7 | 37.6 | 3.9 | 3.6 | 3.3 | 5.0 |
| Southeastern Asia | 18.0 | 16.6 | 14.1 | 23.1 | 6.8 | 4.4 | 3.8 | 5.4 |
| Eastern Asia | 28.0 | 24.7 | 16.8 | 9.3 | 2.5 | 4.1 | 5.2 | 3.5 |
| Western Asia | 22.8 | 31.2 | 27.9 | 35.9 | 4.1 | 5.1 | 7.4 | 7.6 |
| Other regions | 10.1 | 16.6 | 15.6 | 20.6 | 9.7 | 4.8 | 5.5 | 5.5 |
About 70% of foreign postdoctoral fellows remained actively present in Canada 10 years after obtaining permanent residency
While obtaining permanent residency grants immigrants the right to stay and work in Canada indefinitely, not all permanent residents are actively present in Canada each year. Table 4 presents the income tax-filing rates of former foreign postdoctoral fellows who became permanent residents by years since becoming permanent residents.Note This measure has been used to indicate immigrants’ active presence in Canada (Hou, 2024).
Across cohorts, about 86% to 89% of former postdoctoral fellows filed income taxes in the first full calendar year after admission (Table 4). This rate declined to 78% to 82% 5 years after admission, and further to 69% to 74% 10 years after admission. No clear upward or downward trend was observed across successive admission cohorts.
These 10-year tax-filing rates were generally lower than those of other former temporary foreign workers. Among other IMP participants who became permanent residents, the 10-year tax-filing rate rose from 75% for the 2000-to-2004 cohort to 82% for the 2010-to-2014 cohort (data not shown). For former TFWP workers, the 10-year rate increased from 85% to 91% across cohorts. For immigrants who had not been temporary residents prior to admission (one-step immigrants), the rate increased from 80% to 83% (data not shown).
| Years since admission |
Year of permanent residency admission | |||
|---|---|---|---|---|
| 2000 to 2004 | 2005 to 2009 | 2010 to 2014 | 2015 to 2019 | |
| percent | ||||
|
||||
| 1 | 89.4 | 86.7 | 85.9 | 88.4 |
| 2 | 88.4 | 84.7 | 84.0 | 86.5 |
| 3 | 86.6 | 82.8 | 82.8 | 84.8 |
| 4 | 83.6 | 80.3 | 81.9 | 83.4 |
| 5 | 81.7 | 78.4 | 79.3 | 80.9 |
| 6 | 79.7 | 76.5 | 76.8 | .. not available for a specific reference period |
| 7 | 77.8 | 74.7 | 75.2 | .. not available for a specific reference period |
| 8 | 76.3 | 72.8 | 73.8 | .. not available for a specific reference period |
| 9 | 75.0 | 71.0 | 72.3 | .. not available for a specific reference period |
| 10 | 74.2 | 69.2 | 70.2 | .. not available for a specific reference period |
| 11 | 72.5 | 68.2 | .. not available for a specific reference period | .. not available for a specific reference period |
| 12 | 71.4 | 67.0 | .. not available for a specific reference period | .. not available for a specific reference period |
| 13 | 69.9 | 66.2 | .. not available for a specific reference period | .. not available for a specific reference period |
| 14 | 68.9 | 65.4 | .. not available for a specific reference period | .. not available for a specific reference period |
| 15 | 68.1 | 64.5 | .. not available for a specific reference period | .. not available for a specific reference period |
Foreign postdoctoral fellows had higher earnings than other immigrants
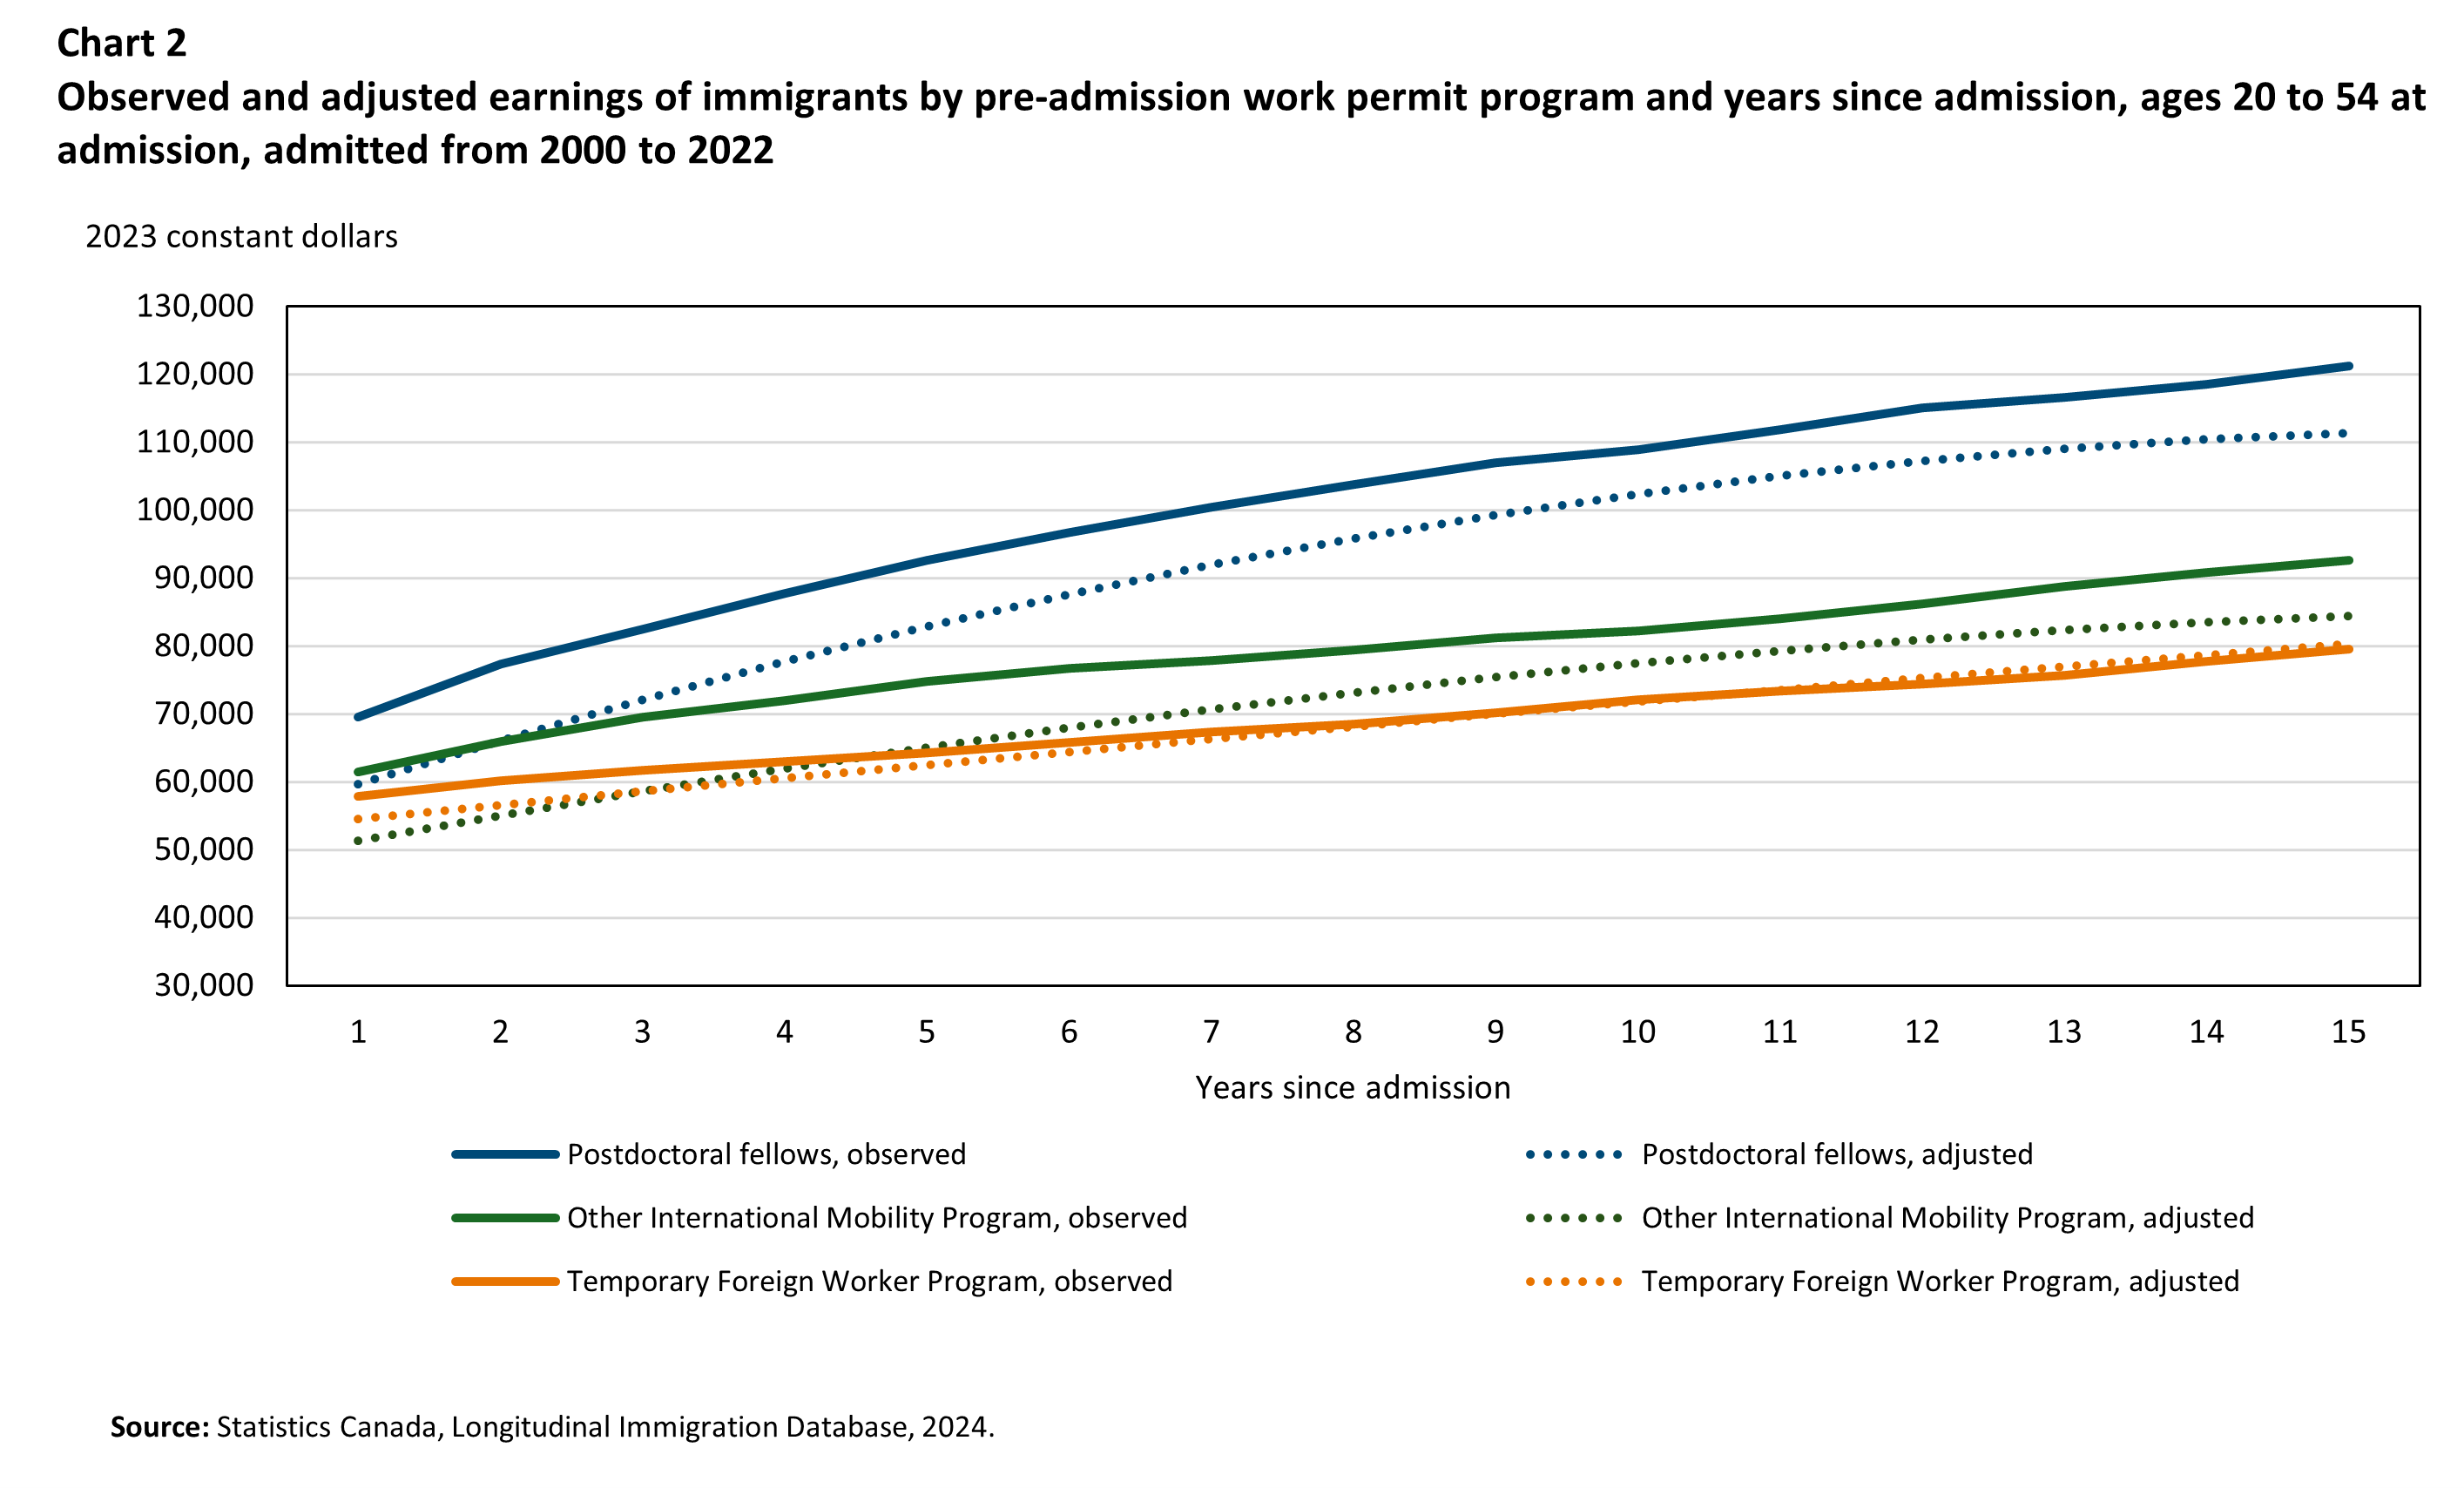
Among immigrants who remained actively present and employed in Canada, former postdoctoral fellows earned more annually than other immigrants both in the initial years after admission and over the longer term. Chart 2 compares observed and adjusted annual earnings (total employment income in 2023 constant dollars) from year 1 to year 15 after admission. Adjusted earnings are estimated from a regression model that controls for differences in sociodemographic characteristics between former postdoctoral fellows and people in other immigrant groups.Note
Data table for Chart 2
| Postdoctoral fellows, | Other International Mobility Program, | Temporary Foreign Worker Program, | ||||
|---|---|---|---|---|---|---|
| observed | adjusted | observed | adjusted | observed | adjusted | |
| Source: Statistics Canada, Longitudinal Immigration Database, 2024. | ||||||
| 1 | 69560 | 59679 | 61520 | 51302 | 57896 | 54555 |
| 2 | 77366 | 66112 | 65952 | 55077 | 60234 | 56597 |
| 3 | 82472 | 72122 | 69515 | 58636 | 61660 | 58607 |
| 4 | 87749 | 77712 | 71979 | 61978 | 62997 | 60586 |
| 5 | 92632 | 82879 | 74791 | 65103 | 64293 | 62533 |
| 6 | 96734 | 87626 | 76727 | 68012 | 65799 | 64448 |
| 7 | 100405 | 91951 | 77814 | 70704 | 67402 | 66333 |
| 8 | 103847 | 95854 | 79424 | 73180 | 68508 | 68185 |
| 9 | 106932 | 99336 | 81188 | 75439 | 70221 | 70006 |
| 10 | 108876 | 102396 | 82219 | 77481 | 72103 | 71796 |
| 11 | 111863 | 105035 | 83973 | 79307 | 73400 | 73554 |
| 12 | 115044 | 107253 | 86263 | 80916 | 74352 | 75281 |
| 13 | 116618 | 109049 | 88798 | 82308 | 75729 | 76976 |
| 14 | 118573 | 110423 | 90847 | 83484 | 77751 | 78640 |
| 15 | 121200 | 111376 | 92674 | 84443 | 79536 | 80272 |
Former postdoctoral fellows had higher observed and adjusted earnings than other former IMP work permit holders, by about 15% in the first full year after admission. This gap widened to approximately 31% eight years after admission and changed little thereafter. Former postdoctoral fellows earned approximately 20% more than former TFWP work permit holders in observed earnings and about 9% more in adjusted earnings in the first full year after admission. These gaps widened to roughly 51% and 43%, respectively, by the 10th year and changed little by the 15th year. Former postdoctoral fellows earned roughly twice as much as one-step immigrants from year 1 to year 15 after admission. This gap narrowed to about 80% after adjustment for sociodemographic differences.
Conclusion
This study examined recent trends in the admission, retention and labour market outcomes of foreign postdoctoral fellows in Canada, comparing them with other temporary and permanent resident groups. The results show that inflows of foreign postdoctoral fellows have declined in recent years, and their shares among temporary foreign workers and within the supply of doctorate-level labour have declined considerably. Rates of transition to permanent residency among foreign postdoctoral fellows 10 years after receiving their first work permit decreased from 28% for the 2000-to-2004 arrivals to 22% for the 2010-to-2014 arrivals. Among those who became permanent residents, active presence in Canada (as measured by tax-filing rates) decreased gradually over time. Nevertheless, among individuals who remained actively present and employed, former postdoctoral fellows earned substantially more than other immigrant groups both in the early years after admission and over the longer term, even after controlling for sociodemographic characteristics.
These patterns are consistent with the institutional and labour market context in which postdoctoral training occurs. Postdoctoral appointments are typically time-limited and embedded in internationally connected research systems, where geographic mobility is common and often expected. As a result, lower rates of long-term retention among former postdoctoral fellows likely reflect the highly international nature of advanced research labour markets rather than weaker labour market integration. In this context, mobility following postdoctoral training may represent career progression within global academic and research networks, with Canadian research institutions serving as important, though often temporary, nodes in these trajectories.
From a policy perspective, the findings suggest that retention indicators alone may not fully capture the contribution of foreign postdoctoral fellows to Canada’s research ecosystem. While permanent settlement remains one possible pathway, the economic and scientific benefits associated with postdoctoral fellows may also accrue through shorter-term participation in Canadian research institutions and subsequent international mobility. Immigration and research policies that support flexibility across temporary residency, permanent residency and onward mobility may therefore be well aligned with the structure of postdoctoral careers.
References
Aksenfeld, R., & Ahart, J. (2025). Meet the early-career scientists planning to leave the United States. Nature, d41586-025-01900–01908.
Government of Canada. (2022). Public Policy facilitating entry into Canada for short term work. Access February 3, 2025.
Government of Canada. (n.d.). Scholarships. Access November 20, 2025.
Hou, F. (2024). Active presence of immigrants in Canada: Recent trends in tax filing and employment incidence. Economic and Social Reports, 4(5), 1–7.
IRCC (Immigration, Refugees and Citizenship Canada). (n.d.). Post-doctoral fellows awarded a Doctor of Philosophy (PhD) – [R205(c)(ii) – C44] – Canadian interest – International Mobility Program. Access October 18, 2025.
Kahn, S., & MacGarvie, M. (2024). New evidence on international postdocs in the US: Less pay, different experiences. Research Policy, 53(9), 105077.
OECD (Organisation for Economic Co-operation and Development). (2021). Reducing the precarity of academic research careers. Access November 19, 2025.
Prokopenko, E., & Hou, F. (2018). How temporary were Canada’s temporary foreign workers? Population and Development Review, 44(2), 257–280.
Statistics Canada. (n.d.). Postsecondary graduates, by detailed field of study. Access December 19, 2025.
Stephan, P. E. (2012). How Economics Shapes Science. Cambridge, MA: Harvard University Press.
Thomas, R. (2025). From Promise to Precarity: The Plight of International Postdocs — When Will Academia Act? Access November 19, 2025.
Youyou, W., & Feng, K. (2025). Rethinking postdoc careers through the science of science. Proceedings of the National Academy of Sciences, 122(9), e2500344122.
- Date modified: