
Economic and Social Reports
National and provincial retention of graduates from health degree programs in Canada

DOI: https://doi.org/10.25318/36280001202600200002-eng
Text begins
Acknowledgments
The authors would like to thank Katie Scrim, Huda Masoud, Tara Hahmann, Laura Gibson-MacGregor and Youssouf Azmi for their feedback on an earlier version of this paper.
A shortage of health care professionals, especially family doctors and nurses, has been a widespread concern from coast to coast to coast (Baumann and Crea-Arsenio, 2023; Gomes and Gillis, 2025). Among various causes of this shortage, a net loss of medical professionals, such as physicians and nurses, to the United States because of trade agreements was considered an important issue during the 1990s (Zhao, Drew and Murray, 2000). Few studies have examined recent trends in the retention of health care professionals. In particular, questions remain about whether outmigration pressures continue to exert influence and how retention varies across specialties and regions.
While national retention of health care workers is crucial for the country, retaining health degree graduates within the regions where they trained is viewed as equally essential for tackling regional shortages in the health care workforce (Landry et al., 2011). Retaining health graduates in their province of study helps increase the local supply of health care professionals to the region. At the same time, interprovincial migration of health graduates can alleviate shortages in regions that do not supply enough health care workers to meet their needs.
This article aims to examine health graduates’ retention in Canada and in their province of study during the first few years after completing Canadian postsecondary programs, relying on data from the Postsecondary Student Information System (PSIS) and T1 Family File (T1FF). The analysis focuses on Canadian and international graduates from health degree programs (bachelor’s, master’s and doctoral degrees) at provincially funded universities and colleges in Canada from 2010 to
Following the approach used in previous studies (Choi and Hou, 2025; Hou, 2024), this article considers a person who appeared in the T1FF in a given calendar year as present in Canada in that year. Graduates who file an individual (T1) income tax return in Canada appear in the T1FF. This article uses information on whether a person appeared in the T1FF to proxy for the person’s presence in
To measure national retention of graduates in Canada, the percentages of graduates who filed tax returns up to 10 years after graduation were calculated. The main analysis is based on retention three years after graduation. For regional retention of graduates, the region of residence in their tax returns three years after graduation was compared with their province of study and home province at the time of
Fields of study were grouped into four categories (medicine, dentistry and optometry; nursing; pharmacy and related programs; and health care, not elsewhere classified
The immigrant status of students in Canada was measured at the time of graduation. Canadian students include Canadian citizens and permanent residents. International graduates accounted for a very small percentage of graduates from health degree programs, ranging from 2% to 4% since 2010. While graduates’ national retention was analyzed separately for Canadian and international graduates, analysis of regional retention was limited to Canadian graduates because of the small sample size of international graduates.
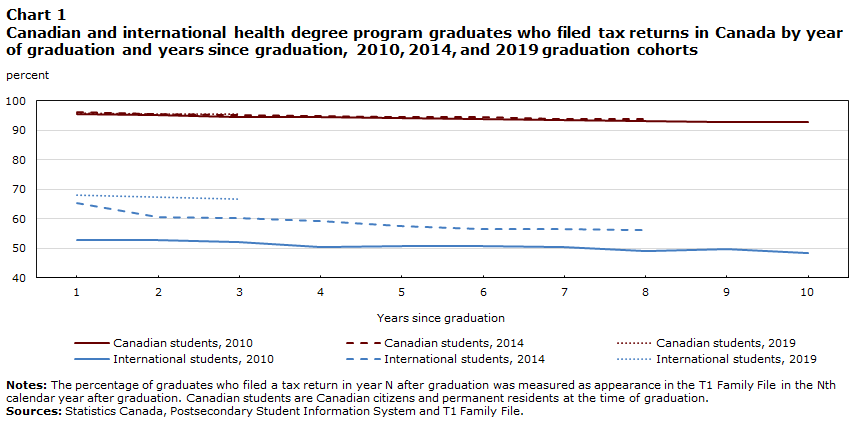
Data table for Chart 1
| Graduation year | Years since graduation | |||||||||
|---|---|---|---|---|---|---|---|---|---|---|
| 1 | 2 | 3 | 4 | 5 | 6 | 7 | 8 | 9 | 10 | |
| percent | ||||||||||
Sources: Statistics Canada, Postsecondary Student Information System and T1 Family File. |
||||||||||
| Canadian students | ||||||||||
| 2010 | 95.5 | 95.0 | 94.6 | 94.4 | 94.0 | 93.7 | 93.3 | 93.1 | 92.8 | 92.7 |
| 2014 | 96.0 | 95.6 | 95.1 | 94.9 | 94.4 | 94.3 | 93.9 | 93.8 | ... not applicable | ... not applicable |
| 2019 | 95.9 | 95.6 | 95.3 | ... not applicable | ... not applicable | ... not applicable | ... not applicable | ... not applicable | ... not applicable | ... not applicable |
| International students | ||||||||||
| 2010 | 52.9 | 52.9 | 52.2 | 50.5 | 50.8 | 50.8 | 50.5 | 49.2 | 49.8 | 48.5 |
| 2014 | 65.3 | 60.6 | 60.2 | 59.3 | 57.6 | 56.7 | 56.7 | 56.3 | ... not applicable | ... not applicable |
| 2019 | 67.9 | 67.4 | 66.6 | ... not applicable | ... not applicable | ... not applicable | ... not applicable | ... not applicable | ... not applicable | ... not applicable |
The percentage of health degree graduates who filed tax returns in Canada was higher than the average of all graduates
Chart 1 plots the percentage of Canadian and international students who graduated from health degree programs in 2010, 2014 and 2019. Among Canadian students who graduated in 2010, 96% appeared in the T1FF in the first year after graduation. This share slowly decreased to 95% in year 3 after graduation, 94% in year 5 and 93% in year 10. Canadian students who graduated in 2019 showed the same pattern during the first three years after graduation (96% in year 1 and 95% in year 3). The percentage of health graduates who appeared in the T1FF was higher than the average rate of Canadian graduates from degree programs in all fields of study (for the 2019 graduate cohort, the rate was 93% in year 1 and 92% in year 3; not presented in the chart).
Across graduation cohorts from 2010 to 2019, increasing shares of international student graduates from health degree programs filed tax returns in Canada. While 52% of the 2010 cohort of international students appeared in the T1FF three years after graduation, 68% of the 2019 cohort did so. This rate was above the average rate of all international graduates from degree programs in the 2019 cohort (58%; not presented in the chart).
Retention rates for health degree graduates showed small variations across different educational characteristics
The percentages of health graduates who appeared in the T1FF were disaggregated by field of study, degree level and province of study for two graduation cohorts (2010 to 2014 and 2015 to 2021) of Canadian and international students (Table 1). Among Canadians who graduated from 2015 to 2021, 96% of graduates from medicine, dentistry and optometry programs and nursing programs and 97% of graduates from pharmacy and related programs filed tax returns three years after graduation. These retention rates were higher than the average for graduates from all fields of study (91%). Canadian doctoral degree graduates (92%) were less likely to file tax returns in Canada than graduates from bachelor’s and master’s degree programs (95%). Tax filing rates varied narrowly across the provinces of study, ranging from 94% in Ontario to 97% in Quebec and Prince Edward Island.
Wider variations in tax filing rates were observed among international students. Among the 2015-to-2021 cohort, international graduates from pharmacy and related programs (64%) were more likely to remain in Canada three years after graduation than those from medicine, dentistry and optometry (44%) and nursing (52%) programs. International graduates’ tax filing rates varied greatly by province, ranging from 29% in Alberta to 86% in Manitoba. New Brunswick (85%) and Saskatchewan (84%) also showed high retention rates of international graduates, followed by British Columbia (69%) and Ontario (64%).
Among the 2015-to-2021 cohort of Canadian graduates, 96% of Canadian citizens filed tax returns in Canada three years after graduation. Among permanent residents, those from India (95%) and China (94%) had similar rates to Canadian citizens, while those from the United States (86%) had lower tax filing rates. International graduates (67% for Chinese students, 61% for Indian students and 34% for American students) had lower rates of tax filing than their permanent resident counterparts.
Comparing the 2010-to-2014 and 2015-to-2021 cohorts of Canadian graduates, national retention rates for medicine graduates increased (e.g., from 94% to 96% in year 1). Among international graduates, retention rates among nursing graduates declined across the two cohorts (e.g., from 70% to 52% in year 3), whereas retention rates among those from other health care programs (classified as health care, n.e.c.) showed a large increase (e.g., from 48% to 62% in year 3).
| Canadian students | International students | |||||||||
|---|---|---|---|---|---|---|---|---|---|---|
| 2010-to-2014 cohort |
2015-to-2021 cohort |
2010-to-2014 cohort |
2015-to-2021 cohort |
|||||||
| Year 1 | Year 3 | Year 5 | Year 1 | Year 3 | Year 1 | Year 3 | Year 5 | Year 1 | Year 3 | |
| percent | ||||||||||
Sources: Statistics Canada, Postsecondary Student Information System and T1 Family File. |
||||||||||
| All fields | 91.6 | 89.9 | 88.8 | 92.7 | 91.2 | 48.2 | 45.1 | 43.8 | 58.3 | 54.7 |
| Health total | 95.7 | 94.8 | 94.2 | 95.9 | 95.4 | 59.3 | 55.7 | 53.4 | 63.9 | 57.0 |
| Field of study | ||||||||||
| Medicine, dentistry and optometry | 94.3 | 94.7 | 94.7 | 96.0 | 96.2 | 47.8 | 41.5 | 39.0 | 48.1 | 43.5 |
| Medicine | 93.7 | 94.4 | 94.7 | 96.0 | 96.5 | 41.7 | 39.6 | 38.5 | 45.4 | 42.0 |
| Dentistry | 96.4 | 95.5 | 94.5 | 95.5 | 94.3 | x suppressed to meet the confidentiality requirements of the Statistics Act | x suppressed to meet the confidentiality requirements of the Statistics Act | x suppressed to meet the confidentiality requirements of the Statistics Act | x suppressed to meet the confidentiality requirements of the Statistics Act | x suppressed to meet the confidentiality requirements of the Statistics Act |
| Optometry | 97.7 | 96.7 | 95.2 | 97.4 | 96.5 | x suppressed to meet the confidentiality requirements of the Statistics Act | x suppressed to meet the confidentiality requirements of the Statistics Act | x suppressed to meet the confidentiality requirements of the Statistics Act | x suppressed to meet the confidentiality requirements of the Statistics Act | x suppressed to meet the confidentiality requirements of the Statistics Act |
| Nursing | 96.5 | 95.4 | 94.8 | 96.4 | 95.7 | 73.0 | 70.3 | 69.1 | 55.7 | 51.6 |
| Pharmacy and related programs | 97.8 | 97.1 | 96.3 | 97.2 | 96.9 | 72.5 | 65.7 | 63.7 | 68.6 | 64.2 |
| Health care, n.e.c. | 94.7 | 93.4 | 92.4 | 94.9 | 94.2 | 50.8 | 47.6 | 44.4 | 69.9 | 62.2 |
| Degree level | ||||||||||
| Bachelor's degree | 95.7 | 94.7 | 94.0 | 96.0 | 95.5 | 59.0 | 56.0 | 54.7 | 62.6 | 54.2 |
| Master's degree | 96.1 | 95.4 | 94.9 | 95.8 | 95.2 | 60.2 | 57.3 | 53.5 | 67.6 | 63.7 |
| Doctoral degree | 92.7 | 89.6 | 88.1 | 93.5 | 92.1 | 57.4 | 43.5 | 38.9 | 55.9 | 43.4 |
| Province of study | ||||||||||
| Newfoundland and Labrador | 97.1 | 96.2 | 96.2 | 96.6 | 96.2 | x suppressed to meet the confidentiality requirements of the Statistics Act | x suppressed to meet the confidentiality requirements of the Statistics Act | x suppressed to meet the confidentiality requirements of the Statistics Act | 93.0 | x suppressed to meet the confidentiality requirements of the Statistics Act |
| Prince Edward Island | x suppressed to meet the confidentiality requirements of the Statistics Act | 95.8 | 97.4 | 97.5 | 97.0 | x suppressed to meet the confidentiality requirements of the Statistics Act | x suppressed to meet the confidentiality requirements of the Statistics Act | x suppressed to meet the confidentiality requirements of the Statistics Act | 92.9 | x suppressed to meet the confidentiality requirements of the Statistics Act |
| Nova Scotia | 97.3 | 95.9 | 95.1 | 96.5 | 96.1 | 48.2 | 34.1 | 32.9 | 75.2 | 52.8 |
| New Brunswick | 98.5 | 96.8 | 96.5 | 96.9 | 96.5 | x suppressed to meet the confidentiality requirements of the Statistics Act | 77.1 | x suppressed to meet the confidentiality requirements of the Statistics Act | 83.8 | 84.5 |
| Quebec | 96.5 | 96.1 | 95.5 | 97.4 | 97.1 | 35.9 | 33.9 | 31.3 | 63.1 | 56.2 |
| Ontario | 94.5 | 93.2 | 92.5 | 94.7 | 94.2 | 62.6 | 61.7 | 58.0 | 69.8 | 64.2 |
| Manitoba | 97.4 | 96.5 | 95.9 | 97.3 | 96.3 | 80.7 | 75.4 | 77.2 | 92.7 | 86.0 |
| Saskatchewan | 96.2 | 96.3 | 95.7 | 96.9 | 95.7 | 87.5 | 84.1 | 84.1 | 86.6 | 84.4 |
| Alberta | 96.2 | 95.5 | 95.0 | 95.9 | 95.5 | 48.3 | 42.7 | 41.7 | 31.8 | 29.1 |
| British Columbia | 96.0 | 95.3 | 94.4 | 96.3 | 95.3 | 81.1 | 76.1 | 72.5 | 68.6 | 68.8 |
| Country of citizenship | ||||||||||
| Canada | 95.8 | 95.0 | 94.4 | 96.0 | 95.5 | ... not applicable | ... not applicable | ... not applicable | ... not applicable | ... not applicable |
| United States | 90.0 | 86.1 | 87.4 | 90.0 | 86.1 | 39.8 | 30.1 | 29.0 | 38.3 | 34.0 |
| China | 93.8 | 92.6 | 91.6 | 94.4 | 93.7 | 76.6 | 74.3 | 73.1 | 70.1 | 67.1 |
| India | 96.7 | 95.1 | 91.2 | 95.1 | 95.1 | 76.9 | 76.0 | 75.2 | 73.6 | 60.8 |
| Other | 94.4 | 92.2 | 90.1 | 94.9 | 93.9 | 59.5 | 56.8 | 53.8 | 62.4 | 57.1 |
Graduates from medicine, dentistry and optometry programs had lower regional retention rates compared with graduates from other health fields
The analysis of national retention among health degree program graduates revealed that most Canadian graduates remained in Canada after completing their studies. Building on this finding, the regional distribution of health graduates within Canada and their mobility in the early years after graduation were analyzed. Table 2 presents the percentage of graduates who stayed in their province of study three years after graduation among those who filed tax returns three years after graduation. The regional retention rates were broken down by their study characteristics and country of citizenship for Canadian and international students. At the aggregate level, health graduates’ regional retention rates were similar to the rates for all graduates.
When regional retention rates were disaggregated by field of study among Canadians who graduated from 2015 to 2019, graduates from medicine, dentistry and optometry programs (75%) had lower regional retention rates than graduates from other health fields—nursing (87%) and pharmacy and related programs (89%). International graduates showed similar patterns in retention rates by program, but at lower levels (56% for medicine, dentistry and optometry; 69% for nursing; and 80% for pharmacy and related programs).
Medical and dental school graduates may relocate to other provinces to begin their residency programs after graduation. For registered health professionals, including doctors, nurses and pharmacists, practising in another province usually requires additional steps, such as applying to the relevant college of physicians, nurses or pharmacists in their destination province.
Regional retention rates varied significantly by province of study. Among Canadian graduates, year 3 regional retention rates ranged from 50% in New Brunswick to 92% in Quebec. The Atlantic provinces (e.g., 62% for Nova Scotia and 70% for Prince Edward Island) and Alberta (71%) had lower retention rates than other provinces, such as Saskatchewan (78%), British Columbia (87%) and Ontario (89%).
Regional mobility patterns also differed by country of citizenship. Among the 2015-to-2019 cohort of Canadian students, 85% of Canadian citizens remained in their province of study, while 15% moved to another region within three years after graduation. Although permanent residents from China and India had overall tax filing rates similar to those of Canadian citizens, they were less likely to stay in their province of study (75% for those from India and 80% for those from China).
Among international students who remained in Canada, Indian graduates showed a lower level of regional retention than graduates from other countries. Half of the Indian graduates who stayed in Canada remained in their province of study (51%), while more than 70% of other international graduates did so (e.g., 79% of Chinese graduates and 70% of American graduates).
| Canadian students | International students | |||||||||||
|---|---|---|---|---|---|---|---|---|---|---|---|---|
| 2010-to-2014 cohort | 2015-to-2019 cohort | 2010-to-2014 cohort | 2015-to-2019 cohort | |||||||||
| Filed tax returns, total | Stayed in study province | Moved or not stated | Filed tax returns, total | Stayed in study province | Moved or not stated | Filed tax returns, total | Stayed in study province | Moved or not stated | Filed tax returns, total | Stayed in study province | Moved or not stated | |
| percent | ||||||||||||
Sources: Statistics Canada, Postsecondary Student Information System and T1 Family File. |
||||||||||||
| All fields | 89.9 | 85.3 | 14.7 | 91.2 | 86.6 | 13.4 | 45.1 | 75.8 | 24.2 | 54.7 | 79.2 | 20.8 |
| Health total | 94.8 | 83.4 | 16.6 | 95.4 | 84.5 | 15.5 | 55.7 | 70.6 | 29.4 | 57.0 | 73.7 | 26.3 |
| Field of study | ||||||||||||
| Medicine, dentistry and optometry | 94.7 | 74.6 | 25.3 | 96.2 | 75.4 | 24.6 | 41.5 | 67.1 | 32.9 | 43.5 | 55.5 | 44.5 |
| Medicine | 94.4 | 75.2 | 24.8 | 96.5 | 75.2 | 24.8 | 38.5 | x suppressed to meet the confidentiality requirements of the Statistics Act | x suppressed to meet the confidentiality requirements of the Statistics Act | 42.0 | x suppressed to meet the confidentiality requirements of the Statistics Act | x suppressed to meet the confidentiality requirements of the Statistics Act |
| Dentistry | 95.5 | 74.6 | 25.4 | 94.3 | 77.1 | 22.9 | x suppressed to meet the confidentiality requirements of the Statistics Act | x suppressed to meet the confidentiality requirements of the Statistics Act | x suppressed to meet the confidentiality requirements of the Statistics Act | x suppressed to meet the confidentiality requirements of the Statistics Act | x suppressed to meet the confidentiality requirements of the Statistics Act | x suppressed to meet the confidentiality requirements of the Statistics Act |
| Optometry | 96.7 | 65.0 | 35.0 | 96.5 | 71.7 | 28.3 | x suppressed to meet the confidentiality requirements of the Statistics Act | x suppressed to meet the confidentiality requirements of the Statistics Act | x suppressed to meet the confidentiality requirements of the Statistics Act | x suppressed to meet the confidentiality requirements of the Statistics Act | x suppressed to meet the confidentiality requirements of the Statistics Act | x suppressed to meet the confidentiality requirements of the Statistics Act |
| Nursing | 95.4 | 86.9 | 13.1 | 95.7 | 87.1 | 12.9 | 70.3 | 74.6 | 25.4 | 51.6 | 69.4 | 30.6 |
| Pharmacy and related programs | 97.1 | 86.8 | 13.2 | 96.9 | 89.2 | 10.8 | 65.7 | 62.7 | 37.3 | 64.2 | 80.2 | 19.8 |
| Health care, n.e.c. | 93.4 | 81.0 | 19.0 | 94.2 | 83.4 | 16.6 | 47.6 | 68.2 | 31.8 | 62.2 | 77.6 | 22.4 |
| Degree level | ||||||||||||
| Bachelor's degree | 94.7 | 85.8 | 14.2 | 95.5 | 86.9 | 13.1 | 56.0 | 72.9 | 27.1 | 54.2 | 72.6 | 27.4 |
| Master's degree | 95.4 | 75.5 | 24.5 | 95.2 | 77.4 | 22.6 | 57.3 | 66.7 | 33.3 | 63.7 | 75.8 | 24.2 |
| Doctoral degree | 89.6 | 78.8 | 21.2 | 92.1 | 80.0 | 20.0 | 43.5 | 70.2 | 29.8 | 43.4 | 69.8 | 30.2 |
| Province of study | ||||||||||||
| Newfoundland and Labrador | 96.2 | 70.2 | 29.8 | 96.2 | 67.2 | 32.8 | x suppressed to meet the confidentiality requirements of the Statistics Act | x suppressed to meet the confidentiality requirements of the Statistics Act | x suppressed to meet the confidentiality requirements of the Statistics Act | x suppressed to meet the confidentiality requirements of the Statistics Act | x suppressed to meet the confidentiality requirements of the Statistics Act | x suppressed to meet the confidentiality requirements of the Statistics Act |
| Prince Edward Island | 95.8 | 76.3 | 23.7 | 97.0 | 70.1 | 29.9 | x suppressed to meet the confidentiality requirements of the Statistics Act | x suppressed to meet the confidentiality requirements of the Statistics Act | x suppressed to meet the confidentiality requirements of the Statistics Act | x suppressed to meet the confidentiality requirements of the Statistics Act | x suppressed to meet the confidentiality requirements of the Statistics Act | x suppressed to meet the confidentiality requirements of the Statistics Act |
| Nova Scotia | 95.9 | 53.6 | 46.4 | 96.1 | 61.5 | 38.5 | 34.1 | x suppressed to meet the confidentiality requirements of the Statistics Act | x suppressed to meet the confidentiality requirements of the Statistics Act | 52.8 | 47.3 | 52.7 |
| New Brunswick | 96.8 | 57.5 | 42.5 | 96.5 | 50.0 | 50.0 | 77.1 | 29.7 | 70.3 | 84.5 | 50.0 | 50.0 |
| Quebec | 96.1 | 90.4 | 9.6 | 97.1 | 92.4 | 7.6 | 33.9 | 78.2 | 21.8 | 56.2 | 76.7 | 23.3 |
| Ontario | 93.2 | 88.5 | 11.5 | 94.2 | 89.2 | 10.8 | 61.7 | 80 | 20 | 64.2 | 89.9 | 10.1 |
| Manitoba | 96.5 | 82.4 | 17.6 | 96.3 | 84.5 | 15.5 | 75.4 | x suppressed to meet the confidentiality requirements of the Statistics Act | x suppressed to meet the confidentiality requirements of the Statistics Act | 86.0 | 69.6 | 30.4 |
| Saskatchewan | 96.3 | 79.0 | 21.0 | 95.7 | 77.6 | 22.4 | 84.1 | 48.6 | 51.4 | 84.4 | 51.8 | 48.2 |
| Alberta | 95.5 | 75.8 | 24.2 | 95.5 | 71.4 | 28.6 | 42.7 | 77.5 | 22.5 | 29.1 | 75.0 | 25.0 |
| British Columbia | 95.3 | 84.4 | 15.6 | 95.3 | 86.7 | 13.3 | 76.1 | 72.6 | 27.4 | 68.8 | 72.1 | 27.9 |
| Country of citizenship | ||||||||||||
| Canada | 95.0 | 83.4 | 16.6 | 95.5 | 84.6 | 15.4 | ... not applicable | ... not applicable | ... not applicable | ... not applicable | ... not applicable | ... not applicable |
| United States | 86.1 | 81.9 | 18.1 | 86.1 | 84.7 | 15.3 | 30.1 | 76.5 | 23.5 | 34.0 | 69.7 | 30.3 |
| China | 92.6 | 85.6 | 14.4 | 93.7 | 79.5 | 20.5 | 74.3 | 79.8 | 20.2 | 67.1 | 79.0 | 21.0 |
| India | 95.1 | 77.9 | 22.1 | 95.1 | 74.6 | 25.4 | 76.0 | 56.5 | 43.5 | 60.8 | 51.1 | 48.9 |
| Other | 92.2 | 82.1 | 17.9 | 93.9 | 84.3 | 15.7 | 56.8 | 70.1 | 29.9 | 57.1 | 76.0 | 24.0 |
Ontario was the most popular destination among Canadian graduates who left their province of study after completing medicine, dentistry and optometry programs
The results in Table 2 indicate that a substantial proportion of health graduates relocated to other regions after graduation. This finding raises the question: to which regions did these graduates move? To address this question, the regional distribution of Canadian graduates three years after completing health degree programs was examined separately by field of study (Table 3).
For Canadian graduates who completed medicine, dentistry and optometry programs from 2010 to 2019, Ontario was the top destination among those who studied in Newfoundland and Labrador, Nova Scotia, and Quebec and left their province of study. For those from Quebec, 16% moved to other regions, including 7% who headed to Ontario. Among graduates from the western provinces, Ontario, Alberta and British Columbia were the most popular destinations. In Ontario, 21% of graduates moved to other regions, including 6% to Alberta and 7% to British Columbia.
For nursing graduates, New Brunswick stood out with a low regional retention rate of 51%, as 37% of graduates moved to Ontario. There were no noticeable standout destination regions for other provinces.
For pharmacy and related programs, 25% of Nova Scotia graduates who stayed in Canada three years after graduation moved to New Brunswick. Some graduates who made this regional migration may have come from the neighbouring province to Nova Scotia to study in pharmacy and related programs because these programs were not offered in their home province.
| Appeared in the T1 Family File in year 3 after graduation | |||||||||||||
|---|---|---|---|---|---|---|---|---|---|---|---|---|---|
| Total | Destination region | ||||||||||||
| Newfoundland and Labrador | Prince Edward Island | Nova Scotia | New Brunswick | Quebec | Ontario | Manitoba | Saskatchewan | Alberta | British Columbia | Territories | Not a resident or not stated | ||
| percent | |||||||||||||
Sources: Statistics Canada, Postsecondary Student Information System and T1 Family File. |
|||||||||||||
| A. Medicine, dentistry and optometry | |||||||||||||
| Province of study | |||||||||||||
| Newfoundland and Labrador | 96.2 | 44.9 | 1.9 | 9.7 | 4.1 | x suppressed to meet the confidentiality requirements of the Statistics Act | 24.6 | x suppressed to meet the confidentiality requirements of the Statistics Act | x suppressed to meet the confidentiality requirements of the Statistics Act | 6.8 | 4.4 | x suppressed to meet the confidentiality requirements of the Statistics Act | x suppressed to meet the confidentiality requirements of the Statistics Act |
| Prince Edward Island | ... not applicable | ... not applicable | ... not applicable | ... not applicable | ... not applicable | ... not applicable | ... not applicable | ... not applicable | ... not applicable | ... not applicable | ... not applicable | ... not applicable | ... not applicable |
| Nova Scotia | 96.6 | 4.4 | 2.2 | 41.3 | 8.8 | 1.2 | 22.6 | 1.8 | 1.2 | 9.6 | 5.8 | x suppressed to meet the confidentiality requirements of the Statistics Act | x suppressed to meet the confidentiality requirements of the Statistics Act |
| New Brunswick | ... not applicable | ... not applicable | ... not applicable | ... not applicable | ... not applicable | ... not applicable | ... not applicable | ... not applicable | ... not applicable | ... not applicable | ... not applicable | ... not applicable | ... not applicable |
| Quebec | 96.6 | 0.3 | x suppressed to meet the confidentiality requirements of the Statistics Act | 0.5 | 2.0 | 86.6 | 7.3 | 0.3 | 0.2 | 1.0 | 1.4 | 0.2 | x suppressed to meet the confidentiality requirements of the Statistics Act |
| Ontario | 93.4 | 0.6 | 0.2 | 2.0 | 0.4 | 1.7 | 78.8 | 1.5 | 1.2 | 6.2 | 7.1 | 0.2 | 0.2 |
| Manitoba | 97.4 | x suppressed to meet the confidentiality requirements of the Statistics Act | x suppressed to meet the confidentiality requirements of the Statistics Act | 1.0 | x suppressed to meet the confidentiality requirements of the Statistics Act | x suppressed to meet the confidentiality requirements of the Statistics Act | 13.8 | 64.5 | 1.4 | 9.8 | 8.4 | x suppressed to meet the confidentiality requirements of the Statistics Act | 0.0 |
| Saskatchewan | 96.6 | x suppressed to meet the confidentiality requirements of the Statistics Act | 0.0 | 1.2 | x suppressed to meet the confidentiality requirements of the Statistics Act | x suppressed to meet the confidentiality requirements of the Statistics Act | 11.0 | 2.5 | 56.3 | 17.4 | 9.9 | x suppressed to meet the confidentiality requirements of the Statistics Act | x suppressed to meet the confidentiality requirements of the Statistics Act |
| Alberta | 95.7 | 0.5 | 0.0 | 1.8 | x suppressed to meet the confidentiality requirements of the Statistics Act | 0.5 | 13.8 | 1.7 | 2.6 | 66.7 | 11.5 | 0.5 | x suppressed to meet the confidentiality requirements of the Statistics Act |
| British Columbia | 96.8 | 0.5 | x suppressed to meet the confidentiality requirements of the Statistics Act | 2.1 | 0.3 | 0.6 | 13.7 | 1.5 | 1.5 | 14.8 | 64.2 | 0.5 | x suppressed to meet the confidentiality requirements of the Statistics Act |
| B. Nursing | |||||||||||||
| Province of study | |||||||||||||
| Newfoundland and Labrador | 96.5 | 76.9 | 1.0 | 8.5 | 1.3 | 0.5 | 3.0 | 0.4 | 0.5 | 4.8 | 2.3 | 0.8 | 0.0 |
| Prince Edward Island | 96.1 | x suppressed to meet the confidentiality requirements of the Statistics Act | 73.2 | 12.0 | 3.1 | x suppressed to meet the confidentiality requirements of the Statistics Act | 2.7 | x suppressed to meet the confidentiality requirements of the Statistics Act | x suppressed to meet the confidentiality requirements of the Statistics Act | 4.9 | 2.4 | x suppressed to meet the confidentiality requirements of the Statistics Act | x suppressed to meet the confidentiality requirements of the Statistics Act |
| Nova Scotia | 95.8 | 0.9 | 1.6 | 75.7 | 2.6 | 1.9 | 8.3 | x suppressed to meet the confidentiality requirements of the Statistics Act | 0.8 | 4.1 | 2.3 | 1.5 | x suppressed to meet the confidentiality requirements of the Statistics Act |
| New Brunswick | 96.5 | 0.2 | 0.7 | 5.1 | 50.9 | 1.3 | 37.0 | 0.4 | 0.4 | 2.6 | 1.2 | x suppressed to meet the confidentiality requirements of the Statistics Act | x suppressed to meet the confidentiality requirements of the Statistics Act |
| Quebec | 97.9 | x suppressed to meet the confidentiality requirements of the Statistics Act | x suppressed to meet the confidentiality requirements of the Statistics Act | 0.1 | 0.1 | 97.0 | 1.5 | 0.1 | x suppressed to meet the confidentiality requirements of the Statistics Act | 0.3 | 0.7 | 0.1 | 0.1 |
| Ontario | 94.3 | 0.1 | 0.1 | 0.5 | 0.1 | 1.9 | 92.8 | 0.5 | 0.3 | 1.4 | 1.9 | 0.3 | 0.2 |
| Manitoba | 96.2 | x suppressed to meet the confidentiality requirements of the Statistics Act | 0.0 | x suppressed to meet the confidentiality requirements of the Statistics Act | x suppressed to meet the confidentiality requirements of the Statistics Act | x suppressed to meet the confidentiality requirements of the Statistics Act | 1.9 | 91.1 | 1.9 | 2.1 | 2.5 | x suppressed to meet the confidentiality requirements of the Statistics Act | x suppressed to meet the confidentiality requirements of the Statistics Act |
| Saskatchewan | 96.1 | x suppressed to meet the confidentiality requirements of the Statistics Act | x suppressed to meet the confidentiality requirements of the Statistics Act | x suppressed to meet the confidentiality requirements of the Statistics Act | x suppressed to meet the confidentiality requirements of the Statistics Act | x suppressed to meet the confidentiality requirements of the Statistics Act | 1.1 | 1.0 | 89.7 | 4.9 | 2.7 | x suppressed to meet the confidentiality requirements of the Statistics Act | x suppressed to meet the confidentiality requirements of the Statistics Act |
| Alberta | 95.5 | 1.3 | 0.2 | 1.2 | 0.6 | 0.9 | 8.7 | 1.3 | 2.8 | 74.2 | 8.0 | 0.5 | 0.3 |
| British Columbia | 95.6 | x suppressed to meet the confidentiality requirements of the Statistics Act | x suppressed to meet the confidentiality requirements of the Statistics Act | 0.4 | 0.1 | 1.7 | 2.3 | 0.3 | 0.4 | 3.3 | 90.2 | 1.1 | 0.2 |
| C. Pharmacy and related programs | |||||||||||||
| Province of study | |||||||||||||
| Newfoundland and Labrador | 95.0 | 62.6 | x suppressed to meet the confidentiality requirements of the Statistics Act | 4.3 | 10.9 | x suppressed to meet the confidentiality requirements of the Statistics Act | 11.9 | x suppressed to meet the confidentiality requirements of the Statistics Act | x suppressed to meet the confidentiality requirements of the Statistics Act | 3.6 | x suppressed to meet the confidentiality requirements of the Statistics Act | x suppressed to meet the confidentiality requirements of the Statistics Act | x suppressed to meet the confidentiality requirements of the Statistics Act |
| Prince Edward Island | ... not applicable | ... not applicable | ... not applicable | ... not applicable | ... not applicable | ... not applicable | ... not applicable | ... not applicable | ... not applicable | ... not applicable | ... not applicable | ... not applicable | ... not applicable |
| Nova Scotia | 97.2 | 1.6 | 6.3 | 48.1 | 24.5 | x suppressed to meet the confidentiality requirements of the Statistics Act | 10.5 | x suppressed to meet the confidentiality requirements of the Statistics Act | x suppressed to meet the confidentiality requirements of the Statistics Act | 3.8 | 3.4 | x suppressed to meet the confidentiality requirements of the Statistics Act | 0.0 |
| New Brunswick | ... not applicable | ... not applicable | ... not applicable | ... not applicable | ... not applicable | ... not applicable | ... not applicable | ... not applicable | ... not applicable | ... not applicable | ... not applicable | ... not applicable | ... not applicable |
| Quebec | 98.2 | 0.0 | 0.0 | x suppressed to meet the confidentiality requirements of the Statistics Act | 1.0 | 97.5 | 0.9 | 0.0 | 0.0 | x suppressed to meet the confidentiality requirements of the Statistics Act | x suppressed to meet the confidentiality requirements of the Statistics Act | 0.0 | x suppressed to meet the confidentiality requirements of the Statistics Act |
| Ontario | 95.9 | x suppressed to meet the confidentiality requirements of the Statistics Act | x suppressed to meet the confidentiality requirements of the Statistics Act | 0.4 | x suppressed to meet the confidentiality requirements of the Statistics Act | 1.1 | 91.7 | 0.4 | 0.3 | 1.6 | 3.7 | x suppressed to meet the confidentiality requirements of the Statistics Act | 0.4 |
| Manitoba | 97.6 | 0.0 | 0.0 | 0.0 | x suppressed to meet the confidentiality requirements of the Statistics Act | x suppressed to meet the confidentiality requirements of the Statistics Act | 5.3 | 88.6 | x suppressed to meet the confidentiality requirements of the Statistics Act | x suppressed to meet the confidentiality requirements of the Statistics Act | 2.2 | x suppressed to meet the confidentiality requirements of the Statistics Act | 0.0 |
| Saskatchewan | 96.8 | 0.0 | x suppressed to meet the confidentiality requirements of the Statistics Act | x suppressed to meet the confidentiality requirements of the Statistics Act | x suppressed to meet the confidentiality requirements of the Statistics Act | x suppressed to meet the confidentiality requirements of the Statistics Act | 4.7 | 3.0 | 67.7 | 14.4 | 8.2 | x suppressed to meet the confidentiality requirements of the Statistics Act | 0.0 |
| Alberta | 96.8 | x suppressed to meet the confidentiality requirements of the Statistics Act | x suppressed to meet the confidentiality requirements of the Statistics Act | x suppressed to meet the confidentiality requirements of the Statistics Act | x suppressed to meet the confidentiality requirements of the Statistics Act | x suppressed to meet the confidentiality requirements of the Statistics Act | 3.1 | x suppressed to meet the confidentiality requirements of the Statistics Act | x suppressed to meet the confidentiality requirements of the Statistics Act | 88.6 | 6.3 | x suppressed to meet the confidentiality requirements of the Statistics Act | x suppressed to meet the confidentiality requirements of the Statistics Act |
| British Columbia | 97.1 | 0.0 | 0.0 | x suppressed to meet the confidentiality requirements of the Statistics Act | 0.0 | x suppressed to meet the confidentiality requirements of the Statistics Act | 2.3 | x suppressed to meet the confidentiality requirements of the Statistics Act | x suppressed to meet the confidentiality requirements of the Statistics Act | 2.6 | 93.6 | 0.8 | x suppressed to meet the confidentiality requirements of the Statistics Act |
| D. Health care, n.e.c. | |||||||||||||
| Province of study | |||||||||||||
| Newfoundland and Labrador | x suppressed to meet the confidentiality requirements of the Statistics Act | 50.4 | 0.0 | 7.4 | x suppressed to meet the confidentiality requirements of the Statistics Act | x suppressed to meet the confidentiality requirements of the Statistics Act | 19.3 | x suppressed to meet the confidentiality requirements of the Statistics Act | x suppressed to meet the confidentiality requirements of the Statistics Act | 8.2 | x suppressed to meet the confidentiality requirements of the Statistics Act | x suppressed to meet the confidentiality requirements of the Statistics Act | 0.0 |
| Prince Edward Island | x suppressed to meet the confidentiality requirements of the Statistics Act | x suppressed to meet the confidentiality requirements of the Statistics Act | 69.5 | x suppressed to meet the confidentiality requirements of the Statistics Act | x suppressed to meet the confidentiality requirements of the Statistics Act | 0.0 | 0.0 | 0.0 | 0.0 | x suppressed to meet the confidentiality requirements of the Statistics Act | 0.0 | x suppressed to meet the confidentiality requirements of the Statistics Act | 0.0 |
| Nova Scotia | 95.6 | 5.8 | 3.6 | 44.1 | 10.1 | 1.5 | 14.7 | x suppressed to meet the confidentiality requirements of the Statistics Act | 1.2 | 10.4 | 7.0 | 0.9 | x suppressed to meet the confidentiality requirements of the Statistics Act |
| New Brunswick | 97.8 | x suppressed to meet the confidentiality requirements of the Statistics Act | 2.9 | 4.3 | 75.6 | 8.2 | 3.2 | 0.0 | x suppressed to meet the confidentiality requirements of the Statistics Act | 2.6 | x suppressed to meet the confidentiality requirements of the Statistics Act | x suppressed to meet the confidentiality requirements of the Statistics Act | x suppressed to meet the confidentiality requirements of the Statistics Act |
| Quebec | 94.7 | 0.1 | x suppressed to meet the confidentiality requirements of the Statistics Act | 0.4 | 0.8 | 86.5 | 7.4 | 0.4 | 0.2 | 1.2 | 2.6 | x suppressed to meet the confidentiality requirements of the Statistics Act | 0.2 |
| Ontario | 93.0 | 0.3 | 0.1 | 0.8 | 0.6 | 2.7 | 87.1 | 0.5 | 0.3 | 2.8 | 4.1 | 0.3 | 0.3 |
| Manitoba | 95.9 | x suppressed to meet the confidentiality requirements of the Statistics Act | 0.0 | x suppressed to meet the confidentiality requirements of the Statistics Act | x suppressed to meet the confidentiality requirements of the Statistics Act | x suppressed to meet the confidentiality requirements of the Statistics Act | 5.1 | 78.9 | 2.6 | 6.8 | 5.7 | x suppressed to meet the confidentiality requirements of the Statistics Act | x suppressed to meet the confidentiality requirements of the Statistics Act |
| Saskatchewan | 94.4 | x suppressed to meet the confidentiality requirements of the Statistics Act | x suppressed to meet the confidentiality requirements of the Statistics Act | 1.1 | x suppressed to meet the confidentiality requirements of the Statistics Act | x suppressed to meet the confidentiality requirements of the Statistics Act | 13.5 | 1.7 | 57.6 | 13.9 | 9.5 | 0.9 | x suppressed to meet the confidentiality requirements of the Statistics Act |
| Alberta | 94.9 | 0.5 | x suppressed to meet the confidentiality requirements of the Statistics Act | 0.8 | 0.3 | 0.5 | 7.0 | 1.2 | 4.7 | 72.0 | 12.2 | 0.5 | x suppressed to meet the confidentiality requirements of the Statistics Act |
| British Columbia | 93.8 | 0.2 | x suppressed to meet the confidentiality requirements of the Statistics Act | 0.3 | x suppressed to meet the confidentiality requirements of the Statistics Act | 0.7 | 6.7 | 0.6 | 0.9 | 5.7 | 83.8 | 0.6 | 0.4 |
Returning to the home province is one reason for mobility among health degree program graduates
Some graduates who moved to other regions after graduation could be returning to their province of origin. To illustrate how common this return migration is, Table 4 presents Canadian graduates’ regional retention status three years after graduation, broken down by province of study and home province. The home province is based on the permanent address information declared at the time of
Among Canadians who completed medicine, dentistry and optometry programs, the majority of graduates who left their study province studied in their home province and left the province after graduation (e.g., 83% in British Columbia). One exception was Nova Scotia, where 45% of Canadian graduates from medicine, dentistry and optometry programs were out-of-province students (not presented in the table). In this province, the majority of leavers (60%) came from other regions, including 33% who returned to their home province after graduation and 27% who moved to a third region that was neither their province of study nor their home province.
For Canadian nursing graduates who studied in New Brunswick (80%) and Alberta (77%), more than 75% of leavers returned to their home province. In New Brunswick, 44% of Canadian nursing graduates were out-of-province students (not presented in the table). For Newfoundland and Labrador (57%) and Prince Edward Island (52%), the majority of leavers were graduates who studied in their home province and left that province after graduation.
| Appeared in the T1 Family File in year 3 after graduation | ||||||||
|---|---|---|---|---|---|---|---|---|
| Total | Stayed in the study province | Moved to other regions or not stated | ||||||
| Total | Originally from the study province | Came from other regions for study | Total | Originally from the study province | Came from other regions and returned to home province | Came from other regions and moved to a third region | ||
| percent | ||||||||
Sources: Statistics Canada, Postsecondary Student Information System and T1 Family File. |
||||||||
| A. Medicine, dentistry and optometry | ||||||||
| Province of study | ||||||||
| Newfoundland and Labrador | 96.1 | 45.1 | 89.3 | 10.7 | 54.9 | 59.6 | 15.2 | 25.1 |
| Prince Edward Island | ... not applicable | ... not applicable | ... not applicable | ... not applicable | ... not applicable | ... not applicable | ... not applicable | ... not applicable |
| Nova Scotia | 96.7 | 41.3 | 77.3 | 22.7 | 58.7 | 39.6 | 33.1 | 27.3 |
| New Brunswick | ... not applicable | ... not applicable | ... not applicable | ... not applicable | ... not applicable | ... not applicable | ... not applicable | ... not applicable |
| Quebec | 96.9 | 86.9 | 97.5 | 2.5 | 13.1 | 54.4 | 35.7 | 10.0 |
| Ontario | 94.0 | 78.7 | 95.7 | 4.3 | 21.3 | 57.7 | 31.4 | 11.0 |
| Manitoba | 97.6 | 67.0 | 95.4 | 4.6 | 33.0 | 67.7 | 20.7 | 11.5 |
| Saskatchewan | 96.8 | 57.3 | 91.4 | 8.6 | 42.7 | 59.5 | 33.6 | 6.9 |
| Alberta | 95.9 | 67.1 | 91.1 | 8.9 | 32.9 | 69.3 | 22.1 | 8.7 |
| British Columbia | 97.0 | 65.1 | 95.5 | 4.5 | 34.9 | 82.8 | 13.3 | 3.9 |
| B. Nursing | ||||||||
| Province of study | ||||||||
| Newfoundland and Labrador | 96.9 | 77.1 | 96.1 | 3.9 | 22.9 | 57.0 | 33.6 | 9.4 |
| Prince Edward Island | 96.1 | 73.3 | 92.6 | 7.4 | 26.7 | 52.2 | 36.9 | 10.8 |
| Nova Scotia | 96.0 | 76.6 | 94.3 | 5.7 | 23.4 | 39.4 | 48.0 | 12.6 |
| New Brunswick | 96.5 | 50.9 | 95.7 | 4.3 | 49.1 | 15.8 | 79.6 | 4.6 |
| Quebec | 97.9 | 97.0 | 99.5 | 0.5 | 3.0 | 58.5 | 30.9 | 10.7 |
| Ontario | 94.4 | 92.8 | 98.9 | 1.1 | 7.2 | 60.6 | 36.0 | 3.3 |
| Manitoba | 96.3 | 91.2 | 98.2 | 1.8 | 8.8 | 75.1 | 21.7 | 3.3 |
| Saskatchewan | 96.3 | 90.0 | 97.7 | 2.3 | 10.0 | 55.7 | 39.6 | 4.7 |
| Alberta | 95.7 | 74.7 | 93.1 | 6.9 | 25.3 | 19.1 | 76.6 | 4.3 |
| British Columbia | 96.0 | 91.1 | 98.7 | 1.3 | 8.9 | 42.3 | 55.1 | 2.6 |
| C. Pharmacy and related programs | ||||||||
| Province of study | ||||||||
| Newfoundland and Labrador | 95.3 | 62.5 | x suppressed to meet the confidentiality requirements of the Statistics Act | x suppressed to meet the confidentiality requirements of the Statistics Act | 37.5 | 39.8 | 40.7 | 19.5 |
| Prince Edward Island | ... not applicable | ... not applicable | ... not applicable | ... not applicable | ... not applicable | ... not applicable | ... not applicable | ... not applicable |
| Nova Scotia | 97.2 | 48.1 | 83.6 | 16.4 | 51.9 | 36.4 | 47.1 | 16.5 |
| New Brunswick | ... not applicable | ... not applicable | ... not applicable | ... not applicable | ... not applicable | ... not applicable | ... not applicable | ... not applicable |
| Quebec | 98.3 | 97.5 | 99.0 | 1.0 | 2.5 | 47.8 | x suppressed to meet the confidentiality requirements of the Statistics Act | x suppressed to meet the confidentiality requirements of the Statistics Act |
| Ontario | 95.9 | 91.8 | 96.9 | 3.1 | 8.2 | 42.5 | 52.6 | 4.9 |
| Manitoba | x suppressed to meet the confidentiality requirements of the Statistics Act | x suppressed to meet the confidentiality requirements of the Statistics Act | x suppressed to meet the confidentiality requirements of the Statistics Act | x suppressed to meet the confidentiality requirements of the Statistics Act | x suppressed to meet the confidentiality requirements of the Statistics Act | x suppressed to meet the confidentiality requirements of the Statistics Act | x suppressed to meet the confidentiality requirements of the Statistics Act | x suppressed to meet the confidentiality requirements of the Statistics Act |
| Saskatchewan | 97.2 | 69.4 | 94.0 | 6.0 | 30.6 | 37.6 | 53.7 | 8.7 |
| Alberta | 97.2 | 90.0 | 93.7 | 6.3 | 10.0 | 38.6 | 48.2 | 13.2 |
| British Columbia | 97.3 | 93.7 | 97.0 | 3.0 | 6.3 | 75.8 | x suppressed to meet the confidentiality requirements of the Statistics Act | x suppressed to meet the confidentiality requirements of the Statistics Act |
| D. Health care, n.e.c. | ||||||||
| Province of study | ||||||||
| Newfoundland and Labrador | x suppressed to meet the confidentiality requirements of the Statistics Act | 50.0 | x suppressed to meet the confidentiality requirements of the Statistics Act | x suppressed to meet the confidentiality requirements of the Statistics Act | 50.0 | 34.3 | 38.8 | 26.9 |
| Prince Edward Island | 100.0 | 69.5 | x suppressed to meet the confidentiality requirements of the Statistics Act | x suppressed to meet the confidentiality requirements of the Statistics Act | 30.5 | x suppressed to meet the confidentiality requirements of the Statistics Act | x suppressed to meet the confidentiality requirements of the Statistics Act | x suppressed to meet the confidentiality requirements of the Statistics Act |
| Nova Scotia | 95.7 | 44.1 | 77.6 | 22.4 | 55.9 | 23.8 | 54.4 | 21.8 |
| New Brunswick | 97.8 | 75.8 | 96.2 | 3.8 | 24.2 | 51.0 | x suppressed to meet the confidentiality requirements of the Statistics Act | x suppressed to meet the confidentiality requirements of the Statistics Act |
| Quebec | 95.5 | 86.9 | 97.7 | 2.3 | 13.1 | 25.0 | 63.0 | 12.0 |
| Ontario | 93.3 | 87.2 | 97.8 | 2.2 | 12.8 | 45.3 | 47.0 | 7.7 |
| Manitoba | 96.1 | 79.4 | 96.5 | 3.5 | 20.6 | 61.7 | 32.6 | 5.6 |
| Saskatchewan | 95.1 | 58.6 | 90.9 | 9.1 | 41.4 | 24.8 | 62.6 | 12.6 |
| Alberta | 95.1 | 72.0 | 84.6 | 15.4 | 28.0 | 23.0 | 68.5 | 8.5 |
| British Columbia | 94.3 | 84.8 | 96.4 | 3.6 | 15.2 | 39.8 | 54.5 | 5.6 |
Some provinces had a small net gain of health degree program graduates, while some provinces had a small net loss
While a province may lose some health graduates through out-migration, it can also gain others through in-migration. The relative size of these two flows determines whether a province experiences a net gain or loss in the exchange. By comparing the regional distribution of Canadian health degree program graduates three years after graduation with their distribution at the time of graduation, Table 5 shows which provinces had a net gain of health graduates. Overall, changes in distributions were small.
For the fields of medicine, dentistry and optometry, Quebec had the largest net loss, of 5 percentage points. With a larger volume of in-migration, Ontario had a smaller net loss (2 percentage points) than Quebec. Alberta and British Columbia had a small net gain (1 percentage point). Prince Edward Island, New Brunswick and the territories experienced a net gain only because they did not have any graduates in these fields.
Alberta accounted for 16% of Canadian graduates in the field of nursing, but 13% of nursing graduates lived in the province three years after graduation, leading to a net loss of 3 percentage points. New Brunswick also experienced a net loss (2 percentage points).
For pharmacy and related programs, Nova Scotia had the largest net loss of graduates (3 percentage points), followed by Saskatchewan (2 percentage points). New Brunswick had a net gain of graduates (2 percentage points) because it did not offer these programs in its postsecondary education system. British Columbia had a net gain (1 percentage point).
| Percentage of graduates by province of study | Percentage of graduates by region of residence three years after graduation | Net change in year 3 |
|
|---|---|---|---|
| percent | percentage points | ||
Sources: Statistics Canada, Postsecondary Student Information System and T1 Family File. |
|||
| A. Medicine, dentistry and optometry | |||
| Newfoundland and Labrador | 2.0 | 1.4 | -0.6 |
| Prince Edward Island | 0.0 | 0.2 | 0.2 |
| Nova Scotia | 4.2 | 3.1 | -1.1 |
| New Brunswick | 0.0 | 1.3 | 1.3 |
| Quebec | 32.1 | 27.6 | -4.5 |
| Ontario | 34.6 | 32.6 | -2.0 |
| Manitoba | 4.1 | 3.7 | -0.5 |
| Saskatchewan | 3.3 | 2.7 | -0.5 |
| Alberta | 10.3 | 11.7 | 1.4 |
| British Columbia | 9.5 | 10.7 | 1.2 |
| Territories | 0.0 | 0.3 | 0.3 |
| Not a resident, not stated or not appearing in the T1FF | ... not applicable | 4.7 | ... not applicable |
| B. Nursing | |||
| Newfoundland and Labrador | 2.1 | 1.9 | -0.3 |
| Prince Edward Island | 0.5 | 0.6 | 0.0 |
| Nova Scotia | 3.6 | 3.5 | -0.1 |
| New Brunswick | 4.3 | 2.4 | -1.9 |
| Quebec | 15.6 | 16.0 | 0.3 |
| Ontario | 36.3 | 35.7 | -0.6 |
| Manitoba | 3.7 | 3.7 | 0.0 |
| Saskatchewan | 4.2 | 4.3 | 0.1 |
| Alberta | 16.4 | 13.2 | -3.2 |
| British Columbia | 13.2 | 13.8 | 0.6 |
| Territories | 0.0 | 0.4 | 0.4 |
| Not a resident, not stated or not appearing in the T1FF | ... not applicable | 4.6 | ... not applicable |
| C. Pharmacy and related programs | |||
| Newfoundland and Labrador | 2.5 | 1.6 | -0.9 |
| Prince Edward Island | 0.0 | 0.5 | 0.5 |
| Nova Scotia | 6.3 | 3.3 | -3.1 |
| New Brunswick | 0.0 | 2.2 | 2.2 |
| Quebec | 29.9 | 29.1 | -0.8 |
| Ontario | 27.7 | 26.6 | -1.1 |
| Manitoba | 3.7 | 3.6 | -0.1 |
| Saskatchewan | 6.8 | 4.7 | -2.1 |
| Alberta | 10.2 | 10.9 | 0.7 |
| British Columbia | 12.9 | 14.3 | 1.4 |
| Territories | 0.0 | 0.3 | 0.3 |
| Not a resident, not stated or not appearing in the T1FF | ... not applicable | 3.2 | ... not applicable |
| D. Health care, n.e.c. | |||
| Newfoundland and Labrador | 0.2 | 0.6 | 0.4 |
| Prince Edward Island | 0.1 | 0.3 | 0.2 |
| Nova Scotia | 4.7 | 2.6 | -2.1 |
| New Brunswick | 1.0 | 1.7 | 0.7 |
| Quebec | 20.8 | 18.6 | -2.3 |
| Ontario | 49.2 | 43.6 | -5.6 |
| Manitoba | 2.8 | 2.6 | -0.2 |
| Saskatchewan | 1.7 | 1.7 | 0.0 |
| Alberta | 7.9 | 8.5 | 0.6 |
| British Columbia | 11.7 | 13.1 | 1.5 |
| Territories | 0.0 | 0.4 | 0.4 |
| Not a resident, not stated or not appearing in the T1FF | ... not applicable | 6.4 | ... not applicable |
Summary
Despite concerns about the brain drain of health care workers to other countries, particularly the United States, retention of Canadian graduates from health degree programs within Canada was higher than the average for all Canadian graduates. Canadian graduates showed small variations in national retention across different educational characteristics. International graduates had larger variations, but they accounted for a small portion of health degree graduates in Canada.
Some degree of regional migration was observed among health graduates, varying by field of study, country of citizenship and province of study. Graduates from medicine, dentistry and optometry programs had lower regional retention rates than graduates from nursing and other health fields. Permanent residents were more likely than Canadian citizens to leave their province of study. Some health graduates who left their province of study relocated to neighbouring provinces, while others moved to larger provinces, such as Ontario, Alberta and British Columbia. Their relocation may be motivated by the pursuit of better employment or training opportunities.
In the medicine, dentistry and optometry fields, more than half of out-migration from the province of study was accounted for by graduates leaving their home province. For nursing graduates from New Brunswick and Alberta, those who returned to their home province after their studies made up the majority of out-migration. Overall, regional variations in net gains and losses of health graduates three years after graduation were small.
This study has some limitations. Having graduated from a health degree program does not necessarily mean the person is or will be working in the health sector. Some bachelor’s or master’s degree graduates may stay in Canada but continue their studies at a higher level. Last, the presence of health degree holders in a region does not necessarily imply employment in the fields for which they were trained, nor does it guarantee employment.
Even with its limitations, this study showed that the majority of Canadian health graduates remained in Canada, with some degree of interprovincial migration.
Authors
Youjin Choi and Feng Hou are with the Economic and Social Analysis and Modelling Division, Analytical Studies and Modelling Branch, at Statistics Canada.
References
Baumann, A., and Crea-Arsenio, M. (2023). The Crisis in the Nursing Labour Market: Canadian Policy Perspectives. Healthcare, 11(13), 1954.
Choi, Y., and Hou, F. (2025). Retention of science, technology, engineering, mathematics and computer science graduates in Canada. Economic and Social Reports.
Gomes, A., and Gillis, H. (2025, Feb. 25). Canadians need doctors. These strategies from around the country aim to find them. Canadian Broadcasting Corporation.
Hou, F. (2024). Active presence of immigrants in Canada: Recent trends in tax filing and employment incidence. Economic and Social Reports, 4(5), 1–7.
Landry, M., Schofield, A., Bordage, R., and Bélanger, M. (2011). Improving the recruitment and retention of doctors by training medical students locally. Medical Education, 45(11), 1121–1129.
Zhao, J., Drew, D., and Murray, S. (2000). Brain drain and brain gain. Education Quarterly Review, 6(3). Statistics Canada Catalogue no. 81-003-XIE.
- Date modified: