
Economic and Social Reports
Estimates of gross domestic product by gender: An update to the 2022 report

DOI: https://doi.org/10.25318/36280001202600200001-eng
Text begins
This study provides a partial update to a 2022 report on the contribution of women to gross domestic product
At the time of the initial report, there was a sizable literature on increases in women’s education and women’s participation in the market-based economy, but there were few papers on the contribution of women to GDP (Faryaar et al., 2022). This is still the case. Aside from the 2022 report, existing papers split GDP between men and women by using the proportion of labour income (wages and salaries, employer social contributions) earned by men and women (Schaffer, 2007; Woetzel et al., 2015). The methodology used in the current study splits the capital income and mixed income components of GDP according to firm ownership, reflecting differences in ownership patterns between men and women. Capital income (gross operating surplus, taxes less subsidies on production) is the component of GDP generated by incorporated businesses, while mixed income (revenue minus expenses) is the component of GDP generated by self-employed people.
As with the original study, it should be noted that since GDP measures the size of the market economy, it does not account for production in the home (Besporstov and Sinclair, 2022; Statistics Canada, 2019). Research has consistently shown that women do more work in the home, including unpaid housework, unpaid child care and unpaid care of other relatives (Hancock et al., 2025; Johnson et al., 2024; Milan et al., 2011; Moyser and Burlock, 2018; Gu, 2022). Results should be interpreted with the knowledge that these estimates reflect production for the market economy (through firm ownership and paid work)—not total production. The concept of GDP and the scope and limitations of the data are discussed in more detail in the original report.
Labour income, capital income and mixed income components are assigned to a gender at the institutional-unit level and then aggregated by sector. Under this approach, GDP is disaggregated into three categories: women’s contribution to GDP, men’s contribution to GDP and unable to allocate. Labour income and mixed income (revenue minus expenses for self-employed people) can almost always be allocated to a gender by using the gender of the person earning the income. Capital income is allocated based on the percentage of capital owned by women and men, but owners of capital may not be identifiable or may not have a gender. For example, firms may be publicly traded or be owned by an investment fund, a pension fund or another corporation, rather than being owned by individuals.
Existing research has identified that at least initially, the pandemic (2020 to 2023; Wise, 2023) was more disruptive to the employment and income of women than those of men (Singh et al., 2022). The current study finds that women’s GDP share and capital income share increased slightly relative to those of men during the pandemic years (Table 1; the GDP share and capital income share for both genders fell, as a greater proportion of capital income could not be allocated in 2021 and 2022). The labour income share of women and the mixed income share of women rose just slightly during the pandemic. This is roughly consistent with estimates of labour market participation and self-employment rates. Labour market participation fell for men and women in 2020, but relative to men, women’s participation rate recovered more in 2021 and 2022 (Statistics Canada, 2025b). In 2020, women’s self-employment rate rose relative to men’s, before falling somewhat in 2021 and 2022 (Uppal, 2023).
| 2013 | 2014 | 2015 | 2016 | 2017 | 2018 | 2019 | 2020 | 2021 | 2022 | |
|---|---|---|---|---|---|---|---|---|---|---|
| percent | ||||||||||
| Notes: GDP = gross domestic product. These estimates are benchmarked to the income components (capital income, labour income and mixed income) of GDP from the Canadian supply and use tables (Statistics Canada, 2025c).
Source: Statistics Canada, Canadian Employer–Employee Dynamics Database and authors’ calculations. |
||||||||||
| GDP share | ||||||||||
| Men | 49.5 | 49.4 | 49.9 | 49.5 | 49.2 | 49.2 | 49.2 | 49.6 | 48.6 | 47.1 |
| Women | 27.9 | 27.5 | 28.3 | 28.9 | 28.5 | 28.5 | 28.7 | 29.7 | 28.8 | 27.9 |
| Unallocated | 22.6 | 23.1 | 21.8 | 21.6 | 22.3 | 22.3 | 22.1 | 20.7 | 22.7 | 25.0 |
| Capital income share | ||||||||||
| Men | 25.1 | 25.0 | 24.1 | 25.3 | 25.3 | 24.9 | 24.7 | 25.1 | 25.3 | 23.9 |
| Women | 8.1 | 7.9 | 7.9 | 8.4 | 8.4 | 8.2 | 8.1 | 8.1 | 8.2 | 7.7 |
| Unallocated | 66.9 | 67.0 | 68.0 | 66.3 | 66.3 | 67.0 | 67.2 | 66.9 | 66.5 | 68.5 |
| Labour income share | ||||||||||
| Men | 61.3 | 61.5 | 61.2 | 60.3 | 60.5 | 60.4 | 60.1 | 59.7 | 59.8 | 59.6 |
| Women | 38.7 | 38.5 | 38.8 | 39.7 | 39.5 | 39.6 | 39.9 | 40.3 | 40.2 | 40.4 |
| Mixed income share | ||||||||||
| Men | 64.5 | 65.5 | 66.0 | 65.0 | 65.0 | 65.4 | 66.0 | 64.0 | 64.2 | 64.3 |
| Women | 35.5 | 34.4 | 33.9 | 35.0 | 35.0 | 34.6 | 34.0 | 36.0 | 35.8 | 35.7 |
Chart 1 examines the 2022 GDP shares by sector, where sectors are defined using the two-digit North American Industry Classification System code (Statistics Canada, 2025a). The ranking is quite similar to the ranking in the original study (Faryaar et al., 2022). As in 2018, women have the highest GDP shares in health care and social assistance (60.5%), educational services (56.8%), and accommodation and food services (45%). In the two sectors where women have the lowest shares—the mining, quarrying, and oil and gas extraction sector and the utilities sector—most GDP is not allocated to either gender. Still, women’s GDP share relative to men’s share is also low in these sectors. The third-lowest GDP share for women occurs in the construction sector, and this is the sector where women’s share is lowest relative to men—women contribute 12.1% of GDP, while men contribute 79.6%.
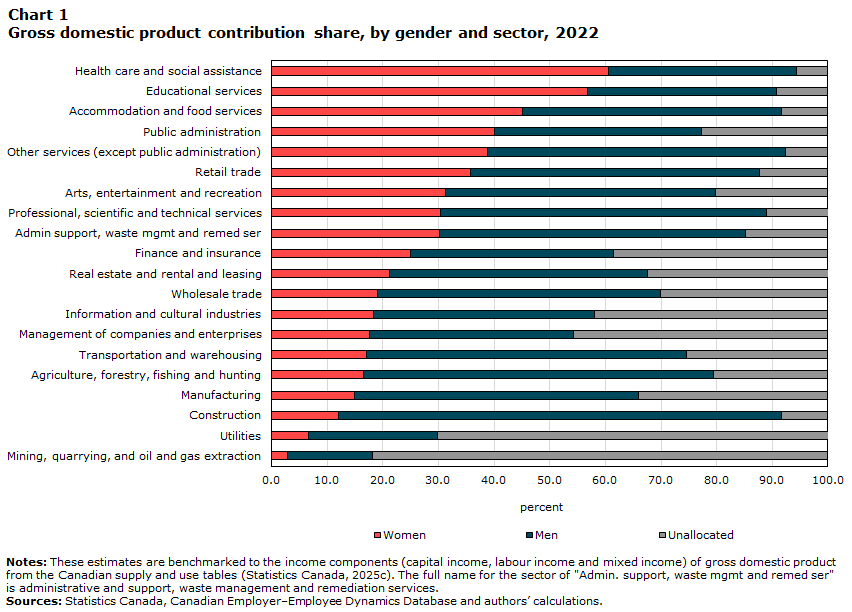
Data table for Chart 1
| Women | Men | Unallocated | |
|---|---|---|---|
| percent | |||
| Notes: These estimates are benchmarked to the income components (capital income, labour income and mixed income) of gross domestic product from the Canadian supply and use tables (Statistics Canada, 2025c). The full name for the sector of "Admin. support, waste mgmt and remed ser" is administrative and support, waste management and remediation services.
Sources: Statistics Canada, Canadian Employer–Employee Dynamics Database and authors’ calculations. |
|||
| Mining, quarrying, and oil and gas extraction | 2.8 | 15.4 | 81.7 |
| Utilities | 6.7 | 23.2 | 70.2 |
| Construction | 12.1 | 79.6 | 8.3 |
| Manufacturing | 14.9 | 51.0 | 34.1 |
| Agriculture, forestry, fishing and hunting | 16.5 | 62.9 | 20.6 |
| Transportation and warehousing | 17.0 | 57.5 | 25.5 |
| Management of companies and enterprises | 17.6 | 36.6 | 45.8 |
| Information and cultural industries | 18.4 | 39.6 | 42.0 |
| Wholesale trade | 19.0 | 50.9 | 30.1 |
| Real estate and rental and leasing | 21.2 | 46.3 | 32.6 |
| Finance and insurance | 24.9 | 36.5 | 38.6 |
| Admin support, waste mgmt and remed ser | 30.2 | 54.9 | 14.9 |
| Professional, scientific and technical services | 30.4 | 58.5 | 11.2 |
| Arts, entertainment and recreation | 31.3 | 48.4 | 20.3 |
| Retail trade | 35.7 | 52.0 | 12.3 |
| Other services (except public administration) | 38.9 | 53.4 | 7.7 |
| Public administration | 40.1 | 37.1 | 22.7 |
| Accommodation and food services | 45.2 | 46.5 | 8.3 |
| Educational services | 56.8 | 34.0 | 9.1 |
| Health care and social assistance | 60.5 | 33.9 | 5.6 |
In terms of changes from 2018 to 2022, there are some sectors where a greater proportion of the sector’s GDP became unallocated—most significantly in mining, quarrying, and oil and gas extraction; real estate and rental and leasing; arts, entertainment and recreation; and agriculture, forestry, fishing and hunting (Chart 1; Faryaar et al., 2022). This could indicate that in these sectors, companies are increasingly moving towards ownership structures where genders cannot be assigned, such as being publicly owned or publicly traded, or being owned by an investment fund. In these cases, women’s share of GDP decreased from 2018 to 2022, but so did men’s share of GDP. Excluding sectors where the GDP share of both genders decreased, retail trade was the sector with the largest decrease for women—their GDP share decreased from 37.4% to 35.7%, while men’s GDP share increased from 51.0% to 52.0%. Similarly, excluding sectors where the GDP share of both genders increased from 2018 to 2022, the largest GDP share increases for women were in transportation and warehousing (15.5% to 17.0%), health care and social assistance (59.2% to 60.5%), management of companies and enterprises (16.4% to 17.6%), and construction (11.0% to 12.1%). Men’s GDP share decreased by at least one percentage point in each of these sectors.
Authors
Jenny Watt and Hassan Faryaar are with the Economic and Social Analysis and Modelling Division at Statistics Canada.
Acknowledgments
The initial report to which this article provides an update was supported by Women and Gender Equality Canada.
References
Besporstov, S. & Sinclair, A. (2022). Estimating the economic value of unpaid household work in Canada, 2015 to 2019 (Latest Developments in the Canadian Economic Accounts). https://www150.statcan.gc.ca/n1/pub/13-605-x/2022001/article/00001-eng.htm
Faryaar, H., Macdonald, R., & Watt, J. (2022). Improving the measurement of the contribution of women to the economy: Estimates of gross domestic product by gender. Economic and Social Reports, 2(10). https://doi.org/10.25318/36280001202201000003-eng
Gu, W. (2022). The value of unpaid childcare and paid employment by gender: What are the impacts of the low-fee universal childcare program? Economic and Social Reports, 2(7). https://doi.org/10.25318/36280001202200700003-eng
Hancock, K., Lafortune, J., & Low, C. (2025). Winning the Bread and Baking it Too: Gendered Frictions in the Allocation of Home Production. NBER Working Paper Series, no. 33393. https://www.nber.org/papers/w33393
Johnson, M. D., Maroto, M., Galambos, N. L., & Krahn, H. J. (2024). Who’s doing more and when? Gender, parenting, and housework trajectories. Journal of Family Psychology, 38(5), 685–696. https://doi.org/10.1037/fam0001219
Milan, A. M., Keown, L. A., & Uruijo, C. R. (2011). Families, Living Arrangements and Unpaid Work (Women in Canada: A Gender-Based Statistical Report). Statistics Canada Catalogue Number 89-503-X.
Moyser, M., & Burlock, A. (2018). Time use: Total work burden, unpaid work, and leisure (Women in Canada: A Gender-based Statistical Report). Statistics Canada Catalogue Number 89-503-X. https://www150.statcan.gc.ca/pub/89-503-x/2015001/article/54931-eng.htm
Risman, B. J. (2004). Gender as a social structure: theory wrestling with activism. Gender and Society, 18(4): 429–450. https://doi.org/10.1177/0891243204265349
Schaffer, A. (2007). Women’s and Men’s Contributions to Satisfying Consumers’ Needs: A Combined Time Use and Input–Output Analysis. Economic Systems Research, 19(1), 45–60. https://doi.org/10.1080/09535310601164732
Singh, V., Shirazi, H., & Turetken, J. (2022). COVID-19 and gender disparities: Labour market outcomes. Research in Economics 76(3): 206–217. https://doi.org/10.1016/j.rie.2022.07.011
Statistics Canada. (2019). Gross domestic product. https://www150.statcan.gc.ca/n1/pub/13-607-x/2016001/174-eng.htm
Statistics Canada. (2022). Canadian Employer Employee Dynamics Database (CEEDD): Introduction. https://www.statcan.gc.ca/en/statistical-programs/document/5228_D1_V1
Statistics Canada. (2025a). North American Industry Classification System (NAICS) Canada 2022 Version 1.0. https://www.statcan.gc.ca/en/subjects/standard/naics/2022/v1/index
Statistics Canada. (2025b). Table 14-10-0020-01 Unemployment rate, participation rate and employment rate by educational attainment, annual [Data table]. https://doi.org/10.25318/1410002001-eng
Statistics Canada. (2025c). Table 36-10-0438-01 Supply and use tables, summary level, provincial and territorial (x 1,000,000) [Data table]. https://doi.org/10.25318/3610043801-eng
Uppal, S. (2023). Self-employment among women in Canada (Insights on Canadian Society). https://www150.statcan.gc.ca/n1/pub/75-006-x/2023001/article/00014-eng.htm
Wise, J. (2023). Covid-19: WHO declares end of global health emergency. BMJ 381, 1041. https://doi.org/10.1136/bmj.p1041
Woetzel, J., Madgavkar, A., Ellingrud, K., Labaye, E., Devillard, S., Kutcher, E., Manyika, J., Dobbs, R., & Krishnan, M. (2015). The power of parity: how advancing women’s equality can add $12 trillion to global growth. McKinsey Global Institute. https://www.mckinsey.com/featured-insights/employment-and-growth/how-advancing-womens-equality-can-add-12-trillion-to-global-growth
- Date modified: