
Economic and Social Reports
Retention and recruitment of young skilled minority official language speakers in Canadian provinces
DOI: https://doi.org/10.25318/36280001202400600002-eng
Text begins
Abstract
Retaining and recruiting young skilled workers are important for any community, but perhaps even more so for communities where the main language spoken is a minority official language. This article informs the issue by calculating the share of youth who grew up in a province and eventually obtained a postsecondary education, but who left to work in another part of the country (termed “skill loss”). Likewise, the article also looks at young postsecondary graduates who entered a province to work, as a share of that province’s initial population of homegrown young postsecondary graduates (termed “skill gain”). The focus is on minority official language speakers—individuals who speak an official language that is not the main language spoken in their home province or in their province of work (i.e., English in Quebec and French elsewhere). The article highlights several interesting findings. For example, New Brunswick registered a net loss of one in five (or -19% of) young, skilled French speakers who obtained their postsecondary education between 2010 and 2017 and were followed two years after graduation. The net losses in New Brunswick were greater among degree holders (one in four). In contrast, Alberta was by far the largest net gainer of young skilled minority official language speakers (70%). Two out of three departing young skilled French speakers from Ontario (67%) obtained their postsecondary credentials in Ontario prior to leaving, far ahead of all other provinces examined. However, Ontario saw net gains overall, especially among degree holders, as well as among graduates of generally higher-paying fields of study.
Authors
Marc Frenette is with the Social Analysis and Modelling Division, Analytical Studies and Modelling Branch, at Statistics Canada.
Introduction
Canada has two official languages (English and French), but most communities across the country have a prevailing official language based on demographics. Although English is the main language throughout most of the country outside Quebec, there are several areas within certain provinces with vibrant Francophone communities, as well as a strong English presence in certain parts of Quebec. The economic vitality of these minority official language communities depends, in large part, on retaining and recruiting skilled workers. Indeed, achieving a critical mass of these skilled workers may be required for businesses and industries to remain in the community. However, skilled workers may be tempted to leave their community in the pursuit of higher-paying jobs elsewhere. While this may help their personal or family economic circumstances, it could have negative repercussions for the community they leave behind. Such departures may be more likely among certain groups who are often quite comfortable speaking both official languages. For example, New Brunswick is Canada’s only officially bilingual province, and approximately one-third of residents claim French as their first official language—many of whom are quite comfortable speaking in English.
Understanding what share of individuals who grew up as minority official language speakers (MOLSs) and later obtained a postsecondary education credential end up leaving their home province can inform discussions about the retention of skilled youth in these communities. Focusing on youth is important in this context since geographic mobility tends to be highest in the early adult years. Furthermore, understanding their exit pathway (i.e., whether they obtained their postsecondary education in their home province) is important for fiscal reasons since postsecondary education is partially funded by the provinces. It can also inform retention strategies (e.g., can encouraging youth to study in their home province help with retention?). Of course, recruiting young skilled MOLS is equally important, since it may offset loss of talent caused by out-migration.
This article asks several questions: “What share of young skilled MOLSs leave their home province to go work elsewhere?”; “Are the affected provinces able to make up for the losses by attracting other young skilled MOLSs from other parts of the country?”; “Do young skilled MOLSs who exit a province acquire their postsecondary education in their home province prior to leaving, and do young skilled MOLSs who enter a province do so after acquiring their postsecondary education elsewhere?”; and, finally, “Are certain types of young skilled MOLSs more likely to leave or enter than others, based on credential and discipline?”
Frenette and Handler (2024) looked at these issues at the provincial and territorial levels without distinguishing between MOLSs and others. Thus, the same data and methods are used here. Specifically, the article identifies the population of high school-aged youth (based on the province where they lived at age 16Note ) from the T1 Family File (T1FF). Among this sample, only those who eventually obtained a postsecondary qualification from a public college or university between the years 2010 and 2017 in the Postsecondary Student Information System (PSIS) and did not appear in the PSIS two years after graduation are selected. Next, the province of work two years after postsecondary graduation is identified in the Longitudinal Worker File (LWF) and the T1FF.Note Comparing the province of work with the initial province of residence enables the calculation of skill losses and gains at the provincial level. The results are presented mainly for MOLSs, who are defined as individuals who went to high school outside Quebec and report French as one of their mother tongues or only mother tongue, or who went to high school in Quebec and report English as one of their mother tongues or only mother tongue. Mother tongue is based on the 2016 Census of Population. For comparative purposes, some results are also shown for individuals who did not speak a minority official language. Sample sizes limited the analysis to six provinces at most (Nova Scotia, New Brunswick, Quebec, Ontario, Manitoba and Alberta) and, in some cases, to three provinces (New Brunswick, Quebec and Ontario).
Throughout the article, the terms skilled youth and skill loss or gain will be used to succinctly describe postsecondary graduates. Other groups of workers may very well be skilled, but the focus of this article is on postsecondary graduates.Note
This article focuses on the propensity of provinces to retain or recruit young skilled MOLSs who were in Canada in their teen years and educated in Canada at the postsecondary level. Resulting shortages can potentially be bridged by foreign talent through the immigration system. However, understanding the migration patterns of young skilled domestic talent could form the basis for policy discussions about the reliance on foreign talent to fill labour shortages.
Share of young skilled minority official language speakers varies considerably by province
For background, Chart 1 shows the relative sizes of MOLS populations among the young skilled population in each of the six provinces examined in this article. Not surprisingly, New Brunswick (Canada’s only officially bilingual province) had the highest share, at 36.5%. The young skilled MOLS population in Quebec ranked second in relative size (13.7%). All the other provinces registered relatively much smaller populations of MOLSs: Ontario (4.2%), Manitoba (3.6%), Nova Scotia (2.7%) and Alberta (1.3%). However, it is important to note that within each province, these populations may form significant shares of smaller communities, perhaps driving the local economy and even resulting in everyday use of their language in business and society.

Data table for Chart 1
| Percent | |
|---|---|
| Nova Scotia | 2.7 |
| New Brunswick | 36.5 |
| Quebec | 13.7 |
| Ontario | 4.2 |
| Manitoba | 3.6 |
| Alberta | 1.3 |
|
Notes: The denominator for all estimates is the population of future postsecondary graduates (skilled labour) residing in the province during high school. The numerator is the population of minority official language speakers among the population described in the denominator. The sample includes the 2010 to 2017 cohorts of postsecondary graduates. Sources: Statistics Canada, 2016 Census of Population, Postsecondary Student Information System, T1 Family File and Longitudinal Worker File. |
|
New Brunswick registered a net loss of one in five young skilled French speakers
Chart 2 shows gross and net skill losses and gains among the young MOLS population. Of course, the trends in the mobility of young skilled MOLSs may reflect, to some extent, the broader trends in the mobility of young skilled workers in these provinces. For example, when oil prices rise or fall, labour demand also rises or falls in Alberta and other oil-producing provinces, and this could affect the migration of large groups of youth. For this reason, the results in Chart 2 will also be discussed in this broader context by referring to Chart 3, which shows gross and net skill losses and gains among the young non-MOLS population.
New Brunswick registered the largest net losses of young skilled MOLSs (who spoke French in this case) in percentage terms (Chart 2). Specifically, among youth who obtained their postsecondary education between 2010 and 2017, went to high school in New Brunswick, and spoke French, 21% worked elsewhere two years after postsecondary graduation. New Brunswick did manage to recruit French-speaking postsecondary graduates who went to high school outside New Brunswick, but this amounted to 2% of its initial stock of future postsecondary graduates who spoke French and went to high school in New Brunswick. Thus, New Brunswick reported a net skill loss equivalent to 19% of its initial young skilled French-speaking population. This net skill loss was not unique to MOLSs in the province—New Brunswick also registered a net skill loss of non-MOLSs equivalent to 16% (also the largest among the six provinces). This may point to a broader reason behind the trends (e.g., economic opportunities). Whatever the reason, the result in Chart 2 does point to substantial net losses of young skilled French speakers in New Brunswick.
Two other provinces reported net skill losses with regard to their young MOLS population—Quebec (9% of its initial skilled English-speaking youth population) and Manitoba (6% of its initial skilled French-speaking youth population). While Manitoba also registered a substantial net skill loss of non-MOLSs (8%), this was not the case in Quebec (a net loss of 1%).
The other three provinces examined here all registered net skill gains in young skilled MOLSs. Alberta topped the list by a very wide margin, with a net skill gain of 70%. Although Alberta lost 15% of its young skilled French-speaking population, it managed to recruit a relatively large number of young skilled French speakers (equivalent to a skill gain of 85%). Although Alberta also topped the list in terms of net skill gain of non-MOLSs, this was well behind its net skill gain of MOLSs (20% compared with 70%).
Ontario registered the second-largest net skill gain among MOLSs, but it was well behind Alberta, at 13%. In contrast, Ontario registered a modest skill loss equivalent to 3% of its non-MOLS youth population. Similarly, Nova Scotia registered a net skill gain of 5% among MOLSs, but a net skill loss among non-MOLSs (9%).

Data table for Chart 2
| Skill loss | Skill gain | Net skill loss or gain | |
|---|---|---|---|
| percent | |||
| Nova Scotia | -29 | 34 | 5 |
| New Brunswick | -21 | 2 | -19 |
| Quebec | -17 | 8 | -9 |
| Ontario | -13 | 26 | 13 |
| Manitoba | -18 | 12 | -6 |
| Alberta | -15 | 85 | 70 |
|
Notes: The denominator for all estimates is the population of future postsecondary graduates (skilled labour) residing in the province during high school. The numerator is either the skilled labour leavers (loss) or entrants (gain) based on their province of work two years after graduation. The sample includes the 2010 to 2017 cohorts of postsecondary graduates who were minority official language speakers based on the province shown in the chart. Sources: Statistics Canada, 2016 Census of Population, Postsecondary Student Information System, T1 Family File and Longitudinal Worker File. |
|||

Data table for Chart 3
| Skill loss | Skill gain | Net skill loss or gain | |
|---|---|---|---|
| percent | |||
| Nova Scotia | -27 | 18 | -9 |
| New Brunswick | -32 | 16 | -16 |
| Quebec | -4 | 3 | -1 |
| Ontario | -8 | 5 | -3 |
| Manitoba | -17 | 9 | -8 |
| Alberta | -11 | 31 | 20 |
|
Notes: The denominator for all estimates is the population of future postsecondary graduates (skilled labour) residing in the province during high school. The numerator is either the skilled labour leavers (loss) or entrants (gain) based on their province of work two years after graduation. The sample includes the 2010 to 2017 cohorts of postsecondary graduates who did not speak a minority official language based on the province shown in the chart. Sources: Statistics Canada, 2016 Census of Population, Postsecondary Student Information System, T1 Family File and Longitudinal Worker File. |
|||
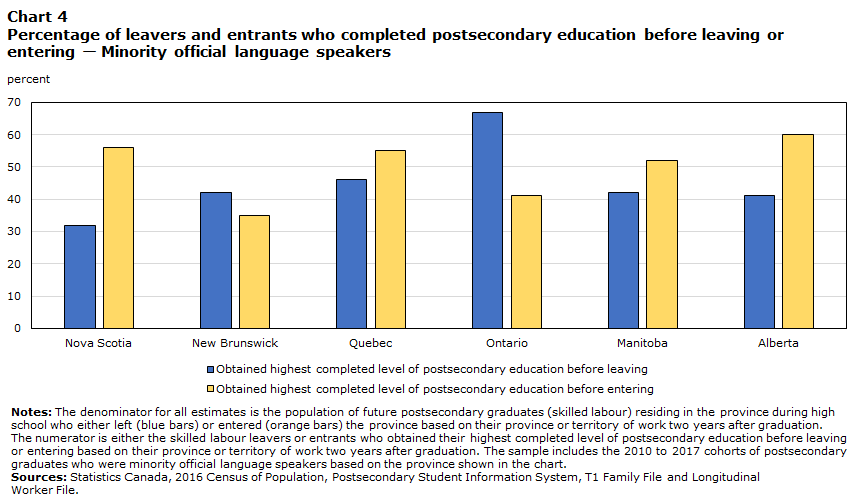
Two out of three departing young skilled French speakers from Ontario obtained their postsecondary credentials in Ontario before leaving
Whether a departing skilled youth obtains their postsecondary education before or after they leave the province is an important question from a fiscal point of view since postsecondary education is partially funded by the provinces. The same is true of young skilled talent entering a new province. Documenting such trends could also potentially inform recruitment and retention policies.
Chart 4 shows the percentage of leavers and entrants who completed postsecondary education before leaving or entering the province, respectively, for the sample of MOLSs. In the chart, a taller blue bar has more negative fiscal implications for the province in question, whereas a taller orange bar has more positive fiscal implications. Ontario leavers were the most likely to obtain their postsecondary credentials in Ontario before leaving (67%), far surpassing their Quebec counterparts (46%). In contrast, 41% of Ontario entrants obtained their postsecondary credentials before entering, while 55% of Quebec entrants did the same. In Nova Scotia and Alberta, entrants were far more likely to have completed their postsecondary education before arriving (56% and 60%, respectively) than leavers were before they left (32% and 41%, respectively). In New Brunswick, 42% of leavers obtained their postsecondary credentials before leaving, while 35% of entrants did the same before arriving.
Data table for Chart 4
| Obtained highest completed level of postsecondary education before leaving | Obtained highest completed level of postsecondary education before entering | |
|---|---|---|
| percent | ||
| Nova Scotia | 32 | 56 |
| New Brunswick | 42 | 35 |
| Quebec | 46 | 55 |
| Ontario | 67 | 41 |
| Manitoba | 42 | 52 |
| Alberta | 41 | 60 |
|
Notes: The denominator for all estimates is the population of future postsecondary graduates (skilled labour) residing in the province during high school who either left (blue bars) or entered (orange bars) the province based on their province or territory of work two years after graduation. The numerator is either the skilled labour leavers or entrants who obtained their highest completed level of postsecondary education before leaving or entering based on their province or territory of work two years after graduation. The sample includes the 2010 to 2017 cohorts of postsecondary graduates who were minority official language speakers based on the province shown in the chart. Sources: Statistics Canada, 2016 Census of Population, Postsecondary Student Information System, T1 Family File and Longitudinal Worker File. |
||
Net losses of New Brunswick French speakers were greater among degree holders
Which types of young skilled MOLSs do provinces tend to lose and gain? This question can be answered based on the shares with different levels of credentials, as well as the shares who graduated from certain disciplines. Only three provinces could be included for this part of the analysis because of smaller sample sizes: New Brunswick, Quebec and Ontario.
As shown in Table 1, New Brunswick lost a considerably larger share of its young skilled MOLS population who obtained a degree (26%) compared with their counterparts who obtained a certificate or diploma (14%). This was not counterbalanced by greater skill gains in degree holders (3%) compared with certificate or diploma holders (2%).
In Quebec and Ontario, the skill losses were much closer between the two types of credentials. While Quebec did not make up for these losses through gains in both types of graduates, Ontario did in both cases. This was especially the case for degree holders in Ontario, where the gains (34%) far outweighed the losses (15%), resulting in a net gain of 19%.Note
| Province | Certificate or diploma | Degree (bachelor's, graduate or professional) | ||||
|---|---|---|---|---|---|---|
| Skill loss | Skill gain | Net skill loss or gain | Skill loss | Skill gain | Net skill loss or gain | |
| percent | ||||||
| New Brunswick | 14 | 2 | -12 | 26 | 3 | -23 |
| Quebec | 16 | 8 | -8 | 17 | 8 | -8 |
| Ontario | 11 | 15 | 5 | 15 | 34 | 19 |
|
Notes: The denominator for all estimates is the population of future postsecondary graduates (skilled labour) residing in the province during high school. The numerator is either the skilled labour leavers (loss) or entrants (gain) based on their province of work two years after graduation. The sample includes the 2010 to 2017 cohorts of postsecondary graduates. Sources: Statistics Canada, 2016 Census of Population, Postsecondary Student Information System, T1 Family File and Longitudinal Worker File. |
||||||
The disciplines that the losses and gains were registered in were grouped into two broad categories. The first consists of fields that previous research has generally linked to relatively high pay, including STEMNote disciplines that are mathematics intensive (i.e., engineering, mathematics, computer sciences, physics and chemistry programs), as well as business, health and law (LLB, JD, BCL) programs (three examples of BHASENote programs).Note Note Note The second category consists of all other programs. In general, these programs are associated with lower pay. The breakdown into generally higher- and generally lower-paying fields is informative because high pay may indicate high demand or low supply. Moreover, recruiting and retaining graduates from generally higher-paying disciplines have important fiscal implications for provinces from a tax revenue perspective.
The results shown in Table 2 suggest that New Brunswick was somewhat more likely to lose young skilled MOLSs from the generally lower-paying disciplines (23%) than from the generally higher-paying disciplines (18%). The same was true for Quebec (19% and 14%, respectively), while in Ontario, there was little difference (13% and 14%, respectively).
In terms of recruiting young skilled MOLSs, Ontario fared relatively better at attracting them from generally higher-paying disciplines (32%) compared with those from generally lower-paying disciplines (23%). The shares of skill gains were much closer for both types of disciplines in New Brunswick and Quebec.
| Province | Engineering, mathematics, computer sciences, physics, chemistry, business, health and law programs | All other programs | ||||
|---|---|---|---|---|---|---|
| Skill loss | Skill gain | Net skill loss or gain | Skill loss | Skill gain | Net skill loss or gain | |
| percent | ||||||
| New Brunswick | 18 | 3 | -15 | 23 | 2 | -21 |
| Quebec | 14 | 7 | -8 | 19 | 10 | -9 |
| Ontario | 14 | 32 | 19 | 13 | 23 | 10 |
|
Notes: The denominator for all estimates is the population of future postsecondary graduates (skilled labour) residing in the province during high school. The numerator is either the skilled labour leavers (loss) or entrants (gain) based on their province of work two years after graduation. The sample includes the 2010 to 2017 cohorts of postsecondary graduates. Sources: Statistics Canada, 2016 Census of Population, Postsecondary Student Information System, T1 Family File and Longitudinal Worker File. |
||||||
Conclusion
Building and maintaining vibrant communities may require young skilled labour. However, retaining and recruiting young skilled talent may be challenging, especially in communities where the main language spoken is a minority official language (i.e., English in Quebec or French elsewhere). This article informs the issue by estimating gains and losses of young skilled MOLSs in various provinces.
Several interesting findings resulted from the analysis. For example, New Brunswick registered a net loss of one in five (or -19% of) young, skilled French speakers who obtained their postsecondary education between 2010 and 2017 and were followed two years after graduation. The net losses in New Brunswick were greater among degree holders (one in four). In contrast, Alberta was by far the largest net gainer of young skilled MOLSs (70%). Two out of three departing young skilled French speakers from Ontario (67%) obtained their postsecondary credentials in Ontario before leaving, far ahead of all other provinces examined. However, Ontario was a net gainer overall, especially among degree holders, as well as among graduates of generally higher-paying fields of study.
It is important to note that these data predate the COVID-19 pandemic and the recent increase in telework. It may now be easier for certain workers to remain in their home province or territory while they work (remotely) in a different part of the country. This may be especially true for postsecondary graduates, since they are considerably more likely to be employed in a job where telework is possible than other workers (Deng et al., 2020). While this could reduce available skilled labour for local employers in certain areas, the fact that workers can continue to live (and spend) where they grew up (rather than move away) could mitigate the economic losses for jurisdictions of origin (i.e., the resource may be gone, but the dollars are still spent locally). Future research with more recent data could examine this dynamic.
References
Deng, Z., R. Morissette and D. Messacar. 2020. Running the economy remotely: Potential for working from home during and after COVID-19. StatCan COVID-19: Data to Insights for a Better Canada.https://www150.statcan.gc.ca/n1/pub/45-28-0001/2020001/article/00026-eng.htm
Frenette, M. and T. Handler. 2020. Which Bachelor’s Degree Programs Were Associated with the Highest Pay Prior to the COVID-19 Pandemic? A Focus on Very Detailed Fields of Study. Economic Insights. No. 120. https://www150.statcan.gc.ca/n1/pub/11-626-x/11-626-x2020018-eng.htm
Frenette, M. and T. Handler. 2024. Retention and recruitment of young skilled workers: Results by province and territory. Economic and Social Reports.Vol. 4, No. 3. https://www150.statcan.gc.ca/n1/en/catalogue/36280001202400400003
Laporte, C. and R. Mueller. 2011. The Completion Behaviour of Registered Apprentices: Who Continues, Who Quits, and Who Completes Programs? Analytical Studies Branch Research Paper Series, no. 422. Statistics Canada Catalogue no. 11F0019M. Ottawa: Statistics Canada. https://www150.statcan.gc.ca/n1/pub/11f0019m/11f0019m2011333-eng.htm
- Date modified: