
Economic and Social Reports
The social networks of immigrant women
DOI: https://doi.org/10.25318/36280001202400400006-eng
Text begins
Abstract
This study used data from the 2020 General Social Survey to examine the social connectedness of immigrant women to Canadian society. The size and composition of immigrant women’s personal networks varied by their sociodemographic, immigrant-specific and residential characteristics, and by population group. Most subgroups of immigrant women had smaller social networks than their Canadian-born counterparts, although for some, the difference was small. Most of the differences between immigrants and Canadian-born women were related to weak ties, and for most subgroups there were no or fewer differences in the number of strong ties that composed their networks. Most subgroups of immigrant women had more inter-ethnic friends than Canadian-born women, even though their networks were mostly homogenous in ethnic composition.
Keywords: Immigrant women, social networks, social capital, immigrant integration
Authors
Max Stick and Christoph Schimmele are with the Social Analysis and Modelling Division at Statistics Canada. Maciej Karpinski and Amélie Arsenault are with the Research and Knowledge Mobilization Division at Immigration, Refugees and Citizenship Canada.
Acknowledgments
The authors thank Rubab Arim, Christopher Hamilton, Feng Hou, Martin Turcotte and Li Xue for their advice and comments on an earlier version of this paper.
Introduction
Social connections and relationships are important, yet often overlooked, indicators of well-being (Stiglitz, Sen, & Fitoussi, 2009). Personal networks (“who you know”) have value that is similar to that of human capital (“what you know”) for attaining sought-after ends and broadly improving life chances (Lin, 2001). Among immigrants, differences in personal networks are reasons for who thrives and becomes well-integrated versus who is susceptible to unfavourable outcomes. Immigrants with expansive networks in Canada have higher employment rates, greater employment earnings and higher-prestige occupations than those with sparse connections or socially homogenous networks (Nakhaie & Kazemipur, 2013; Ooka & Wellman, 2006; Xue, 2008). Social connections are also associated with various other outcomes among Canadian immigrants, such as their sense of belonging to the local community (Drolet & Moorthi, 2018), life satisfaction (Li, 2020), political engagement (Gidengil & Stolle, 2009) and health status (Zhao, Xue, & Gilkinson, 2010).
Many immigrants have family or friends in Canada before arrival, though this depends on characteristics such as admission category, gender and age at arrival (Evra & Kazemipur, 2019). Even so, immigration inevitably disrupts and decreases personal networks to some extent, and newcomers need to develop new connections to enhance their prospects for integration. However, immigrants are not equally positioned in Canada and have different settlement experiences, which affect their social integration (Soltane, 2020). In particular, gender roles and inequalities in the settlement process are intertwined with the time available for social participation and the types of social environments (e.g., workplace, neighbourhood) where social connections are made. Thus, there are reasons to expect that networks are disrupted and transformed to a different extent and in different ways for immigrant women than for immigrant men (Couton & Gaudet, 2008).
Studies on sex differences in the economic integration of immigrants highlight some of the unique difficulties that immigrant women encounter. The intersection between sex and immigrant status differentiates immigrant women from Canadian-born women, as well as from their male counterparts. First, sex disparities in employment status, education–occupation mismatch and employment income are larger among immigrants than Canadian-born people. Second, the gaps in these outcomes are wider between immigrant women and Canadian-born women than between immigrant men and Canadian-born men (Gu, 2023; Hudon, 2015). These differences in economic outcomes have additional implications for the integration of immigrant women. For example, labour segmentation can constrict the variety of social contacts made through employment, reducing access to the social capital needed for career mobility and social incorporation into the receiving society (Hagan, 1998).
Couton and Gaudet (2008) show the contingent nature of social integration among Canadian immigrants. According to their study, some groups of immigrants are at greater risk of social isolation than others. Focusing on network-based activities (favour exchange and volunteering), Couton and Gaudet found that most of the difference between immigrants and Canadian-born people was in rates of participation, and there was less of a difference in the amount of time spent on these activities. Put differently, for some groups of immigrants, there appear to be barriers that decrease their rate of social participation, while other immigrants are able to participate at similar levels as Canadian-born people. Furthermore, the life-course patterns of participation in these activities for immigrants were dissimilar from those of their Canadian-born counterparts. According to Couton and Gaudet, parenthood and middle adulthood are peak times for participation among the Canadian born, but these life-course stages are associated with low or stagnant rates of participation for immigrants.
One of Couton and Gaudet’s (2008, p. 39) conclusions is that “women’s social network structures tend to be particularly disrupted after migration” because of gender dynamics in family-based processes of resettlement. This suggests that there are gender-specific barriers to participation in network-based activities that interact with other characteristics, such as parenthood. Generally, immigrant women have lower levels of social integration than Canadian-born women. This disparity has been observed for network size and membership in community associations (Hudon, 2015), in addition to the rates of network-based activities that Couton and Gaudet examined. Couton and Gaudet’s study is a source of information on what immigrant women give, in terms of social engagement (e.g., volunteering), but not about differences in what immigrant women have, in terms of their social connectedness and network-based assets.
Aside from Couton and Gaudet (2008), few Canadian studies have examined how social status and life-course events shape the social lives of immigrants, and none have explicitly focused on variation among immigrant women. This is a major shortfall in knowledge, considering that deficiencies in social connections to Canadian society can generate and sustain social and economic inequalities (Ooka & Wellman, 2006). To address this knowledge gap, this study examines how immigrant women’s sociodemographic characteristics and life-course circumstances are associated with their social connections. The study examines differences in the extent to which immigrant women are able to develop networks in Canada and achieve a similar level of social connectedness to that of Canadian-born women.
Data and methods
The data for this study came from the 2020 General Social Survey (GSS) – Social Identity. The GSS is an annual cross-sectional survey that collects information on social trends and the well-being of Canadians. The target population of the 2020 GSS was Canadians aged 15 years and older from the 10 provinces, excluding full-time residents of institutions and First Nations reserves. The 2020 GSS was fielded from August 2020 to February 2021, coinciding with the COVID-19 pandemic.Note The sample size was 34,044 respondents, which included 13,931 landed immigrants. The study sample consisted of 6,395 immigrant women and 7,186 women in the third generation or more (i.e., Canadian-born people with all parents born in Canada) from the White population group.
The study compared immigrant women with White women in the third generation or more (henceforth, Canadian-born women) in terms of the structural characteristics of their networks.Note Network size and composition were measured with variables on the number of close friends and the number of acquaintances who resided in the same city or local community as the respondent. The GSS defined close friends as “people who are not your relatives, but who you feel at ease with, can talk to about what is on your mind, or call on for help.” Acquaintances are “other friends” who are neither close friends nor relatives. Inter-ethnic friendships were defined as the proportion of friends (among those whom the respondent had contact with in the past month) whom the respondent perceived to be from a “visibly different” ethnic group than their own.
The analysis used contingency tables to compare immigrant women with Canadian-born women within sociodemographic categories and to examine how immigrant-specific characteristics (e.g., age at arrival, years since landing) influence their differences from Canadian-born women. Estimates were calculated with survey weights to account for possible over- or under-representation of some demographic groups. Bootstrap weights were used in calculations of statistical significance to address the complex survey design of the GSS.
Social connections among immigrant women
Main concepts
Granovetter (1973) has classified social connections into “strong” and “weak” ties. Strong ties refer to close friends and relatives, or the inner circle of a person’s social network. Strong ties are sources of social support that decrease the costs of immigration and smooth the adaptation process (Hagan, 1998; Majerski, 2019). Weak ties refer to acquaintances or people who are relatively disconnected from a person’s inner circle. For immigrants, weak ties are bridges into the networks of native-born people and sources of informational resources needed for economic integration (Lancee, 2012). Canadian immigrants with few or no connections outside their inner circle have lower prospects for integration than those with an abundance of weak ties (Majerski, 2019; Nakhaie & Kazemipur, 2013).
As Turcotte (2015) states, there is no optimal network size, as this depends on personal needs and preferences. However, immigrants with smaller or socially homogenous networks tend to have less favourable outcomes, as noted above. Turcotte’s estimates based on the 2013 GSS provide a sense of the typical size of Canadians’ networks of strong and weak ties. Three-quarters of Canadians aged 15 and older had at least three close friends, and about two-fifths had three to five close friends. Three-fifths of Canadians had more than 10 acquaintances, although one-fifth had 5 or fewer. This implies that people who have fewer than 3 close friends or fewer than 10 acquaintances have atypically small networks, compared with most Canadians.
Sociodemographic characteristics affect differences in network size between immigrant and Canadian-born women
Immigrant women had an average of four close friends in the local area, similar to Canadian-born women (Table 1). Immigrant women had an average of 13 acquaintances in the local area, 3 fewer than Canadian-born women. These overall-level comparisons conceal sources of variation. To unpack this variation, immigrant women were compared with Canadian-born women with the same sociodemographic characteristics (e.g., the same educational attainment), revealing the groups of immigrant women who had smaller or larger personal networks than their Canadian-born counterparts, and those whose networks were similar.
At most levels of educational attainment, immigrant women had a similar number of close friends as Canadian-born women, but a smaller number of acquaintances. Immigrant women with a high school diploma or less had 11 acquaintances, while Canadian-born women with a similar level of education had 15 acquaintances. The difference between immigrant and Canadian-born women was smaller or converse at higher levels of education. Immigrant women with a college, CEGEP or other non-university diploma or certificate or a university diploma or certificate below the bachelor’s level had three fewer acquaintances and those with a bachelor’s degree or higher had four fewer than their Canadian-born counterparts. A converse pattern was found among women with a trades certificate or diploma: immigrants had more close friends and acquaintances than Canadian-born women, although these differences were not statistically significant.
| Close friends | Acquaintances | |||
|---|---|---|---|---|
| Immigrant women |
Canadian-born women (ref.) | Immigrant women |
Canadian-born women (ref.) | |
| observed mean | ||||
| Overall | 3.8 | 4.0 | 12.9Note * | 16.0 |
| Educational attainment | ||||
| High school or less | 3.7 | 4.2 | 10.9Note * | 15.1 |
| Trades certificate or diploma | 5.4Note E: Use with caution | 3.3 | 14.3Note E: Use with caution | 12.6 |
| Non-university diploma or certificate | 3.8 | 3.8 | 12.8Note * | 16.0 |
| Bachelor's degree or higher | 3.7 | 4.1 | 14.1Note * | 17.9 |
| Employment status | ||||
| Employed | 3.7 | 4.0 | 13.7Note * | 17.2 |
| Unemployed | 2.7Note * | 4.1 | 11.0 | 15.1 |
| Not in labour force | 4.2 | 3.9 | 11.9Note * | 13.9 |
| Marital status | ||||
| Married with children younger than 18 at home | 3.6 | 3.8 | 13.4Note * | 18.2 |
| Married without children younger than 18 at home | 3.9 | 3.9 | 12.8Note * | 15.4 |
| Divorced, separated or widowed | 4.3 | 4.0 | 10.9 | 12.8 |
| Never married | 3.1Note * | 4.3 | 13.3Note * | 17.5 |
| One-parent family | 5.6 | 3.5 | 16.5 | 14.8 |
| Age group | ||||
| 15 to 24 years | 3.1Note *Note E: Use with caution | 4.7 | 13.3Note *Note E: Use with caution | 19.0 |
| 25 to 34 years | 2.6Note * | 3.6 | 12.3Note * | 16.1 |
| 35 to 54 years | 4.0 | 4.0 | 13.8Note * | 18.0 |
| 55 years or older | 4.3 | 3.9 | 12.1Note * | 13.6 |
E use with caution
Source: Statistics Canada, General Social Survey, 2020. |
||||
Immigrant women who were unemployed had an average of 2.7 close friends, compared with 4.1 for Canadian-born women who were unemployed. Of course, a person cannot have a fractional number of friends. The group averages of 2.7 versus 4.1 show that a comparatively larger proportion of immigrant women from this group had two or fewer close friends. Notably, while unemployment decreased the number of close friends for immigrant women, this was not the case for Canadian-born women. Among women who were employed, unemployed and not in the labour force, immigrants had fewer acquaintances than their Canadian-born counterparts. The difference between immigrant and Canadian-born women was largest among those in the unemployed group and smallest among those in the group who were not in the labour force.
Among married women, immigrants had a similar number of close friends as Canadian-born women, but fewer acquaintances. This difference was particularly large for immigrant women with children younger than 18 years at home, who had five fewer acquaintances. Among women who were never married, immigrants also had fewer close friends and acquaintances than Canadian-born women. By contrast, among women in one-parent families, immigrant women had comparatively more close friends and acquaintances than Canadian-born women, but this difference was not statistically significant. Living in a one-parent family also appears to have had different implications for immigrant women than for Canadian-born women. Among Canadian-born women, those who were married with children at home had larger personal networks than those who were in one-parent families, but the opposite was true for immigrant women.
Generally, younger Canadians have a larger number of close friends and acquaintances than middle-aged and older people (Turcotte, 2015). Immigrant women were an exception to this pattern, where younger age was associated with fewer social connections. While Canadian-born women aged 15 to 24 had more close friends than those aged 55 and older, immigrant women aged 15 to 24 had fewer close friends than those aged 55 and older. Immigrant women aged 15 to 24 had 3.1 close friends, compared with 4.7 for Canadian-born women of the same age group and 4.3 among immigrant women aged 55 and older. Among women aged 25 to 34, immigrants had one fewer close friend than Canadian-born women. Across all ages, immigrant women had fewer acquaintances than Canadian-born women. The difference was largest among younger people. Among those aged 15 to 24, immigrant women had 13 acquaintances, almost 6 fewer than Canadian-born women.
The role of immigrant characteristics
Factors such as years since landing, age at arrival in Canada, admission class and the ability to speak either English or French influenced how immigrant women compared with Canadian-born women regarding their social ties to the local area (Table 2).
Compared with Canadian-born women, recent immigrants (zero to five years since landing) had one fewer close friend. Medium-term immigrants (six to nine years since landing) also had a smaller network of close friends, but this difference was not statistically significant. Established immigrants (10 years or more since landing) had a similar number of close friends as Canadian-born women. Across years since landing categories, immigrant women had fewer acquaintances than Canadian-born women. The largest gap was found for recent immigrants, who had six fewer. This gap decreased to three fewer acquaintances for medium-term immigrants and two fewer for established immigrants.
Age at arrival did not contribute to a difference between immigrant and Canadian-born women in the number of close friends, but it did in the number of acquaintances. Immigrant women aged 0 to 14 at arrival had a similar number of acquaintances as Canadian-born women. By contrast, immigrant women aged 15 to 24 and 25 or older at arrival had nearly four fewer acquaintances.
Women who arrived as family-sponsored immigrants or refugees had fewer close friends than Canadian-born women, while those who were admitted as economic immigrants (both women who were principal applicants and women who were the spouses or dependants of principal applicants) had a similar number. Women who were admitted as economic immigrants (principal applicants only), family-sponsored immigrants or refugees had fewer acquaintances than Canadian-born women. This ranged from two fewer acquaintances among economic immigrants, to four fewer among family-sponsored immigrants and to five fewer among refugees.
| Close friends | Acquaintances | |
|---|---|---|
| observed mean | ||
| Canadian-born women (ref.) | 4.0 | 16.0 |
| Immigrant women | ||
| Years since landing | ||
| 0 to 5 years | 3.1Note * | 10.2Note * |
| 6 to 9 years | 3.2 | 13.1Note * |
| 10 years or more | 4.0 | 13.5Note * |
| Age at arrival | ||
| 0 to 14 years | 3.9 | 15.2 |
| 15 to 24 years | 3.6 | 12.4Note * |
| 25 years or older | 3.8 | 12.1Note * |
| Admission category | ||
| Economic immigrant—principal applicant | 4.0 | 13.8Note * |
| Economic immigrant—spouse or dependant | 3.9 | 14.6 |
| Family sponsored | 3.4Note * | 12.3Note * |
| Refugee | 2.7Note * | 11.1Note * |
| Speaks English or French | ||
| Yes | 3.8 | 13.1Note * |
| No | 2.6 | 8.3 |
Source: Statistics Canada, General Social Survey, 2020. |
||
The GSS asked respondents: “Can you speak English or French well enough to conduct a conversation?” Among those who answered “English only,” “French only” or “both English and French,” immigrant women had an average of 3.8 close friends and 13.1 acquaintances. This compared with 2.6 close friends and 8.3 acquaintances among immigrant women who could not speak an official language.Note Those in the latter linguistic group had more than one fewer close friend than Canadian-born women and half as many acquaintances.
The role of residential context
The neighbourhood is a primary environment where immigrant women develop their social networks after arrival in Canada, particularly their strong ties to the local area (Table 3). Among women who lived in their neighbourhood for less than three years, immigrants had fewer close friends than Canadian-born women, but there was no difference between longer-term residents—it appears that immigrants overcome their initial disadvantage after a few years. Immigrant women in the neighbourhood for five years or more had 4.3 close friends, compared with 2.7 among their counterparts with less than three years of residence.
| Close friends | Acquaintances | |||
|---|---|---|---|---|
| Immigrant women |
Canadian-born women (ref.) | Immigrant women |
Canadian-born women (ref.) | |
| observed mean | ||||
| Years in neighbourhood | ||||
| Less than three years | 2.7Note * | 3.4 | 11.9Note * | 14.9 |
| Three to less than five years | 3.7 | 3.8 | 12.2 | 14.7 |
| Five years or more | 4.3 | 4.1 | 13.4Note * | 16.4 |
| Homeownership status | ||||
| Owner | 3.9 | 4.1 | 13.1Note * | 16.5 |
| Renter | 3.3 | 3.7 | 12.6 | 14.2 |
| Geographic area | ||||
| Montréal | 3.6 | 3.4 | 13.8 | 13.1 |
| Toronto | 3.6 | 3.5 | 11.8Note * | 14.9 |
| Vancouver | 4.0 | 4.9 | 15.1 | 17.8Note E: Use with caution |
| Medium-sized CMAs | 4.0 | 4.3 | 14.4Note * | 18.1 |
| Small CMAs | 3.5 | 4.2 | 10.6Note * | 17.6 |
| Outside CMAs | 4.0 | 3.9 | 13.1 | 14.9 |
E use with caution
Source: Statistics Canada, General Social Survey, 2020. |
||||
Immigrant women gained most of their acquaintances within three years of residence in their current neighbourhood, or already had these acquaintances before moving to the neighbourhood. Immigrants in the neighbourhood for less than three years had 12 acquaintances and those in the neighbourhood for five years or more had 13 acquaintances, 3 fewer than Canadian-born women. Because immigrants acquire few acquaintances after three years in the neighbourhood, their initial difference with Canadian-born women is persistent.
Homeownership status did not contribute to a difference between immigrant and Canadian-born women in their strong ties to the local community. However, immigrant women who were homeowners had more than three fewer acquaintances than Canadian-born women who were homeowners. The difference between immigrant and Canadian-born women who were renters was smaller and not statistically significant.
The population size of the geographic area where immigrant women lived did not contribute to a difference from Canadian-born women in the number of close friends, but it was relevant for differences in acquaintances. In Toronto, immigrant women had three fewer acquaintances than Canadian-born women. Immigrants in Montréal had slightly more acquaintances and those in Vancouver had fewer acquaintances than Canadian-born women in the same census metropolitan area (CMA), but these differences were not statistically significant. In medium-sized CMAs, immigrant women had four fewer acquaintances than Canadian-born women, while immigrant women from small CMAs had seven fewer acquaintances than Canadian-born women.Note Outside CMAs, immigrant women had fewer acquaintances than Canadian-born women, but this difference was not statistically significant.Note
Differences in network size across population groups
The majority of immigrants (70%) are from racialized groups, and each of these groups accounts for a small proportion of the Canadian population (Hou, Schimmele, & Stick, 2023). The combination of small group size and preferences for homophily in friendships (Cheng & Xie, 2013) may contribute to differences in network size. Table 4 compares immigrant women, by population group, with Canadian-born women, in terms of the number of social contacts. Population group refers to self-identification as White, Black, Chinese, South Asian, Filipino and Southeast Asian, Arab and West Asian, or Latin American.Note
Immigrant women from the White population group had a similar number of close friends as Canadian-born women. Immigrant women from the Black, Chinese, and Arab and West Asian population groups had significantly fewer close friends than Canadian-born women. The number of close friends among South Asian and Latin American immigrant women was also lower, compared with Canadian-born women, but this difference was not statistically significant.
The number of acquaintances ranged from a low of 9.5 among immigrant women from the Black population group to a high of 15.2 among those from the Filipino and Southeast Asian population group. Compared with Canadian-born women, immigrant women from the Black population group had nearly seven fewer acquaintances, those from the South Asian population group had more than four fewer and those from the White population group had more than three fewer. The differences between immigrant women from the Chinese, Filipino and Southeast Asian, Arab and West Asian, and Latin American population groups and Canadian-born women ranged from one to three fewer acquaintances, but these differences were not statistically significant.
| Close friends | Acquaintances | |||
|---|---|---|---|---|
| Immigrant women |
Canadian-born women (ref.) | Immigrant women |
Canadian-born women (ref.) | |
| observed mean | ||||
| White | 3.9 | 4.0 | 12.7Note * | 16.0 |
| Black | 2.8Note * | Note ...: not applicable | 9.5Note * | Note ...: not applicable |
| Chinese | 3.4Note * | Note ...: not applicable | 13.7 | Note ...: not applicable |
| South Asian | 3.7 | Note ...: not applicable | 11.7Note * | Note ...: not applicable |
| Filipino and Southeast Asian | Note F: too unreliable to be published | Note ...: not applicable | 15.2Note E: Use with caution | Note ...: not applicable |
| Arab and West Asian | 3.2Note *Note E: Use with caution | Note ...: not applicable | 13.7 | Note ...: not applicable |
| Latin American | 3.4Note E: Use with caution | Note ...: not applicable | 12.6Note E: Use with caution | Note ...: not applicable |
|
... not applicable E use with caution F too unreliable to be published
Source: Statistics Canada, General Social Survey, 2020. |
||||
Inter-ethnic friendships
The GSS asked respondents: “Of all the friends you had contact with in the past month, approximately how many come from an ethnic group that is visibly different from yours?” At the overall level, one-quarter of immigrant women had no contact with friends from an inter-ethnic group and two-fifths had contact with “a few” inter-ethnic friends (Appendix Table 1). This means that two-thirds of immigrant women had social networks that were largely homogenous, in terms of ethnic composition. The inter-ethnic composition of networks was fairly similar for recent, medium-term and established immigrants.
Fewer immigrant women aged 0 to 14 years at arrival (17%) had no friends from an inter-ethnic group than those aged 15 to 24 (28%) and 25 or older (28%) at arrival. About two-fifths of those aged 0 to 14 at arrival reported that at least half of their social contacts were inter-ethnic. Similarly, immigrants from younger age groups had networks that were more ethnically diverse than those of immigrants from older age groups.
Not knowing English or French was a barrier to the formation of inter-ethnic ties among immigrant women. Among immigrant women who could not speak either English or French well enough to conduct a conversation, 69% had no inter-ethnic friends, compared with 24% of those who could speak English or French.
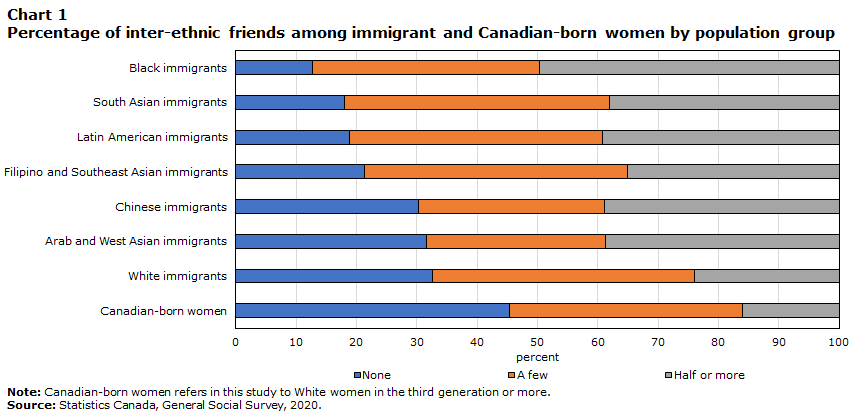
The proportion of inter-ethnic connections in immigrant women’s networks differed across population groups (Chart 1). Among immigrants from the Black population group, a small proportion had no inter-ethnic friends. One-fifth of immigrants from the South Asian, Filipino and Southeast Asian, and Latin American population groups had no inter-ethnic friends. Among immigrants from the White, Chinese, and Arab and West Asian population groups, about one-third had no inter-ethnic friends.
Data table for Chart 1
| None | A few | Half or more | |
|---|---|---|---|
| percent | |||
| Canadian-born women | 45.3 | 38.7 | 16.1 |
| White immigrants | 32.6 | 43.5 | 23.9 |
| Arab and West Asian immigrants | 31.6 | 29.6 | 38.8 |
| Chinese immigrants | 30.2 | 31.0 | 38.8 |
| Filipino and Southeast Asian immigrants | 21.2 | 43.7 | 35.1 |
| Latin American immigrants | 18.8 | 42.0 | 39.2 |
| South Asian immigrants | 18.1 | 43.9 | 38.1 |
| Black immigrants | 12.7 | 37.7 | 49.6 |
|
Note: Canadian-born women refers in this study to White women in the third generation or more. Source: Statistics Canada, General Social Survey, 2020. |
|||
In terms of diversity, one-half of immigrant women from the Black population group and two-fifths of those from the Latin American, Arab and West Asian, South Asian, and Chinese population groups reported that at least half of their friends were inter-ethnic. Over one-third of immigrant women from the Filipino and Southeast Asian population group and under one-quarter of immigrant women from the White population group reported that at least half of their friends were inter-ethnic.
Conclusion
This study compared immigrant and Canadian-born women in terms of the size and composition of their social networks in Canada, using data from the 2020 GSS – Social Identity. Some key findings are highlighted below.
Generally, immigrant women had a similar number of close friends (strong ties) as their Canadian-born counterparts, with some exceptions. Recent immigrants had fewer close friends than Canadian-born women, but immigrants acquired a similar number with longer residence in Canada. The neighbourhood is an important environment where immigrants develop strong ties to the local community. There was a large difference in the number of close friends between immigrant and Canadian-born women who had lived in the same neighbourhood for less than three years, but no difference between those who lived in the neighbourhood for a longer time. Strong ties are an important source of social capital that immigrants use to adapt to the receiving country, such as securing employment (Evra & Kazemipur, 2019; Goel & Lang, 2019). This may particularly be the case for recent immigrants and those from racialized groups who have fewer contacts outside their inner circle (Amado, 2006).
More persistent and widespread differences from Canadian-born women were observed for immigrant women’s networks of acquaintances (weak ties). The difference in the number of acquaintances from Canadian-born women was largest for recent immigrants, but even established immigrants had fewer acquaintances. Within most of the sociodemographic groups compared, immigrant women had fewer acquaintances. These ties are sources of social capital that are unavailable from strong ties and are the bridges into the networks of the native-born population (Granovetter, 1973; Lancee, 2012). Fewer acquaintances imply a greater level of social disconnection from the native-born population and narrower avenues for integration. Immigrants need weak ties for integration because their strong ties have less value for socioeconomic mobility and social incorporation (Hagan, 1998; Nakhaie & Kazemipur, 2013; Ooka & Wellman, 2006).
Several demographic groups stood out for having smaller networks (both strong and weak ties) than most Canadians. A comparatively high proportion of immigrant women from the Black population group had 2 or fewer close friends and fewer than 10 acquaintances. Being a refugee and not speaking an official language were other characteristics that were associated with smaller networks. For their age group, younger women also had small networks. Having a smaller network at younger ages may have long-term consequences for immigrants because of the linkage between social capital and socioeconomic mobility, life satisfaction and other outcomes (Li, 2020; Xue, 2008).
Since most immigrants are from racialized groups, the majority of people they encounter in their daily lives will be from a different ethnic group. This increases their chances of inter-ethnic friendships. Such friendships are an indicator of immigrant integration, especially for those from racialized groups (Martinović, van Tubergen, & Maas, 2011; Soltane, 2020). Despite having higher chances of meeting people from different ethnic groups, a high proportion of immigrant women from most population groups (except Black people) had networks that were largely homogenous in ethnic composition. Overdependence on co-ethnic networks can have negative effects, such as entrapping immigrants in low-paying jobs or vulnerable social status (Hagan, 1998; Lancee, 2012; Majerski, 2019). This implies that, even when immigrant women’s networks are similar in size to those of Canadian-born women, there are compositional differences that could impede their prospects for integration.
Appendix
| None | A few | Half or more | ||||
|---|---|---|---|---|---|---|
| Immigrant women |
Canadian-born women (ref.) | Immigrant women |
Canadian-born women (ref.) | Immigrant women |
Canadian-born women (ref.) | |
| percent | ||||||
| Overall | 25.2Note * | 45.3 | 39.7 | 38.7 | 35.1Note * | 16.1 |
| Years since landing | ||||||
| 0 to 5 years | 28.8Note * | Note ...: not applicable | 37.4 | Note ...: not applicable | 33.8Note * | Note ...: not applicable |
| 6 to 9 years | 23.0Note * | Note ...: not applicable | 42.3 | Note ...: not applicable | 34.7Note * | Note ...: not applicable |
| 10 years or more | 24.6Note * | Note ...: not applicable | 39.8 | Note ...: not applicable | 35.6Note * | Note ...: not applicable |
| Age at arrival | ||||||
| 0 to 14 years | 16.6Note * | Note ...: not applicable | 44.2 | Note ...: not applicable | 39.2Note * | Note ...: not applicable |
| 15 to 24 years | 28.4Note * | Note ...: not applicable | 38.8 | Note ...: not applicable | 32.8Note * | Note ...: not applicable |
| 25 years or older | 27.6Note * | Note ...: not applicable | 37.9 | Note ...: not applicable | 34.5Note * | Note ...: not applicable |
| Admission category | ||||||
| Economic immigrant—principal applicant | 18.1Note * | Note ...: not applicable | 49.1Note * | Note ...: not applicable | 32.7Note * | Note ...: not applicable |
| Economic immigrant—spouse or dependant | 24.4Note * | Note ...: not applicable | 40.5 | Note ...: not applicable | 35.1Note * | Note ...: not applicable |
| Family sponsored | 28.3Note * | Note ...: not applicable | 31.2Note * | Note ...: not applicable | 40.6Note * | Note ...: not applicable |
| Refugee | 19.1Note * | Note ...: not applicable | 27.7 | Note ...: not applicable | 53.2Note * | Note ...: not applicable |
| Speaks English or French | ||||||
| Yes | 24.2Note * | 45.3 | 40.4 | 38.6 | 35.4Note * | 16.1 |
| No | 69.0 | Note x: suppressed to meet the confidentiality requirements of the Statistics Act | 7.5 | Note x: suppressed to meet the confidentiality requirements of the Statistics Act | 23.6 | Note x: suppressed to meet the confidentiality requirements of the Statistics Act |
| Educational attainment | ||||||
| High school or less | 26.7Note * | 47.9 | 35.2 | 34.3 | 38.2Note * | 17.9 |
| Trades certificate or diploma | 38.0 | 51.5 | 33.7 | 35.7 | 28.3Note * | 12.8 |
| Non-university diploma or certificate | 24.1Note * | 46.4 | 41.3 | 39.4 | 34.5Note * | 14.3 |
| Bachelor's degree or higher | 24.0Note * | 39.6 | 42.0 | 43.9 | 34.0Note * | 16.5 |
| Employment status | ||||||
| Employed | 21.5Note * | 41.0 | 42.2 | 42.7 | 36.3Note * | 16.4 |
| Unemployed | 20.4Note * | 32.9 | 43.3 | 48.6 | 36.3Note * | 18.5 |
| Not in labour force | 32.9Note * | 53.7 | 34.3 | 31.1 | 32.8Note * | 15.3 |
| Marital status | ||||||
| Married with children younger than 18 at home | 27.6Note * | 41.2 | 35.7Note * | 43.5 | 36.6Note * | 15.3 |
| Married without children younger than 18 at home | 30.0Note * | 51.1 | 40.1 | 35.4 | 30.0Note * | 13.5 |
| Divorced, separated or widowed | 29.8Note * | 57.5 | 38.8Note * | 29.7 | 31.4Note * | 12.8 |
| Never married | 12.3Note * | 30.7 | 46.0 | 46.2 | 41.6Note * | 23.1 |
| One-parent family | 16.5Note * | 37.3 | 34.6 | 42.4 | 49.0Note * | 20.3 |
| Age group | ||||||
| 15 to 24 years | 15.5Note * | 28.9Note E: Use with caution | 41.1 | 43.5Note E: Use with caution | 43.4Note * | 27.7 |
| 25 to 34 years | 22.1Note * | 33.3 | 41.5 | 47.6 | 36.4Note * | 19.1 |
| 35 to 54 years | 23.7Note * | 40.3 | 37.4Note * | 44.5 | 39.0Note * | 15.2 |
| 55 years or older | 31.1Note * | 58.2 | 41.2Note * | 30.0 | 27.7Note * | 11.8 |
| Years in neighbourhood | ||||||
| Less than three years | 22.6Note * | 41.4 | 41.9 | 42.0 | 35.5Note * | 16.6 |
| Three to less than five years | 28.7Note * | 45.6 | 33.0 | 41.2 | 38.4Note * | 13.2 |
| Five years or more | 26.0Note * | 46.3 | 40.1 | 37.3 | 33.9Note * | 16.4 |
| Homeownership status | ||||||
| Owner | 26.4Note * | 46.1 | 38.7 | 38.2 | 34.9Note * | 15.7 |
| Renter | 22.9Note * | 42.6 | 41.2 | 39.6 | 35.9Note * | 17.8 |
| Geographic area | ||||||
| Montréal | 23.6Note * | 53.4 | 31.3 | 35.0 | 45.1Note * | 11.6 |
| Toronto | 21.8Note * | 23.2 | 41.3 | 49.0 | 36.9 | 27.8 |
| Vancouver | 26.8 | 22.3 | 37.0 | 45.2 | 36.3 | 32.5 |
| Medium-sized CMAs | 25.5Note * | 35.3 | 38.0 | 45.5 | 36.4Note * | 19.3 |
| Small CMAs | 30.8Note * | 44.6 | 45.2 | 41.4 | 23.9Note * | 14.0 |
| Outside CMAs | 32.0Note * | 54.3 | 44.4Note * | 32.5 | 23.6Note * | 13.2 |
|
... not applicable x suppressed to meet the confidentiality requirements of the Statistics Act E use with caution
Source: Statistics Canada, General Social Survey, 2020. |
||||||
References
Amado, M. L. (2006). Mexican immigrants in the labour market: The strength of strong ties. New York: Scholarly Publishing.
Boyd, M., & Tian, S. (2016). Educational and labor market attainments of the 1.5 and second-generation children of East Asian immigrants in Canada. American Behavioral Scientist, 60(5-6), 705–729.
Cheng, S., & Xie, Y. (2013). Structural effect of size on interracial friendship. Proceedings of the National Academy of Sciences, 110(18), 7165–7169.
Couton, P., & Gaudet, S. (2008). Rethinking social participation: The case of immigrants in Canada. Journal of International Migration and Integration, 9(1), 21–44.
Drolet, J., & Moorthi, G. (2018). The settlement experiences of Syrian newcomers in Alberta: Social connections and interactions. Canadian Ethnic Studies, 50(2), 101–120.
Evra, R., & Kazemipur, A. (2019). The role of social capital and ethnocultural characteristics in the employment income of immigrants over time. Insights on Canadian Society. Statistics Canada Catalogue no. 75-006-X.
Gidengil, E., & Stolle, D. (2009). The role of social networks in immigrant women’s political incorporation. International Migration Review, 43(4), 727–763.
Goel, D., & Lang, K. (2019). Social ties and the job search of recent immigrants. ILR Review, 72(2), 355–381.
Granovetter, M. S. (1973). The strength of weak ties. American Journal of Sociology, 78(6), 1360–1380.
Gu, W. (2023). Accumulation of human capital in Canada, 1970 to 2020: An analysis by gender and the role of immigration. Analytical Studies Branch Research Paper Series. Statistics Canada Catalogue no. 11F0019M – No. 468.
Hagan, J. M. (1998). Social networks, gender, and immigration incorporation: Resources and constraints. American Sociological Review, 63(1), 55–67.
Hou, F., Schimmele, C., & Stick, M. (2023). Changing demographics of racialized people in Canada. Economic and Social Reports, 3(8), 1–16.
Hudon, T. (2015). Immigrant women. In Women in Canada: A gender-based statistical report. Seventh Edition. Statistics Canada Catalogue no. 89-503-X.
Lancee, B. (2012). The economic returns of bonding and bridging social capital for immigrant men in Germany. Ethnic and Racial Studies, 35(4), 664–683.
Li, Y. (2020). Civic engagement and well-being among female immigrants in Canada. Canadian Ethnic Studies, 52(1), 49–72.
Lin, N. (2001). Building a network theory of social capital. In N. Lin, K. Cook, & R. S. Burt (Eds.), Social capital (pp. 3-28). New York: Routledge.
Majerski, M. M. (2019). The earnings of immigrant and native-born men in Canada: The role of social networks and social capital. The Sociological Quarterly, 60(2), 314–336.
Martinović, B., van Tubergen, F., & Maas, I. (2011). Acquisition of cross-ethnic friends by recent immigrants in Canada: A longitudinal approach. International Migration Review, 45(2), 460–488.
Nakhaie, M. R., & Kazemipur, A. (2013). Social capital, employment and occupational status of the new immigrants in Canada. Journal of International Migration and Integration, 14(3), 419–437.
Ooka, E., & Wellman, B. (2006). Does social capital pay off more within or between ethnic groups? Analyzing job searchers in five Toronto ethnic groups. In E. Fong (Ed.), Inside the mosaic (pp. 199-228). Toronto: University of Toronto Press.
Park, J., & Myers, D. (2010). Intergenerational mobility in the post-1965 immigration era: Estimates by an immigrant generation cohort method. Demography, 47(2), 369–392.
Soltane, S. B. (2020). Social integration of immigrant women. In M. V. Desideri (Ed.), Canada-EU migration platform on the integration of immigrant women (pp. 29-41). Brussels: European Commission.
Stiglitz, J. E., Sen, A., & Fitoussi, J.-P. (2009). Report by the Commission on the Measurement of Economic Performance and Social Progress. Paris.
Turcotte, M. (2015). Trends in social capital in Canada. Statistics Canada Catalogue no. 89-652-X2015002.
Xue, L. (2008). Social capital and employment entry of recent immigrants to Canada. Ottawa: Citizenship and Immigration Canada.
Zhao, J., Xue, L., & Gilkinson, T. (2010). Health status and social capital of recent immigrants in Canada: Evidence from the Longitudinal Survey of Immigrants to Canada. In T. McDonald, E. Ruddick, A. Sweetman, & C. Worswick (Eds.), Canadian immigration: Economic evidence for a dynamic policy environment (pp. 311-340). Montréal and Kingston: McGill-Queen’s University Press.
- Date modified: