
Economic and Social Reports
The decline in the citizenship rate among recent immigrants to Canada: Update to 2021
DOI: https://doi.org/10.25318/36280001202400200002-eng
Text begins
Abstract
This article examines the trends in citizenship rates among recent immigrants who have been in Canada for five to nine years, based on census data from 1991 to 2021. The citizenship rate among recent immigrants has decreased significantly, dropping from 75.4% in 1996 to 45.7% in 2021, a decline of 29.7 percentage points. Almost half of this decline occurred from 2016 to 2021, with approximately 40% of the most recent decrease possibly related to COVID-19 pandemic restrictions. However, even after accounting for the pandemic effect, the citizenship rate declined at a faster rate from 2016 to 2021 than during any other five-year intercensal period since 1996. The decline in citizenship rates among recent immigrants from 1996 to 2021 was larger among those with lower levels of education, lower family income and lower official language skills. The decrease was also more substantial among recent immigrants from East Asia, Southeast Asia and West Asia than among their counterparts from the United States, Western Europe and Southern Europe. This article discusses possible explanations for these trends.
Keywords: immigrants, citizenship, naturalization, education, family income
Authors
Feng Hou is with the Social Analysis and Modelling Division, Analytical Studies and Modelling Branch, at Statistics Canada. Garnett Picot is with the Research and Data Branch at Immigration, Refugees and Citizenship Canada.
Acknowledgments
This study was conducted in collaboration with Immigration, Refugees and Citizenship Canada. The authors would like to thank Stephane Arabackyj, Christopher Hamilton, Catherine Tuey and analysts in the Citizenship Branch at Immigration, Refugees and Citizenship Canada for their advice and comments on an earlier version of this paper.
Introduction
Becoming a citizen by naturalization can bring benefits to both immigrants and receiving countries. For instance, obtaining citizenship grants immigrants the right to vote and allows them to have political influence. Additionally, it can enhance immigrants’ economic opportunities (Bratsberg, Ragan & Nasir, 2002; Gathmann & Monscheuer, 2020; Hayfron, 2008). Acquiring citizenship is also an indication of immigrants’ commitment to the receiving country and their willingness to adhere to the values and laws of their adopted society (Bloemraad, Korteweg & Yurdakul, 2008).
Over the past two decades, there have been significant changes in both the constraints and motivations for immigrants to acquire citizenship in Canada. Various policy and program changes may have affected naturalization (Parliament of Canada, 2014; 2017). From 2006 to 2016, the “knowledge of Canada” test was strengthened, language requirements increased, citizenship application fees rose and the physical presence requirements to be eligible for citizenship were changed from three of four years preceding application to four of six years. Some of these could have reduced the tendency for eligible immigrants to become citizens (Hou & Picot, 2021). In 2017, some of these changes were reversed. The residency requirement was restored to three of five years, and the upper age limit to meet the language and knowledge requirements was moved from 64 back to 54. The citizenship fee for minors was reduced in 2018. Other more global events also likely play a role. For example, significant economic development in some source countries, such as China and India, could encourage immigrants from these regions to maintain their source-country passports and reduce their motivation to become Canadian citizens.
This paper examines trends in citizenship acquisition in Canada from 1991 to 2021, updating an earlier paper by Hou and Picot (2019). The focus is on the citizenship (or naturalization) rate—the proportion of immigrants who acquire Canadian citizenship after they meet the residency requirement for citizenship. To assess recent trends, the results for immigrants in Canada for five to nine years at any given census are produced.
The earlier research found that the citizenship rate among recent immigrants declined significantly from 2001 to 2016 (Hou & Picot, 2019). This paper updates that analysis and assesses whether the downward trend continued, levelled off or was reversed by 2021. The earlier research also found that the decline was more significant among immigrant groups with lower family income levels, lower levels of education and poorer official language skills. This paper updates those subgroup analyses. The conclusion includes a discussion of possible causes for the decline.
Data and methods
This study uses data from the 1991, 1996, 2001, 2006, 2016 and 2021 long-form census questionnaires and the 2011 National Household Survey. The study sample is limited to landed immigrants aged 18 and older in a given census year. The data from the six censuses are used to compute citizenship rates among immigrants who recently met the residency requirements for citizenship during the five-year period prior to any given census. To do this, the analysis focuses on adult immigrants who arrived in Canada five to nine years before each census.Note Until 2015, immigrants were required to reside in Canada for at least three years before they could become citizens during their fourth year of residence, at the earliest.Note From 2015 to 2017, this residency requirement was increased to four years, and immigrants could become citizens only during their fifth year living in Canada, at the earliest. In 2017, the residency requirement was returned to three of five years. To keep the study populations consistent across censuses, the lower sample limit is defined as immigrants who have lived in Canada for at least five years. The upper sample limit is defined as immigrants who have lived in Canada for at least nine years. They would have been eligible for citizenship during the five-year intercensal period prior to any given census.
Focusing on immigrants who arrived in Canada five to nine years earlier (hereafter referred to as new or recent immigrants) provides a good indication of emerging trends. Most immigrants who become citizens do so by the time they have been in Canada for 9 years; relatively few immigrants become citizens after 10 or more years in Canada. For example, among immigrants who arrived in 1991 and remained in Canada, 82.6% became citizens by the 10th year after immigration.Note Only an additional 6.0% became citizens 15 years after immigration (Table 1). Similar results were observed for the latest cohort that data are available for. Among immigrants who arrived in 2006, 76.4% were Canadian citizens 10 years later, and an additional 6.2% became citizens 15 years after entry.
| Landing year | Years since landing | ||
|---|---|---|---|
| 5 | 10 | 15 | |
| percent | |||
| 1986 | 58.3 | 79.5 | 85.3 |
| 1991 | 68.1 | 82.6 | 88.6 |
| 1996 | 65.2 | 85.6 | 90.9 |
| 2001 | 56.7 | 84.5 | 88.8 |
| 2006 | 44.4 | 76.4 | 82.6 |
| 2011 | 43.0 | 69.0 | Note ..: not available for a specific reference period |
| 2016 | 21.7 | Note ..: not available for a specific reference period | Note ..: not available for a specific reference period |
|
.. not available for a specific reference period Sources: Statistics Canada, 1991, 1996, 2001, 2006, 2016 and 2021 censuses of population, and 2011 National Household Survey. |
|||
Naturalization among immigrants is based on the question, “Of what country is this person a citizen?”, which appears in every census before the 2021 Census. The census questionnaire provides two answer options, “Canada, by birth” and “Canada, by naturalization,” as well as a write-in box: “Other country—specify.” The 2021 Census asks two questions: “Is this person a Canadian citizen?”Note and “Is this person a citizen of a country other than Canada?”Note The census questionnaire also explains that naturalization “refers to the process by which an immigrant is granted citizenship of Canada, under the Citizenship Act.” The citizenship rate is calculated as the percentage of immigrants who reported having Canadian citizenship by naturalization.
Results
The overall citizenship rate
Census data indicate that the overall citizenship rate—the share of all immigrants who met the residency requirements for citizenship and became Canadian citizens—rose slowly from 1991 to 2016, then declined for the first time in 2021. This trend holds for both adult immigrants aged 18 or older and all immigrants (Chart 1). For example, the citizenship rate among adult immigrants rose from 81.6% in 1991 to 86.3% in 2016, then declined to 81.7% in 2021. Despite the recent decline, Canada still has one of the highest immigrant citizenship rates in the Western world.Note
However, these numbers do not fully reflect recent trends in citizenship take-up among immigrants. They include all eligible adult immigrants, no matter how long they have been in Canada. Many would have become citizens 20 or even 30 years prior to any given census, and their decisions would have been affected by factors that existed at that time. A more significant decline was observed among recent immigrants who arrived in Canada five to nine years before each census (therefore, recently meeting residency eligibility requirements). Their citizenship rate peaked at 75.4% in 1996 and declined to 45.7% by 2021 (Chart 1), falling by 29.7 percentage points over 25 years. Almost half (14.7 percentage points) of this overall decline occurred from 2016 to 2021.

Data table for Chart 1
| 1991 | 1996 | 2001 | 2006 | 2011 | 2016 | 2021 | |
|---|---|---|---|---|---|---|---|
| percent | |||||||
| All immigrants | 81.1 | 83.2 | 84.0 | 85.1 | 85.7 | 85.8 | 80.7 |
| Adult immigrants aged 18 or older | 81.6 | 83.7 | 84.5 | 85.7 | 86.3 | 86.2 | 81.7 |
| Adult immigrants who arrived five to nine years earlier | 68.6 | 75.4 | 75.1 | 73.0 | 67.5 | 60.4 | 45.7 |
|
Note: The minimum residency requirements were three years from the time of the 1991 Census to the time of the 2011 National Household Survey, four years at the time of the 2016 Census and three years at the time of the 2021 Census. Sources: Statistics Canada, 1991, 1996, 2001, 2006, 2016 and 2021 censuses of population, and 2011 National Household Survey. |
|||||||
The possible effect of the COVID-19 pandemic on the decline in citizenship rate among recent immigrants from 2016 to 2021
Some of the decline from 2016 to 2021 in the citizenship rate among recent immigrants was likely caused by work interruptions related to the COVID-19 pandemic. Processing and other issues slowed the approval of citizenship applications during the pandemic. For example, Immigration, Refugees and Citizenship Canada (2022) reported that, “Due to interruptions in processing at the beginning of the pandemic, the grant inventory has grown from around 211,000 pre-pandemic to 459,000 as of January 31, 2022. Processing times have increased from 15 months pre-pandemic to 26 months.” These processing issues, and a lower number of ceremonies to prevent the spread of COVID-19, significantly reduced the number of naturalized citizens leading up to the 2021 Census. The number of newly naturalized citizens was 249,000 in 2019, then, during the pandemic, 110,000 in 2020 and 138,000 in 2021. It is unlikely that this large and rapid fall represented a decline in the number of permanent residents wishing to become citizens. In 2022, as restrictions related to COVID-19 were eased, the number of naturalized citizens increased to 374,000 (IRCC, nd). However, the census was conducted in May 2021 and would not have captured this catch-up.
The Longitudinal Immigration Database (IMDB), which contains information to estimate citizenship rates for recent immigrants from 2011 to 2020, can be used to indirectly assess the possible effect of the pandemic on the citizenship rate. In overlapping years, the trends observed in the IMDB and the census are similar, thus allowing comparisons between the two datasets.Note
In the IMDB, which has annual data, the citizenship rate among recent adult immigrants declined by 5.9 percentage points from 2016 to 2019—the last year before COVID-19—on average about a 2 percentage point decrease per year. If the same pace of decrease had continued, assuming no interruptions related to COVID-19, the citizenship rate would have declined an additional 3 percentage points by mid-2021, when the census was completed. This suggests a total decline from 2016 to 2021 of around 9 percentage points, without restrictions related to COVID-19, rather than the observed 14.7 percentage points. Perhaps 40%Note of the decline observed in the census from 2016 to 2021 was associated with interruptions related to the pandemic. This is a very rough estimate, and some possibility of error is acknowledged.
However, the estimated 9 percentage point drop in the citizenship rate among recent immigrants, without restrictions related to COVID-19, from 2016 to 2021, was still greater than that observed during any five-year intercensal period since 1996.
The decline among recent immigrants with different characteristics
The fall in the citizenship rate from 1996 to 2021 varied considerably by family income, educational attainment, source region and language ability.
Differences by family income
Chart 2 shows the trend in citizenship rates by family income. Here, family income is adult-equivalent adjusted (AEA) to account for differences in family size and the economies of scale associated with larger families. Actual family income is almost always higher than AEA income.Note
In 1996, recent immigrants with high AEA family incomes (over $100,000) tended to have lower citizenship take-up than those with lower family income levels. However, since then, the citizenship rate has fallen more rapidly among lower-income individuals. From 1996 to 2021, the rate fell 13.5 percentage points among recent immigrants with AEA family incomes over $100,000, compared with 35.9 percentage points among those with income of over $10,000 to $30,000 (Table 2). As a result, by 2021, high-income families were 1.4 times more likely to become citizens than lower-income families in the over-$10,000-to-$30,000 bracket.

Data table for Chart 2
| Adult equivalent adjusted family income | 1996 | 2001 | 2006 | 2011 | 2016 | 2021 |
|---|---|---|---|---|---|---|
| percent | ||||||
| $10,000 or less | 75.0 | 73.1 | 69.9 | 61.2 | 51.5 | 35.8 |
| Over $10,000 to $30,000 | 75.1 | 75.1 | 71.1 | 64.3 | 56.0 | 39.3 |
| Over $30,000 to $50,000 | 75.7 | 74.2 | 72.5 | 68.3 | 61.0 | 43.7 |
| Over $50,000 to $100,000 | 76.7 | 77.2 | 77.4 | 71.2 | 65.7 | 49.0 |
| Over $100,000 | 69.7 | 75.3 | 74.0 | 71.5 | 66.7 | 56.2 |
| Sources: Statistics Canada, 1996, 2001, 2006, 2016 and 2021 censuses of population, and 2011 National Household Survey. | ||||||
| 1991 | 1996 | 2001 | 2006 | 2011 | 2016 | 2021 | 1996-to-2021 change | |
|---|---|---|---|---|---|---|---|---|
| percent | percentage points | |||||||
| Total | 68.6 | 75.4 | 75.1 | 73.0 | 67.5 | 60.4 | 45.7 | -29.7 |
| Adult-equivalent family income (in 2015 constant dollars) | ||||||||
| $10,000 or less | 65.8 | 75.0 | 73.1 | 69.9 | 61.2 | 51.5 | 35.8 | -39.2 |
| Over $10,000 to $30,000 | 68.2 | 75.1 | 75.1 | 71.1 | 64.3 | 56.0 | 39.3 | -35.9 |
| Over $30,000 to $50,000 | 69.2 | 75.7 | 74.2 | 72.5 | 68.3 | 61.0 | 43.7 | -32.0 |
| Over $50,000 to $100,000 | 69.6 | 76.7 | 77.2 | 77.4 | 71.2 | 65.7 | 49.0 | -27.7 |
| Over $100,000 | 66.2 | 69.7 | 75.3 | 74.0 | 71.5 | 66.7 | 56.2 | -13.5 |
| Language | ||||||||
| Neither English nor French | 61.5 | 62.1 | 68.3 | 56.7 | 45.6 | 32.6 | 19.7 | -42.4 |
| Other mother tongue, speaks English or French | 74.0 | 79.7 | 78.9 | 76.2 | 70.5 | 63.4 | 47.3 | -32.4 |
| English or French mother tongue | 60.2 | 69.2 | 65.0 | 66.2 | 64.9 | 61.0 | 49.8 | -19.4 |
| Education | ||||||||
| Less than high school | 64.7 | 69.4 | 71.4 | 63.4 | 59.8 | 46.9 | 30.4 | -39.0 |
| High school graduate | 68.7 | 75.7 | 74.5 | 70.8 | 65.4 | 55.4 | 40.7 | -34.9 |
| Some postsecondary | 72.1 | 78.9 | 75.9 | 73.8 | 67.3 | 60.8 | 46.1 | -32.8 |
| University degree | 73.8 | 80.9 | 79.3 | 77.0 | 70.8 | 67.1 | 51.8 | -29.1 |
| Socioeconomic status | ||||||||
| Low income, high school or less education, mother tongue neither English nor French | 69.2 | 73.9 | 75.0 | 69.1 | 63.3 | 51.4 | 35.1 | -38.8 |
| High income, postsecondary education, English or French mother tongue | 60.5 | 68.0 | 65.3 | 68.0 | 66.4 | 64.8 | 54.9 | -13.2 |
| Immigrants not included in above groups | 68.9 | 77.1 | 75.8 | 75.0 | 69.0 | 63.4 | 47.2 | -29.9 |
| Source region | ||||||||
| United States | 31.0 | 38.4 | 41.7 | 41.8 | 44.9 | 40.5 | 31.0 | -7.3 |
| Central America | 66.4 | 77.1 | 74.2 | 72.1 | 67.5 | 59.0 | 48.9 | -28.2 |
| Caribbean | 64.7 | 72.2 | 64.1 | 66.5 | 67.7 | 58.2 | 47.3 | -24.9 |
| South America | 71.6 | 73.8 | 68.5 | 70.0 | 73.8 | 72.5 | 55.8 | -18.0 |
| Northern Europe | 54.4 | 53.9 | 45.0 | 49.2 | 48.1 | 45.2 | 34.6 | -19.3 |
| Western Europe | 50.2 | 52.9 | 52.4 | 53.5 | 47.9 | 47.9 | 45.9 | -7.0 |
| Southern Europe | 53.8 | 52.8 | 81.4 | 83.5 | 78.7 | 62.1 | 47.6 | -5.1 |
| Eastern Europe | 84.6 | 84.3 | 83.6 | 84.2 | 78.6 | 71.7 | 55.4 | -28.9 |
| Africa | 78.3 | 86.2 | 83.0 | 76.8 | 77.2 | 73.8 | 61.2 | -25.0 |
| South Asia | 55.7 | 66.0 | 68.0 | 68.5 | 67.2 | 59.8 | 44.9 | -21.2 |
| Southeast Asia | 79.2 | 81.9 | 79.0 | 74.8 | 70.3 | 61.3 | 41.2 | -40.7 |
| East Asia | 80.4 | 82.9 | 80.9 | 73.7 | 57.0 | 44.8 | 24.9 | -58.0 |
| West Asia | 79.7 | 86.6 | 84.1 | 82.1 | 74.6 | 69.7 | 57.3 | -29.3 |
| Oceania and other | 56.9 | 53.9 | 50.1 | 55.7 | 60.7 | 49.0 | 39.1 | -14.8 |
| number | ||||||||
| Sample size | 64,787 | 123,636 | 137,708 | 138,024 | 163,270 | 214,067 | 236,878 | Note ...: not applicable |
|
... not applicable Sources: Statistics Canada, 1991, 1996, 2001, 2006, 2016 and 2021 censuses of population, and 2011 National Household Survey. |
||||||||
Differences by educational level
From 1996 to 2021, the citizenship rate declined among all education groups, but more rapidly among recent immigrants with less education. Among those with a high school education or less, the rate fell by 39 percentage points to 30.4% in 2021. Among those with a university degree (bachelor’s degree or higher), the decline was 29 percentage points, from 80.9% to 51.8% (Chart 3).

Data table for Chart 3
| Education | 1996 | 2001 | 2006 | 2011 | 2016 | 2021 |
|---|---|---|---|---|---|---|
| percent | ||||||
| Less than high school | 69.4 | 71.4 | 63.4 | 59.8 | 46.9 | 30.4 |
| High school graduate | 75.7 | 74.5 | 70.8 | 65.4 | 55.4 | 40.7 |
| Some postsecondary | 78.9 | 75.9 | 73.8 | 67.3 | 60.8 | 46.1 |
| University degree | 80.9 | 79.3 | 77.0 | 70.8 | 67.1 | 51.8 |
| Sources: Statistics Canada, 1996, 2001, 2006, 2016 and 2021 censuses of population, and 2011 National Household Survey. | ||||||
Differences by source region
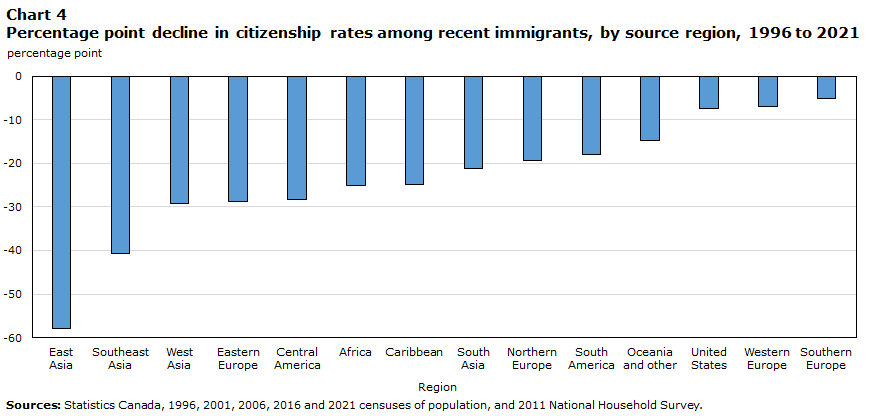
Traditionally, recent immigrants from Western countries such as the United States, Europe, Australia and New Zealand had a much lower citizenship take-up rate than immigrants from Asia, Africa and Central and South America (Picot & Hou, 2011). For example, in 1996, recent immigrants from Western countries mentioned above had citizenship rates from 30% to 55%; those from the non-Western regions had rates from 65% to 80% (Table 2). Compared with their home country, the benefits of a Canadian citizenship and passport were much greater for many immigrants from non-Western nations than for their counterparts from regions such as the United States and Europe. However, following 1996, the decline was much greater among eligible recent immigrants from some non-Western regions, notably East Asia (mostly China) and Southeast Asia, than among those from the United States and Europe (Chart 4 and Table 2). Recently, immigrants from some non-Western nations more closely resembled those from developed nations in their tendency to acquire Canadian citizenship. In 2021, recent immigrants from East Asia had the lowest citizenship rate, at 25%, and those from Southeast Asia and South Asia had rates from 41% to 45%. This may be related to the increasing economic and international status of these regions, which may reduce the economic motivation of recent immigrants from these regions to acquire Canadian citizenship.
Data table for Chart 4
| Region | Decline between 1996 and 2021 |
|---|---|
| percentage point | |
| East Asia | -58.0 |
| Southeast Asia | -40.7 |
| West Asia | -29.3 |
| Eastern Europe | -28.9 |
| Central America | -28.2 |
| Africa | -25.0 |
| Caribbean | -24.9 |
| South Asia | -21.2 |
| Northern Europe | -19.3 |
| South America | -18.0 |
| Oceania and other | -14.8 |
| United States | -7.3 |
| Western Europe | -7.0 |
| Southern Europe | -5.1 |
| Sources: Statistics Canada, 1996, 2001, 2006, 2016 and 2021 censuses of population, and 2011 National Household Survey. | |
Differences by language spoken at landing
The citizenship rate decline was observed among all three language groups in Chart 5 but was particularly evident among those not speaking English or French at landing. This group of recent immigrants registered a 42 percentage point decline in the citizenship rate; one in five were citizens in 2021. The increased language requirements for citizenship may have played a role in this decline. Recent immigrants who spoke English or French at landing, but whose mother tongue was not an official language, registered a 32 percentage point decline in the citizenship rate. Conversely, those who had English or French as their mother tongue saw their citizenship rate decline by 19 percentage points from 1996 to 2021.

Data table for Chart 5
| 1996 | 2001 | 2006 | 2011 | 2016 | 2021 | |
|---|---|---|---|---|---|---|
| percent | ||||||
| Neither English nor French | 62.1 | 68.3 | 56.7 | 45.6 | 32.6 | 19.7 |
| Other mother tongue, speaks English or French | 79.7 | 78.9 | 76.2 | 70.5 | 63.4 | 47.3 |
| English or French mother tongue | 69.2 | 65.0 | 66.2 | 64.9 | 61.0 | 49.8 |
| Sources: Statistics Canada, 1996, 2001, 2006, 2016 and 2021 censuses of population, and 2011 National Household Survey. | ||||||
Changes in the citizenship rate for disadvantaged and more advantaged immigrant groups
The above analysis looks at changes in the citizenship rate among groups defined by one factor at a time. But many immigrants may have multiple characteristics associated with a low and more rapidly declining citizenship rate. Among immigrants with relatively low income, poor or non-existent English or French language skills and a low level of education, the decline in citizenship rate may have been accentuated. Conversely, among immigrants with very high income, good language skills and a high level of education, the tendency to become naturalized may have changed little.
To examine these possible patterns, three groups of recent immigrants were constructed. The disadvantaged group includes immigrants with an AEA family income of under $50,000, whose mother tongue was neither English nor French and who had a high school education or less. The advantaged group consists of immigrants with an AEA income of over $100,000, English or French as their mother tongue and a postsecondary education. The third (intermediate) group consists of all other immigrants who were not in the most disadvantaged and advantaged groups.
The results indicate that the citizenship rate dropped 39 percentage points from 1996 to 2021 for the disadvantaged group, 30 percentage points for the intermediate group and 13 percentage points for the advantaged group (Chart 6). Before 2006, the disadvantaged group was more likely to acquire Canadian citizenship. But the pattern was reversed after 2006, and, in 2021, the citizenship rate was 1.5 times higher among the advantaged group than among the disadvantaged. Among the disadvantaged group, three-quarters of recent immigrants became citizens in 1996, falling to 35% in 2021.

Data table for Chart 6
| Socioeconomic status | 1996 | 2001 | 2006 | 2011 | 2016 | 2021 |
|---|---|---|---|---|---|---|
| percent | ||||||
| Low income, high school or less education, mother tongue neither English nor French | 73.9 | 75.0 | 69.1 | 63.3 | 51.4 | 35.1 |
| High income, postsecondary education, English or French mother tongue | 68.0 | 65.3 | 68.0 | 66.4 | 64.8 | 54.9 |
| Sources: Statistics Canada, 1996, 2001, 2006, 2016 and 2021 censuses of population, and 2011 National Household Survey. | ||||||
Conclusion
This paper examines the citizenship rate trends among recent immigrants—those in Canada for five to nine years at any given census—from 1991 to 2021. The citizenship rate is the proportion of immigrants who acquire Canadian citizenship after they meet the residency requirement.
The citizenship rate among recent immigrants has been in decline since 1996, at first decreasing slowly until 2006, then more rapidly until 2021. The citizenship rate among recent immigrants fell from 75.4% in 1996 to 45.7% in 2021. Almost half of this decline occurred from 2016 to 2021, with approximately 40% of the most recent decrease possibly related to COVID-19 pandemic restrictions. Processing and ceremony issues slowed the approval of citizenship requests during the pandemic. However, even after accounting for such possibilities, the citizenship rate declined faster from 2016 to 2021 than during any other five-year period since 1996.
The decline in the citizenship rate among recent immigrants was larger among those with lower education levels, lower family income and poorer English or French language skills. Also, trends varied across source regions. Traditionally, immigrants from non-Western countries displayed a higher citizenship take-up rate than those from Western countries. This may be partly because, compared with their home country, the benefits of a Canadian citizenship and passport were much greater for immigrants from non-Western nations than for their counterparts from regions such as the United States and Europe. However, since 1996, the citizenship rate has declined more rapidly among eligible recent immigrants from some non-Western regions, notably East Asia (mostly China) and Southeast Asia. In 2021, recent immigrants from East Asia had the lowest citizenship rate, at 25%.
Assessing why the citizenship rate of recent immigrants has declined since 1996 is beyond the scope of this paper. At this point, the reasons are not well known. A research paper assessed some possibilities that were discussed in the literature (Hou & Picot, 2021). The paper noted that, from 2006 to 2016, a number of changes in government citizenship policy were enacted, including strengthening the “knowledge of Canada” requirement, requiring evidence of French or English language skills, increasing citizenship application fees, increasing the residency requirements and requiring immigrants to declare their intent to reside in Canada. The authors acknowledged that directly estimating the exact effect of these specific policy changes on the naturalization rate is difficult. Instead, they asked whether changes in the citizenship rate among specific immigrant groups defined by education, language skills and family income were consistent with the possible effects of various policy changes. They concluded that government policy changes introduced during the period from 2006 to 2016 were associated with the decline in the citizenship rate following 2006, and particularly since 2011. However, no single policy change was seen as the sole or primary explanation. Furthermore, government policy changes were not the only factors affecting the decline; other forces were at play because the decline was underway prior to 2006, when policy changes were first initiated. The authors concluded that events occurring internationally, such as rising economic success and nationalism in some source countries, also likely contributed to the decline.
In 2017, some of the policy changes were reversed. The residency requirement was restored to three of five years, and the upper age limit of individuals required to meet the language and knowledge requirements was moved from 64 back to 54. The citizenship fee for minors was reduced in 2018. Certainly not all the possible policy effects were reversed, including changes to citizenship fees for adults.Note However, despite the changes that were made, the citizenship rate of recent immigrants declined at an ever-increasing rate from 2016 to 2021. As noted by Hou and Picot (2021), this suggests that there are other factors, in addition to changes in government citizenship policies, that affected the citizenship rate. The very rapid decline in citizenship rate among recent immigrants from East Asia suggests that international events may be playing a significant role.
References
Bloemraad, I., Korteweg, A., & Yurdakul, G. (2008). Citizenship and immigration: Multiculturalism, assimilation, and the challenges to the nation-state. Annual Review of Sociology, 34(1), 153–179.
Bratsberg, B., Ragan, J.F., & Nasir, Z.M. (2002). The effect of naturalization on wage growth: A panel study of young male immigrants. Journal of Labor Economics, 20 (3), 568–597.
Chesoi, M. & Kachulis, E. (2020). Canadian Citizenship: Practice and Policy. Library of Parliament. Publication No 2020-64-E. Accessed May 1, 2023.
Gathmann, C., & Monscheuer, O. (2020). Naturalization and citizenship: Who benefits? IZA World of Labor, 125.
Hayfron, J.E. (2008). The economics of Norwegian citizenship. In The Economics of Citizenship, ed. P. Bevelander and D.J. DeVoretz, p. 89–104. Malmo: Malmo University.
Hou. F., & Picot, G. (2019). Trends in the Citizenship Rate Among New Immigrants to Canada Statistics Canada, Economic Insights, no 101.
Hou. F., & Picot, G. (2021). The decline in the naturalization rate among recent immigrants in Canada: effects of policy changes vs. structural factors? Migration Studies, 9(3), 1030-1053.
IRCC (Immigration, Refugees and Citizenship Canada). (2022). CIMM – Citizenship and Passport – March 3, 2022. Accessed May 1, 2023.
IRCC (Immigration, Refugees and Citizenship Canada). (nd). Operational Processing – Monthly IRCC Updates - Source Countries (Country of Birth) - New Canadian Citizens (in Persons) by Month. Accessed February 26, 2023
OCED (Organisation for Economic Co-operation and Development). (2023) Indicators of Immigrant Integration 2023: Settling In, OECD Publishing, Paris.
Parliament of Canada. (2014). Statutes of Canada 2014, Chapter 22, Bill C-24. Accessed September 16, 2023.
Parliament of Canada. (2017). Statutes of Canada 2017, Chapter 14, Bill C-6. Accessed September 16, 2023.
Picot, G., & Hou, F. (2011). Citizenship Acquisition in Canada and the United States: Determinants and Economic Benefit. In Naturalisation: A Passport for the Better Integration of Immigrants? Chapter 6, pp 154-181. Paris: OECD Publishing.
Tuey, C., & Maheux, H. (2022). A portrait of citizenship in Canada from the 2021 Census, Statistics Canada.
- Date modified: