
Economic Insights
Trends in the Citizenship Rate Among New Immigrants to Canada

Archived Content
Information identified as archived is provided for reference, research or recordkeeping purposes. It is not subject to the Government of Canada Web Standards and has not been altered or updated since it was archived. Please "contact us" to request a format other than those available.
Garnett Picot, Research and Evaluation Branch, Immigration, Refugees and Citizenship Canada and the Institute for Research on Public Policy
This Economic Insights article examines trends in the citizenship rate (the percent of immigrants who become Canadian citizens) among recent immigrants who arrived in Canada five to nine years before a given census. The citizenship rate among recent immigrants aged 18 and over peaked in 1996 and declined continuously to 2016. Most of this decline occurred after 2006. The citizenship rate declined most among immigrants with low family income, poor official language skills, and lower levels of education. There was also significant variation in the decline among immigrants from different source regions, with the decline largest among Chinese immigrants.
Introduction
Acquiring the citizenship of the receiving country can benefit both immigrants and receiving countries in many ways. For example, becoming a citizen gives immigrants the right to vote and enables them to exert political influence, and it may improve immigrants’ economic opportunities (Bratsberg, Ragan and Nasir 2002; Hayfron 2008).
Canada has one of the highest citizenship rates (the percentage of immigrants who become citizens) among major Western countries (Picot and Hou 2011). However, evidence indicates that the rate has been falling among recent immigrants to Canada. This paper assesses the extent of this downward trend, when it occurred, and how it varies across different immigrant groups.
Data and methods
This study uses data from the 1991, 1996, 2001, 2006 and 2016 long-form censuses and the 2011 National Household Survey. The study sample is limited to legal immigrants aged 18 and older in a given census year. The data from the five censuses are used to compute citizenship rates among immigrants who recently met the residency requirements for citizenship during the five-year period prior to any given census. To do this, the analysis focuses on adult immigrants who arrived in Canada five to nine years before each census. Until 2015, immigrants were required to reside in Canada for at least three years before they could become citizens; at the earliest, they could do so only during their fourth year of residence.Note After 2015, this residency requirement increased to four years, and immigrants could become citizens only during their fifth year living in Canada, at the earliest. To keep the populations consistent across censuses, the sample for this study is limited to immigrants who had lived in Canada for five to nine years, and hence were eligible for citizenship during the five-year intercensal period prior to any given census.
By focusing on immigrants in Canada for 5 to 9 years (hereafter referred to as new or recent immigrants), the analysis excludes any change in the tendency of immigrants living in Canada for more than 10 years to become Canadian citizens. For more recent periods, this trend can only be known when more data from future censuses are available. Furthermore, examining citizenship take-up among more recent immigrants provides a better reading of emerging behaviours and trends.
Citizenship among immigrants is based on the question “Of what country is this person a citizen?” (Statistics Canada n.d., p. 10) which appears in every census. The questionnaire provides two answer options, “Canada, by birth” and “Canada, by naturalization,” as well as a write-in box: “Other country—specify.” The questionnaire also explains that “‘Canada, by naturalization’ refers to the process by which an immigrant is granted citizenship of Canada, under the Citizenship Act.” The citizenship rate is calculated as the percentage of immigrants in any particular immigrant group who reported having Canadian citizenship by naturalization.
Recent trends
The citizenship rate for immigrants aged 18 and older who met the citizenship residency requirements rose from 81.6% in 1991 to around 86.2% in 2016 (Chart 1). However, these figures include all adult immigrants who met the residency requirements, regardless of how long they had lived in Canada. Many had become citizens 10, 20 or even 30 years earlier, obscuring trends up among more recent arrivals. To highlight the latter, citizenship rates in Table 1 are disaggregated by years since immigration. These data show that from 1991 to 2016 the overall increase in citizenship was driven by the increase among immigrants who had been in Canada for 10 years or more. Among immigrants who had lived in Canada for 21 to 30 years, for example, the citizenship rate rose almost continuously, from 81.5% in 1991 to 92.6% in 2016. In contrast, the citizenship rate among more recent immigrants declined. Among those in Canada for five years, for example, the rate fell continuously from 68.1% in 1996 to 43.0% in 2016. Among immigrants in Canada for nine years, the rate fell from 84.1% in 2006 to 73.4% in 2016.
| 1991 | 1996 | 2001 | 2006 | 2011 | 2016 | |
|---|---|---|---|---|---|---|
| percent | ||||||
| Years since immigration | ||||||
| 4 | 43.2 | 48.5 | 46.7 | 32.8 | 22.7 | Note ...: not applicable |
| 5 | 58.3 | 68.1 | 65.2 | 56.7 | 44.4 | 43.0 |
| 6 | 67.9 | 75.2 | 73.1 | 70.2 | 62.3 | 55.4 |
| 7 | 71.3 | 77.7 | 76.5 | 78.3 | 73.4 | 62.7 |
| 8 | 73.1 | 78.5 | 78.2 | 81.6 | 78.2 | 69.0 |
| 9 | 73.3 | 79.5 | 81.6 | 84.1 | 82.7 | 73.4 |
| 10 | 74.1 | 79.5 | 82.6 | 85.6 | 84.5 | 76.4 |
| 11 | 77.4 | 81.6 | 84.5 | 86.5 | 87.4 | 80.8 |
| 12 | 77.7 | 83.7 | 84.8 | 87.7 | 88.4 | 83.8 |
| 13 | 77.6 | 83.1 | 85.2 | 87.4 | 89.8 | 85.8 |
| 14 | 77.9 | 83.2 | 85.3 | 88.6 | 91.2 | 87.8 |
| 15 | 78.0 | 82.6 | 85.3 | 88.6 | 90.9 | 88.8 |
| 16 to 20 | 78.4 | 84.3 | 86.6 | 89.5 | 92.0 | 91.3 |
| 21 to 30 | 81.5 | 84.5 | 86.6 | 89.4 | 92.3 | 92.6 |
| More than 30 | 91.6 | 91.8 | 90.3 | 91.0 | 92.8 | 91.9 |
| Total | 81.6 | 83.7 | 84.5 | 85.7 | 86.3 | 86.2 |
|
... not applicable (did not meet residency requirements) Sources: Statistics Canada, 1991, 1996, 2001, 2006 and 2016 censuses of population, and 2011 National Household Survey. |
||||||

Data table for Chart 1
| 1991 | 1996 | 2001 | 2006 | 2011 | 2016 | |
|---|---|---|---|---|---|---|
| percent | ||||||
| All immigrants | 81.1 | 83.2 | 84.0 | 85.1 | 85.7 | 85.8 |
| Adult immigrants | 81.6 | 83.7 | 84.5 | 85.7 | 86.3 | 86.2 |
| Adult immigrants who arrived five to nine years ago | 68.6 | 75.4 | 75.1 | 73.0 | 67.5 | 60.4 |
|
Note: The minimum residency requirement was three years from the time of the 1991 Census up until the time of the 2011 National Household Survey, but four years at the time of the 2016 Census. Adult immigrants are individuals aged 18 and older. Sources: Statistics Canada, 1991, 1996, 2001, 2006 and 2016 censuses of population, and 2011 National Household Survey. |
||||||
Overall, the citizenship rate among immigrants in Canada for 5 to 9 years—the focus of this analysis declined from its high point of 75.4% in 1996 to its low point of 60.4% in 2016 (Chart 1 and Table 2). Much of this decline occurred in more recent intercensal years—by 7.1 percentage points between 2011 and 2016 and by 5.5 percentage points from 2006 to 2011. Declines from 1996 to 2001 and from 2001 to 2006 were much smaller.Note
These are overall statistics, but the trends may vary among different immigrant groups. To determine whether this is the case, the analysis focuses on the change in the citizenship rate among groups defined by family income, official language ability, education, and source country or region.
Changes in the citizenship rate by family income
At its high point in 1996, the citizenship rate among recent immigrants did not vary much across family income, with the exception of those in the very top income group (Table 2). However, by 2016 recent immigrants in lower income families were much less likely than their counterparts in higher income families to be citizens (Chart 2). Note that family income in Table 2 and Chart 2 is adult-equivalent adjusted (AEA) family income, which adjusts for both family size and economies of scale associated with larger families.Note
Between 1996 and 2016, the tendency of recent immigrants to become naturalized fell for those in all income groups, but much more so for those in lower income families. Among recent immigrants in families with an AEA family income of $10,000 or less (i.e., an unadjusted family income of $20,000 for a family of four with two young children), the citizenship rate fell 23.5 percentage points between 1996 and 2016 (Table 2). The decline was far smaller among immigrants in higher income families, declining by only 3.0 percentage points among those with an AEA family income of over $100,000.
This gap across family income categories widened most in more recent years. The difference in citizenship rates between recent immigrants in the lowest family income category ($10,000 or less AEA) and the highest family income category (over $100,000 AEA) was 5.3 percentage points in 1996. It was negligible (and reversed) in 2001, and only slightly higher, at 4.1 percentage points, in 2006. But by 2011 the citizenship rate among recent immigrants in the lowest family income categories was 10.3 percentage points lower than it was among those in the highest family income category. By 2016 this difference had widened to 15.2 percentage points.
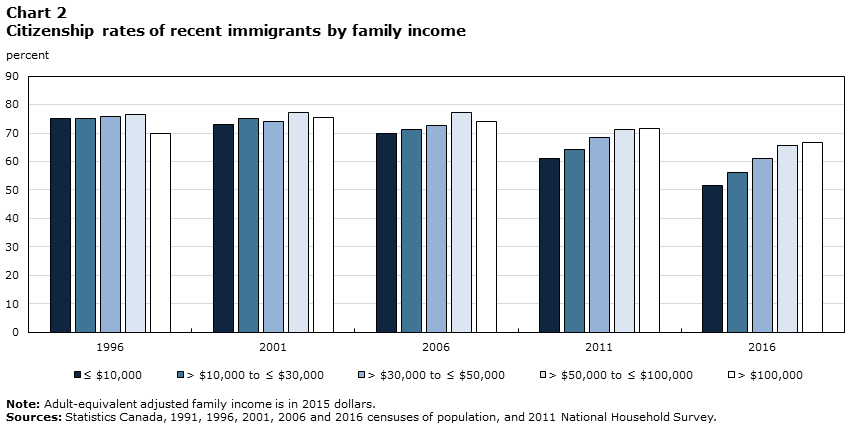
Data table for Chart 2
| Adult-equivalent adjusted family income (2015 dollars) | 1996 | 2001 | 2006 | 2011 | 2016 |
|---|---|---|---|---|---|
| percent | |||||
| ≤ $10,000 | 75.0 | 73.1 | 69.9 | 61.2 | 51.5 |
| > $10,000 to ≤ $30,000 | 75.1 | 75.1 | 71.1 | 64.3 | 56.0 |
| > $30,000 to ≤ $50,000 | 75.7 | 74.2 | 72.5 | 68.3 | 61.0 |
| > $50,000 to ≤ $100,000 | 76.7 | 77.2 | 77.4 | 71.2 | 65.7 |
| > $100,000 | 69.7 | 75.3 | 74.0 | 71.5 | 66.7 |
| Sources: Statistics Canada, 1991, 1996, 2001, 2006 and 2016 censuses of population, and 2011 National Household Survey. | |||||
| 1991 | 1996 | 2001 | 2006 | 2011 | 2016 | 1996-to-2016 change | |
|---|---|---|---|---|---|---|---|
| percent | percentage points | ||||||
| Total | 68.6 | 75.4 | 75.1 | 73.0 | 67.5 | 60.4 | -15.0 |
| Adult-equivalent family income (2015 dollars) | |||||||
| ≤ $10,000 | 65.8 | 75.0 | 73.1 | 69.9 | 61.2 | 51.5 | -23.5 |
| > $10,000 to ≤ $30,000 | 68.2 | 75.1 | 75.1 | 71.1 | 64.3 | 56.0 | -19.2 |
| > $30,000 to ≤ $50,000 | 69.2 | 75.7 | 74.2 | 72.5 | 68.3 | 61.0 | -14.7 |
| > $50,000 to ≤ $100,000 | 69.6 | 76.7 | 77.2 | 77.4 | 71.2 | 65.7 | -11.0 |
| > $100,000 | 66.2 | 69.7 | 75.3 | 74.0 | 71.5 | 66.7 | -3.0 |
| Language | |||||||
| Neither English nor French | 61.5 | 62.1 | 68.3 | 56.7 | 45.6 | 32.6 | -29.5 |
| Other mother tongue, speaks English or French | 74.0 | 79.7 | 78.9 | 76.2 | 70.5 | 63.4 | -16.4 |
| English or French mother tongue | 60.2 | 69.2 | 65.0 | 66.2 | 64.9 | 61.0 | -8.2 |
| Education | |||||||
| Less than high school | 64.7 | 69.4 | 71.4 | 63.4 | 59.8 | 46.9 | -22.5 |
| High school graduate | 68.7 | 75.7 | 74.5 | 70.8 | 65.4 | 55.4 | -20.3 |
| Some postsecondary | 72.1 | 78.9 | 75.9 | 73.8 | 67.3 | 60.8 | -18.1 |
| University degree | 73.8 | 80.9 | 79.3 | 77.0 | 70.8 | 67.1 | -13.8 |
| Socioeconomic status | |||||||
| Low income,Table 2 Note 1 high school or less education, mother tongue not English or French | 68.7 | 74.2 | 75.6 | 69.8 | 62.9 | 50.7 | -23.5 |
| High income,Table 2 Note 2 university education, English or French mother tongue | 56.9 | 67.3 | 65.6 | 68.8 | 66.7 | 66.4 | -0.9 |
| Immigrants not included in above groups | 69.1 | 76.2 | 75.2 | 73.9 | 68.4 | 61.9 | -14.3 |
| Source country/region | |||||||
| United States | 31.0 | 38.4 | 41.7 | 41.8 | 44.9 | 40.5 | 2.1 |
| Central America | 66.4 | 77.1 | 74.2 | 72.1 | 67.5 | 59.0 | -18.1 |
| Caribbean | 64.7 | 72.2 | 64.1 | 66.5 | 67.7 | 58.2 | -14.0 |
| South America | 71.6 | 73.8 | 68.5 | 70.0 | 73.8 | 72.5 | -1.3 |
| Northern Europe | 54.4 | 53.9 | 45.0 | 49.2 | 48.1 | 45.2 | -8.7 |
| Western Europe | 50.2 | 52.9 | 52.4 | 53.5 | 47.9 | 47.9 | -5.0 |
| Southern Europe | 53.8 | 52.8 | 81.4 | 83.5 | 78.7 | 62.1 | 9.4 |
| Eastern Europe | 84.6 | 84.3 | 83.6 | 84.2 | 78.6 | 71.7 | -12.6 |
| Africa | 78.3 | 86.2 | 83.0 | 76.8 | 77.2 | 73.8 | -12.5 |
| South Asia | 55.7 | 66.0 | 68.0 | 68.5 | 67.2 | 59.8 | -6.2 |
| Southeast Asia | 79.2 | 81.9 | 79.0 | 74.8 | 70.3 | 61.3 | -20.7 |
| East Asia | 80.4 | 82.9 | 80.9 | 73.7 | 57.0 | 44.8 | -38.1 |
| West Asia | 79.7 | 86.6 | 84.1 | 82.1 | 74.6 | 69.7 | -16.9 |
| Oceania and other | 56.9 | 53.9 | 50.1 | 55.7 | 60.7 | 49.0 | -5.0 |
| number | |||||||
| Sample size | 64,787 | 123,636 | 137,708 | 138,024 | 163,270 | 214,067 | Note ...: not applicable |
... not applicable
|
|||||||
Changes in the citizenship rate by official language ability
Since some immigrants need to demonstrate official language skills when applying for citizenship, it is not surprising that immigrants who speak English or French or have English or French as a mother tongue are more likely to become naturalized than their counterparts who do not have these official language skills. In 1996, the difference in citizenship rates between recent immigrants with or without knowledge of an official language was relatively small (Table 2). Between 1996 and 2016, citizenship rates declined among all recent immigrants regardless of their knowledge of English or French. However, the decline was much greater among those with poorer official language skills (declining by 29.5 percentage points) than among those whose mother tongue was English or French (declining by 8.2 percentage points).
The gap in the citizenship rate between those who did not speak English or French and those with English or French as a mother tongue is examined to determine when this divergent pattern occurred. In 1996, there was a 7.1-percentage-point gap—i.e., those immigrants living in Canada for five to nine years with English or French as a mother tongue were 7.1 percentage points more likely to naturalize. This gap largely disappeared in 2001 (3.3 percentage points higher among immigrants who did not speak English or French) and then increased to 9.5 percentage points in 2006, 19.3 in 2011 and 28.4 in 2016. This suggests that the divergence in the citizenship rate by language ability occurred in all three five-year periods since 2001, but was most evident during the 2001-to-2006 period (when the gap increased by 12.8 percentage points), followed by the 2006-to-2011 period (an increase of 9.8 percentage points) and the 2011-to-2016 period (an increase of 9.1 percentage points). This divergent trend by language ability has been present for some time, but particularly since 2001.
Changes in the citizenship rate by education
Less educated immigrants have been less likely to become citizens than their more educated counterparts since 1991 (the first year of available data). In 1996, when the citizenship rate among recent immigrants peaked, 69.4% of immigrants with less than a high school education became naturalized, while that rate was 80.9% among immigrants with university degrees (Table 2). The decline in the citizenship rate among recent immigrants since 1996 was observed across all educational groups, but was much more pronounced among less educated immigrants. The citizenship rate fell 22.5 percentage points among immigrants with less than a high school education, compared with 13.8 percentage points among those with university degrees. Between 1996 and 2016, the share of immigrants with high school or less who had become citizens declined from about three-quarters to about one-half.
The difference in citizenship rates between less educated and more highly educated recent immigrants rose from 11.5 percentage points in 1996 to 20.2 percentage points in 2016—with this gap widening most between 2011 and 2016.
Changes in the citizenship rate for the more and less advantaged immigrant groups
The above analysis focused on the change in the citizenship rate among groups defined by one variable at a time. But many immigrants may have multiple characteristics associated with a low and declining rate of citizenship. There may be a greater decline in the rate among immigrants with a relatively low income, a low level of education, and poor knowledge of English or French, and little change in the citizenship rate among immigrants with high income, a high level of education, and command of English and French.
To examine potential patterns, three groups of recent immigrants are created. The first group—the least advantaged group—consists of immigrants with an AEA family income of $30,000 or lessNote whose mother tongue was not English or French and have a high school or less education. The group accounted for 15% of recent immigrant sample in the study in 2016. The second group—the most advantaged group—consists of immigrants with an AEA family income of over $50,000 with English or French as a mother tongue and a university degree. This group accounted for 5% of recent immigrant sample in the study in 2016. The remaining group consists of recent immigrants not in the above two groups.
The results indicate that between 1996 and 2016 the citizenship rate dropped by 23.5 percentage points among the most disadvantaged group (the first group), but only by 0.9 percentage points for the most advantaged group (the second group). Moreover, while the least advantaged group had a much higher citizenship rate than the most advantaged group in 1996, the pattern was reversed by 2016; the rate was 16 percentage points higher among the most advantaged group.
Changes in the citizenship rate by source region
The tendency for immigrants to become citizens can be affected not only by events in the receiving country, but by international factors as well. Changes in the economic opportunities, human rights and social stability in an immigrant’s home country, as well as the increased tendency of immigrants to move among countries, can all influence the tendency of an immigrant to become a Canadian citizen.
Typically, immigrants from wealthier countries with considerable social stability and strong human rights records are less likely to become Canadian citizens (Table 2). In 1996, when the citizenship rate among recent immigrants peaked, the United States, Europe (except Eastern Europe) and Oceania (Australia, New Zealand and other southern Pacific island countries) all had citizenship rates under 55%. Other regions had rates between 72% and 87%. Since then, trends in citizenship rates have varied across source regions.
The citizenship rate was stable or declined only modestly among immigrants from the United States, Western Europe and South America. The decline was much greater among immigrants from other regions, but East Asia stands out. The tendency of recent immigrants from this region—mainly China—to naturalize dropped from 82.9% in 1996 to 44.8% in 2016. This drop of 38.1 percentage points was distributed across all four intercensal periods, but was most evident since 2001. It may be that China’s economic rise over the past couple of decades and changing preferences among Chinese immigrants underlie the decline. By 2016, the tendency of immigrants from China to naturalize more closely resembled that of immigrants from advanced industrial countries than that of immigrants from developing countries.
Conclusion
This paper uses census data from 1991 to 2016 to examine changes in the citizenship rate among recent immigrants who meet the residency requirement to become citizens. The results show that the citizenship rate among recent immigrants peaked in 1996 and declined considerably since then. This decline primarily occurred after 2006. Furthermore, the decline in the citizenship rate varied across socio-demographic characteristics, and the timing of the decline varied across immigrant groups as well.
Immigrants with lower family incomes experienced a much larger decline in citizenship rates than did those with higher family incomes. The decline among lower income immigrant families largely occurred between 2006 and 2011. The citizenship rate also declined much more among immigrants with poorer official language skills than it did among immigrants whose mother tongue was English or French. The citizenship rate among immigrants with poorer official language skills has been declining since 2001 and was observed over all intercensal periods. Education was also a factor, with citizenship rates declining much more among immigrants with lower than higher levels of educational attainment. This was primary observed between 2011 and 2016.
When all three of these factors—family income, knowledge of official languages, and educational attainment—are combined, the citizenship rate was more or less constant between 1996 and 2016 for the most advantaged group of recent immigrants (i.e., with a high income, university education, and English or French as a mother tongue). In contrast, it declined significantly among the more disadvantaged group (i.e., with a low income, high school or less education and mother tongue not English or French).
There was also significant variation in the extent to which citizenship rates declined among immigrants from different source regions. Most striking was the large decline in citizenship take-up among immigrants from East Asia—mainly China. Indeed, by 2016 the citizenship rate among recent Chinese immigrants more closely resembled the rate among immigrants from developed rather than from developing countries.
References
Bratsberg, B., J.F. Ragan, and Z.M. Nasir. 2002. “The effect of naturalization on wage growth: A panel study of young male immigrants.” Journal of Labor Economics 20 (3): 568–597.
Hayfron, J.E. 2008. “The economics of Norwegian citizenship.” In The Economics of Citizenship, ed. P. Bevelander and D.J. DeVoretz, p. 89–104. Malmo: Malmo University.
Picot, G., and F. Hou. 2011. “Citizenship acquisition in Canada and the United States: Determinants and economic benefit.” In Naturalisation: A Passport for the Better Integration of Immigrants?, chapter 6, p. 154–181. Paris: OECD Publishing, doi: 10.1787/9789264099104-en.
Statistics Canada. n.d. Census 2A-L – 2016. Last updated February 7, 2017. Available at: http://www23.statcan.gc.ca/imdb/p3Instr.pl?Function=getInstrumentList&Item_Id=295122&UL=1V& (accessed April 9, 2019). PDF version: 3901_Q2_V4-eng.pdf (SECURED).
- Date modified: