
Economic and Social Reports
The short-term labour market outcomes of blended visa office-referred refugees
DOI: https://doi.org/10.25318/36280001202400100003-eng
Text begins
Abstract
In 2013, Immigration, Refugees and Citizenship Canada (IRCC) introduced a new refugee resettlement category called the Blended Visa Office-Referred (BVOR) Program. This admission stream combined the core principles of IRCC’s Government-Assisted Refugees (GAR) program and the Private Sponsorship of Refugees program, by sharing the resettlement costs between the government and private sponsors. At present, research that examines the economic outcomes of resettled refugees at the admission category level is limited, with virtually no comprehensive data on the economic outcomes of refugees admitted through the relatively new BVOR stream. This study asks two questions. First, what are the economic outcomes of BVOR refugees who have been admitted to Canada since 2013? Second, how do these outcomes compare with those of other resettled refugees who were admitted through the GAR and Private Sponsorship of Refugees programs during this time? The study found that BVOR refugees reported stronger labour market outcomes than GARs but fell behind privately sponsored refugees in the short term. While differences in sociodemographic characteristics could account for some of these observed outcomes, the findings also indicate that unobserved factors, particularly sponsorship models, may play a role in improved economic outcomes in the short term.
Keywords: blended visa office-referred program, government-assisted refugees, private sponsorship
Authors
Yasmin Gure is with the Research and Data Branch at Immigration, Refugees and Citizenship Canada. Feng Hou is with the Social Analysis and Modelling Division, Analytical Studies and Modelling Branch, at Statistics Canada.
Acknowledgments
This study was conducted by Immigration, Refugees and Citizenship Canada and Statistics Canada. The authors would like to thank Chris Hamilton, Stéphane Arabackyj and Candace Maynard for their advice and comments on an earlier version of this paper.
Introduction
In 2013, Immigration, Refugees and Citizenship Canada (IRCC) introduced a new refugee resettlement category called the Blended Visa Office-Referred (BVOR) Program (2016a). This admission stream combined the core principles of IRCC’s Government-Assisted Refugees (GAR) program and the Private Sponsorship of Refugees program, by sharing the resettlement costs between the government and private sponsors. In practice, the BVOR Program would expedite the resettlement process by matching refugees who have already been screened and interviewed with sponsors in Canada. However, while the program seemingly presents many benefits for all parties involved, uptake of the program has been comparatively low, with admissions consistently falling under IRCC’s set targets (See Appendix Chart A.1). While many factors have been cited over the years for the low number of BVOR refugees admitted annually, IRCC is committed to improving participation in the BVOR Program (IRCC, 2020). Therefore, the integration outcomes of refugees admitted through this program will be particularly relevant going forward.
Although refugees are not admitted for economic reasons, their labour market outcomes remain an integral aspect of successful integration. Positive economic outcomes are associated with improved social and health outcomes, as well as a stronger sense of belonging (Kaida, Hou & Stick, 2020). However, research that examines the economic outcomes of resettled refugees at the admission category level is limited, with virtually no comprehensive data on the economic outcomes of refugees admitted through the comparatively new BVOR stream (IRCC, 2019; Kaida, Stick & Hou, 2022). This presents a key knowledge gap, as the BVOR Program has been in effect for several years, with minimal understanding of how refugees admitted through this stream perform in Canada.
This study asks two questions. First, what are the economic outcomes of BVOR refugees who have been admitted to Canada since 2013? Second, how do these outcomes compare with those of other resettled refugees who were admitted through the GAR and Private Sponsorship of Refugees programs during this time? This study also seeks to understand the extent to which differences in labour market outcomes among BVOR refugees, GARs and privately sponsored refugees (PSRs) can be accounted for by differences in refugees’ sociodemographic characteristics. Through answering these questions, this study aims to provide relevant information on how the BVOR Program has performed since its inception and inform policy discussions on the future of the program.
Background
Overview of Immigration, Refugees and Citizenship Canada refugee resettlement
Canada’s domestic commitment to selecting refugees on a humanitarian basis began with the 1976 Immigration Act, which distinguished refugees as a separate immigration category, with its own selection and admission criteria (Hyndman, Payne & Jimenez, 2017). The act led to the creation of the GAR program and the Private Sponsorship of Refugees program, which are the two main admission categories that refugees are resettled through. Under the Immigration Act, individuals abroad who sought refugee status in Canada were required to prove not only that they met the definition of a convention refugee,Note but also that they would be able to establish themselves in Canada shortly after arrival. As such, human capital characteristics such as age, educational attainment and skills were also considered relevant factors in their admission (Vineberg, 2018). In 2002, the Immigration and Refugee Protection Act (IRPA) replaced the Immigration Act as Canada’s primary federal legislation on immigration. The act significantly revised Canada’s refugee priorities by strengthening its commitment to admitting refugees on humanitarian grounds. In effect, this resulted in loosening admission criteria for refugees and prioritizing the most vulnerable for resettlement (Government of Canada, 2001).
Before 2013, refugees selected for resettlement were admitted to Canada under the GAR and Private Sponsorship of Refugees programs. Under the GAR stream, refugees abroad are referred by the United Nations High Commissioner for Refugees (UNHCR) or other referral organizations for resettlement. Initial resettlement costs for GARs are covered entirely by the Government of Canada or the province of Quebec. GARs generally receive support for up to one year from the date of arrival in Canada, in the form of accommodation, food, clothing and assistance in securing employment (IRCC, 2021a). By contrast, refugees admitted under the Private Sponsorship of Refugees program are referred for resettlement by sponsors within Canada, who are also responsible for all financial costs during the initial resettlement period (IRCC, 2021b). Refugees may be sponsored under the Private Sponsorship of Refugees program by sponsorship agreement holders (SAHs),Note community sponsorsNote and groups of five (G5).Note
The Blended Visa Office-Referred Program
In 2013, IRCC launched the BVOR Program, which combined the core principles of the GAR and PSR admission categories. Through the BVOR Program, the resettlement costs of refugees are shared between the government and private sponsors. Refugees abroad are referred for resettlement by the UNHCR to Canadian visa offices as GAR candidates, after which IRCC officers assess cases for BVOR suitability against predetermined criteria.Note Refugees deemed eligible to participate in the BVOR Program are referred to the Refugee Sponsorship Training Program for matching with potential private sponsors in Canada. Upon arrival, BVOR refugees receive up to six months of financial support from the government through the Resettlement Assistance Program (RAP), with private sponsors committing to an additional six months of financial support, along with all start-up costs (IRCC, 2021c).
The BVOR Program provides sponsors with the potential benefit of making refugee sponsorship an easier process; in addition to reducing their financial burden, sponsors would be able to connect with refugees who have already been screened and interviewed. This would significantly decrease processing times and thus allow refugees to be resettled in Canada sooner. Nonetheless, uptake of the BVOR Program in the first two years was quite low. In 2013, IRCC had a target of processing 200 BVOR refugees, but the number of admissions fell short, at 150.Note In the following year, IRCC increased its target to 500 BVOR refugees, with only about half of the target reached by the end of 2014 (Appendix Chart A.1).
During the initial launch period of the BVOR stream, a key reason cited for the low enrolment was the lack of clarity on how BVOR refugees should be selected and processed (IRCC, 2016a). An evaluation of the BVOR Program found that despite its introduction being followed by operational bulletins and modifications to manuals, immigration officers had not received sufficient guidelines and training regarding the implementation of the BVOR category. This led to large discrepancies in how refugees were selected as BVOR refugees. Furthermore, the evaluation found that the guidelines for the BVOR stream were not well understood by sponsors in Canada, ultimately leading to low uptake (IRCC, 2016a).
The BVOR Program experienced a significant increase in admissions in 2016, primarily because of the government’s large-scale Syrian resettlement initiative (IRCC, 2019). With strong public and political support, the BVOR stream offered an additional pathway for the resettlement of more Syrian refugees and was employed at an unprecedented scale. In 2016, BVOR admissions were more than double IRCC’s target. However, following the Syrian resettlement initiative, demand for the BVOR Program has not been sustained, with admissions consistently below IRCC’s targets (Appendix Chart A.1).
In more recent years, the BVOR Program has faced criticism from sponsorship groups and refugee advocacy organizations; in particular, there were concerns that the program serves to subsidize the government’s resettlement targets, rather than adding to the overall number of refugees who may be resettled to Canada. This argument rests on the premise of “the principle of additionality,” which emphasizes that private sponsorship should be considered supplementary to the government’s resettlement commitments (Canadian Council for Refugees, 2016). This concern has been reinforced by IRCC’s 2017 Immigration Levels Plan, where the target set for GAR admissions, at 7,500, was noted to be consistent with previous admission targets, ranging from 5,000 to 8,000. Comparatively, the target proposed for PSRs in 2017 was 16,000, substantially higher than the target range of 3,000 to 6,000 in the decade before (IRCC, 2016b). The recent level targets have led to some concerns that private citizens are becoming increasingly more responsible for refugee resettlement in Canada (Labman & Pearlman, 2018).
Review of literature on resettlement outcomes
Since refugees are primarily admitted for humanitarian reasons rather than economic, their sociodemographic profile tends to be considerably different than that of other immigrants. Refugees tend to be less likely to speak an official language, as well as less likely to possess postsecondary education qualifications, which are key factors of labour market success. As a result, their economic outcomes tend to be poorer than those of other immigrants (Kaida, Hou & Stick, 2020).
Within the resettled refugee admission category, GARs and PSRs are similar in their pre-migration circumstances and motivations for resettlement. However, there exist some key differences between GARs and PSRs. Empirical data on the sociodemographic characteristics of resettled refugees highlight that GARs tend to settle in smaller cities, have lower official language skills and possess lower education credentials than PSRs (Jedwab, 2018). Moreover, PSRs may receive additional and more focused support from sponsorship, which may not be available to GARs. In addition to providing financial support for PSRs, sponsors are also responsible for creating a settlement plan, in which they help sponsored refugees secure employment, build social networks, learn about services that exist in their communities, and understand Canadian culture and values (IRCC, 2021b). Additionally, research has noted that some ethnic communities may selectively sponsor refugees who share their background, allowing them to access pre-existing social networks within their ethnic group, as well as receive culturally sensitive resettlement support (Portes & Rumbaut, 2001). These factors can be expected to play a key role in the economic outcomes of resettled refugees.
Research on economic outcomes within the resettled refugee class is relatively limited. Nonetheless, existing empirical data on PSRs have indicated that they generally report higher employment rates than GARs in the initial years after arrival, as well as higher average employment earnings (Picot, Zhang & Hou, 2019). However, despite this initial advantage, the economic outcomes of PSRs and GARs tend to converge with time. An analysis of refugees who were admitted over a 10-year period found that 64.4% of PSRs reported employment income in their first year after landing, compared with 35.6% of GARs. However, by the 10th year in Canada, the share of GARs who reported employment income was on par with that of PSRs, at 66.0% and 67.9%, respectively. Similarly, PSRs reported average entry employment earnings of $20,000, almost double the entry earnings of GARs, at $11,900. Ten years after landing, the earnings gap between the two groups narrowed considerably, with GARs reporting average employment earnings of $27,000, compared with $30,000 for PSRs (IRCC, 2018).
Empirical data have also found that GARs generally access social assistance at a higher rate than PSRs, particularly in the initial years after arrival. Among GARs who landed during the 10-year period of analysis, 91.7% reported social assistance use in their first year after arrival. In comparison, the share of PSRs who accessed social assistance in their first year after arrival was 29.6%.Note Over time, social assistance use among resettled refugees generally decreases; 10 years after arrival, 32.7% of GARs and 25.3% of PSRs reported using social assistance (IRCC, 2018).
The analysis on outcomes of resettled refugees has focused almost exclusively on GARs and PSRs, with essentially no comprehensive data on the economic outcomes of BVOR refugees. Previously, this group has been excluded from analysis on labour market outcomes, as the sample size is small compared with the established GAR and Private Sponsorship of Refugees programs. However, the lack of data on BVOR outcomes presents a significant data gap in what is known about resettled refugees. As such, it is imperative to examine the outcomes of this group. To date, one analysis on BVOR outcomes was conducted by IRCC in 2017, as part of the evaluation on Operation Syrian Refugees (IRCC, 2019). The report found that 15% of adult Syrian BVOR refugees reported employment earnings in their first months after arrival, compared with 40% of Syrian PSRs and 5% of Syrian GARs. The report also noted that one year after arrival, Syrian BVOR refugees had higher average employment earnings than Syrian GARs, but lower than Syrian PSRs. Lastly, the report’s analysis on social assistance found that 88% of Syrian BVOR refugees accessed social assistance in their first year after arrival, compared with 93% of Syrian GARs and 2% of Syrian PSRs. While this report was comprehensive in that it presented key economic outcomes of BVOR refugees, it was limited in its focus on Syrian refugees who had landed as part of the resettlement initiative of 2015 and 2016 (IRCC, 2019). Another study examined the employment rate and earnings of BVOR refugees who arrived from 2014 to 2017 and found that their labour market outcomes varied considerably by landing year, making it difficult to generalize their performance relative to GARs and PSRs (Kaida, Stick & Hou, 2022).
Presently, analysis on the economic outcomes of BVOR refugees is a research priority, since there are key data gaps in the understanding of their labour market performance. Moreover, while refugees are ultimately not selected for economic reasons, a key objective of the IRPA is to support self-sufficiency among refugees, as well as promote their social and economic well-being (Department of Justice, 2002). Positive labour market outcomes play an integral role in successful integration. Therefore, the examination of refugees’ economic performance is imperative.
Building on existing research on the economic outcomes of resettled refugees, this report aims to address a key knowledge gap by analyzing the labour market performance of BVOR refugees since the program’s inception in 2013. This study is among the first to comprehensively compare the economic outcomes of BVOR refugees and other resettled refugees. The study further evaluates the extent to which differences in refugees’ sociodemographic characteristics can explain differences in the labour market outcomes of BVOR refugees, GARs and PSRs. The study also examines changes in the labour market outcomes of BVOR refugees across recent arrival cohorts.
Data, measures and methods
Data
This study used the Longitudinal Immigration Database (IMDB), which combines the landing records and annual tax information of immigrants. The database includes immigrants who have filed at least one tax return since 1982. The landing records contain immigrant characteristics at the time of landing, such as admission category, age, education, marital status, source country and official language ability. Tax records provide information on annual incomes, current marital status and place of residence (Evra & Prokopenko, 2018). The IMDB data in this study cover landing information up to 2021 and tax information up to 2020. The sample consisted of individuals who landed in Canada as PSRs, GARs or BVOR refugees, with the analysis on economic outcomes focusing specifically on those aged 15 to 54 at landing.
Given the particularly low number of BVOR refugees admitted in 2013, the first year of the program, the analysis in this report will begin with BVOR refugees who landed in 2014. Nonetheless, it must be noted that even in subsequent landing years where BVOR admissions have increased significantly, landings in this admission category remain substantially lower than GAR and PSR admissions.
Measures
The key variables that were used to measure economic outcomes are the incidence of employment earnings, median employment earnings and the incidence of social assistance. The incidence of employment earnings was used as a proxy for the employment rate and was calculated based on the share of immigrants who report employment earnings among all immigrants in the sample group. Median employment earnings are defined by the level of income at which half the population had higher income and half had lower income. Income estimates were expressed in 2020 constant dollars to factor in inflation and enable comparisons across time in real terms. Lastly, the incidence of social assistance was calculated as the number of immigrants who live in a family that reports social assistance income, divided by the number of immigrants in the same group. These economic variables are particularly relevant for measuring integration; securing employment is an indicator of self-sufficiency, while higher employment earnings reduce dependency on social assistance and facilitate access to housing, while also enhancing health status and helping immigrants gain a stronger sense of belonging (Kaida, Hou & Stick, 2020).
Methods
The analysis began with descriptive statistics to illustrate the sociodemographic characteristics of BVOR refugees who landed in a selected admission year, compared with GARs and PSRs who also landed in the same period. In subsequent analysis, descriptive statistics were used to examine how the incidence of employment earnings, median employment earnings and the incidence of social assistance among the three resettled refugee groups changed, both across arrival cohorts and over time for a selected landing cohort.
The multivariate analysis section explored how changes in sociodemographic characteristics, including sex, age, education, official language, source region and census metropolitan area (CMA) of residence, could account for differences among BVOR refugees, GARs and PSRs in their incidence of employment earnings, median employment earnings and incidence of social assistance.
Descriptive results
Sociodemographic characteristics of resettled refugees
As shown in Table 1, BVOR refugees in the 2014-to-2015 landing cohort had a moderately higher share of females (52.4%), compared with GARs (49.4%) and PSRs (46.8%). Almost three-quarters (73.5%) of BVOR refugees were in the core-working-age groupNote at arrival, higher than the share of GARs (67.0%) and PSRs (71.1%). In terms of educational attainment, the share of BVOR refugees who completed high school or more (10.2%) was lower than the share reported for GARs (13.6%) and significantly below the rate reported by PSRs (33.7%).Note For all three groups, Western Asia accounted for the majority of admissions, with the share highest among BVOR refugees (59.5%), followed by PSRs (57.0%) and GARs (51.9%). Lastly, in terms of official language proficiency at arrival, BVOR refugees were more likely than PSRs to report that they spoke neither English nor French (61.2% compared with 38.5%), but less than GARs (75.7%).
| Government-assisted refugees | Privately sponsored refugees | Blended visa office-referred refugees | |||||||
|---|---|---|---|---|---|---|---|---|---|
| 2014 to 2015 | 2016 | 2017 to 2019 | 2014 to 2015 | 2016 | 2017 to 2019 | 2014 to 2015 | 2016 | 2017 to 2019 | |
| count | |||||||||
| Total admission | 9,871 | 10,952 | 14,591 | 9,802 | 11,834 | 35,170 | 521 | 2,142 | 1,817 |
| percent | |||||||||
| Sex | |||||||||
| Male | 50.6 | 50.9 | 50.9 | 53.2 | 53.2 | 55.3 | 47.6 | 50.7 | 49.8 |
| Female | 49.4 | 49.1 | 49.1 | 46.8 | 46.8 | 44.7 | 52.4 | 49.3 | 50.3 |
| Age at landing | |||||||||
| 15 to 19 | 17.7 | 16.8 | 20.1 | 13.0 | 12.1 | 12.2 | 14.6 | 14.9 | 16.7 |
| 20 to 24 | 15.3 | 11.9 | 16.8 | 16.0 | 13.6 | 14.6 | 11.9 | 12.0 | 15.9 |
| 25 to 29 | 16.0 | 15.1 | 13.5 | 17.7 | 17.1 | 18.0 | 20.7 | 16.7 | 14.8 |
| 30 to 34 | 16.1 | 18.9 | 15.4 | 15.9 | 17.5 | 18.4 | 19.8 | 19.5 | 18.4 |
| 35 to 39 | 12.8 | 16.6 | 12.9 | 12.5 | 13.7 | 14.0 | 16.7 | 17.4 | 15.2 |
| 40 to 44 | 10.3 | 10.7 | 10.0 | 10.9 | 11.1 | 10.3 | 9.6 | 10.5 | 10.5 |
| 45 to 54 | 11.7 | 10.1 | 11.3 | 14.1 | 14.9 | 12.5 | 6.7 | 9.0 | 8.5 |
| Education level | |||||||||
| Not stated | 0.9 | 5.9 | 4.99 | 0.3 | 7.9 | 1.37 | 23.8 | 17.5 | 3.36 |
| Less than high school | 85.5 | 83.4 | 81.7 | 66.0 | 55.0 | 60.5 | 66.0 | 72.4 | 81.7 |
| High school or trades certificate | 5.4 | 5.1 | 6.5 | 13.5 | 13.2 | 13.2 | 2.3 | 3.8 | 7.4 |
| Some postsecondary | 2.3 | 2.0 | 1.7 | 6.2 | 6.4 | 5.8 | 1.0 | 2.2 | 1.9 |
| Bachelor's degree or above | 5.9 | 3.6 | 5.1 | 14.0 | 17.6 | 19.2 | 6.9 | 4.2 | 5.6 |
| World area of birth | |||||||||
| Other regions | 3.9 | 1.0 | 3.8 | 5.5 | 2.2 | 1.3 | 4.2 | 0.9 | 4.8 |
| Africa | 34.3 | 15.1 | 41.7 | 32.3 | 31.2 | 39.1 | 22.5 | 13.5 | 43.6 |
| Other Asia | 9.9 | 2.2 | 2.6 | 5.2 | 1.1 | 3.3 | 13.8 | 3.5 | 2.8 |
| Western Asia | 51.9 | 81.6 | 51.9 | 57.0 | 65.5 | 56.2 | 59.5 | 82.1 | 48.8 |
| Official language | |||||||||
| English | 14.3 | 16.0 | 15.0 | 56.7 | 56.5 | 59.7 | 35.9 | 28.4 | 21.7 |
| French | 6.6 | 2.9 | 4.8 | 2.3 | 2.1 | 1.5 | 0.2 | 1.3 | 3.4 |
| English and French | 2.8 | 0.4 | 1.8 | 2.2 | 0.5 | 2.0 | 1.2 | 0.5 | 2.8 |
| Neither English nor French | 75.7 | 74.1 | 67.2 | 38.5 | 35.6 | 34.4 | 61.2 | 65.2 | 62.9 |
| Not stated | 0.6 | 6.7 | 11.2 | 0.3 | 5.3 | 2.3 | 1.5 | 4.6 | 9.2 |
|
Note: The percentages of males and females may not sum to 100 because of missing or other identities. Source: Statistics Canada, Longitudinal Immigration Database. |
|||||||||
The sociodemographic profile of resettled refugees changed significantly in the following years. IRCC launched Operation Syrian Refugees in November 2015; under this large-scale resettlement initiative, the department sought to resettle 25,000 Syrian refugees by the end of February 2016. In addition to significantly increasing the number of GARs and PSRs, the Syrian resettlement initiative led to an unprecedented uptick in BVOR admissions. As shown in Table 1, 82.1% of BVOR refugees and 81.6% of GARs who landed in 2016 were from Western Asia, illustrating the significant influence of Syrian refugees. Among PSRs, just under two-thirds (65.5%) were admitted from this region. For all three refugee streams, males accounted for slightly higher admissions, at just over 50%. Additionally, the share of refugees who were in the core-working-age group at arrival was similar across the three refugee streams, at 73.1% among BVOR refugees, 71.3% among GARs and 74.3% among PSRs. PSRs were the most educated, with 17.6% reporting that they had a bachelor’s degree or higher, compared with 4.2% for BVOR refugees and 3.6% among GARs. PSRs in this landing cohort were also more likely to report knowledge of an official language, at 59.1%, far exceeding the rate reported among BVOR refugees (30.2%) and GARs (19.2%).
For 2017 to 2019, the number of BVOR refugees and GARs declined significantly compared with the 2016 admission year. This decline was to be expected, because the government had set particularly ambitious resettlement objectives in 2016 to accommodate the Syrian refugee resettlement, which was not expected to continue in subsequent years. The BVOR Program, which had experienced a boost in interest during the Syrian refugee resettlement initiative, did not maintain its momentum, and admissions fell below IRCC’s targets in 2017 (see Appendix Chart A.1). Interestingly, the annual number of PSRs admitted over the 2017-to-2019 admission years was consistent with or even higher than the 2016 landing year. Moreover, the profile of PSRs who were resettled in 2016 was similar to that of the following years’ landing cohort, in terms of sex, age, educational attainment and source region. In comparison, the profiles of BVOR refugees and GARs in the 2016 cohort were significantly different from those of their counterparts in the 2017-to-2019 cohort. Most notably, the share of BVOR refugees and GARs resettled from Western Asia declined substantially; among BVOR refugees, the proportion declined by 33.3 percentage points, while the share decreased by 29.7 percentage points for GARs.
Incidence of employment earnings
Chart 1 illustrates the incidence of employment earnings for GARs, PSRs and BVOR refugees who landed in 2014, by years since landing. In the first year after arrival, PSRs reported the highest incidence of employment earnings, at 75.4%, with GARs reporting the lowest incidence of employment earnings, at 36.7%. The share of BVOR refugees who reported employment earnings in their first year after landing was between GARs and PSRs, at 59.5%. This trend continued over the following years, with PSRs continuing to report the highest incidence of employment earnings of the three refugee admission categories. However, while the incidence of employment earnings among PSRs increased 4 percentage points from the first year to the sixth year, the incidence among GARs increased almost 25 percentage points from 36.7% to 61.6%. To a lesser extent, the share of BVOR refugees who reported employment income also rose significantly, from 59.5% in the first year after landing to 72.6% in the fifth year.

Data table for Chart 1
| 2014 landing cohort | Years since landing | |||||
|---|---|---|---|---|---|---|
| 1 | 2 | 3 | 4 | 5 | 6 | |
| percent | ||||||
| Government-assisted refugees | 36.7 | 48.4 | 55.3 | 61.2 | 64.2 | 61.6 |
| Privately sponsored refugees | 75.4 | 75.8 | 77.4 | 79.4 | 79.2 | 76.9 |
| Blended visa office-referred refugees | 59.5 | 60.7 | 61.7 | 72.2 | 72.6 | 70.8 |
| Source: Statistics Canada, Longitudinal Immigration Database. | ||||||
There are a few factors that can help explain why PSRs fared significantly better than GARs and BVOR refugees in the first year after arrival. Firstly, PSRs in the 2014 landing cohort were characterized by a moderately higher share of males than both GARs and BVOR refugees, and this may have provided an advantage in the labour market. Secondly, PSRs had higher levels of education than GARs and BVOR refugees. Furthermore, the share of PSRs who reported knowledge of an official language at arrival was considerably higher than that of GARs and BVOR refugees. Because language proficiency plays a key role in improving labour market prospects, it is very likely that PSRs who knew an official language at landing would fare better in the labour market, compared with their peers who did not. Indeed, the increase in the incidence of employment earnings among GARs and BVOR refugees over time is likely partly attributable to this cohort’s improved language proficiency. Finally, the benefit of private sponsorship and the access to networks that they may generate cannot be overlooked; in addition to financially supporting refugees, private sponsors are also expected to complete a settlement plan for the sponsored refugee, which includes helping them to secure employment (IRCC, 2021d). Private sponsorship may also have benefits for employment among BVOR refugees; despite the low language profile of this group, the share of BVOR refugees with employment income was 22.8 percentage points higher than that of GARs. This finding is supported by existing research that has found that refugees with lower language abilities benefit from private sponsorship as much as refugees with stronger official language skills (Kaida, Hou & Stick, 2020).
The incidence of employment earnings among BVOR refugees varied considerably across landing cohorts, much more than among GARs and PSRs (Table 2). Among BVOR refugees, the share who reported employment earnings in their first year after landing was highest among those who landed in 2014, at almost 60%. In subsequent years, the share of BVOR landing cohorts with employment earnings one year after landing was significantly lower, ranging from 40% to 52%. Some key differences in the demographic profile of these landing cohorts may explain the difference in entry employment prospects. The educational attainment of BVOR refugees who landed from 2016 to 2019 was lower than that of those who landed in 2014. The 2014 landing cohort was also more likely to know an official language than the 2016 cohort, and even more so than the 2017-to-2019 cohort. Because both education level and knowledge of an official language play key roles in employment opportunities, these factors may explain why BVOR refugees who landed in 2014 had an advantage in the labour market over subsequent landing cohorts.
| Years since landing | ||||||
|---|---|---|---|---|---|---|
| 1 | 2 | 3 | 4 | 5 | 6 | |
| percent | ||||||
| Government-assisted refugees | ||||||
| 2014 cohort | 36.7 | 48.4 | 55.3 | 61.2 | 64.2 | 61.6 |
| 2015 cohort | 31.4 | 43.1 | 52.4 | 57.6 | 56.1 | Note ..: not available for a specific reference period |
| 2016 cohort | 26.3 | 36.3 | 40.8 | 42.5 | Note ..: not available for a specific reference period | Note ..: not available for a specific reference period |
| 2017 cohort | 37.2 | 47.4 | 51.0 | Note ..: not available for a specific reference period | Note ..: not available for a specific reference period | Note ..: not available for a specific reference period |
| 2018 cohort | 37.9 | 45.8 | Note ..: not available for a specific reference period | Note ..: not available for a specific reference period | Note ..: not available for a specific reference period | Note ..: not available for a specific reference period |
| 2019 cohort | 35.6 | Note ..: not available for a specific reference period | Note ..: not available for a specific reference period | Note ..: not available for a specific reference period | Note ..: not available for a specific reference period | Note ..: not available for a specific reference period |
| Privately sponsored refugees | ||||||
| 2014 cohort | 75.4 | 75.8 | 77.4 | 79.4 | 79.2 | 76.9 |
| 2015 cohort | 70.8 | 74.8 | 77.5 | 79.9 | 78.1 | Note ..: not available for a specific reference period |
| 2016 cohort | 72.0 | 74.2 | 76.8 | 76.3 | Note ..: not available for a specific reference period | Note ..: not available for a specific reference period |
| 2017 cohort | 70.1 | 73.8 | 73.4 | Note ..: not available for a specific reference period | Note ..: not available for a specific reference period | Note ..: not available for a specific reference period |
| 2018 cohort | 70.8 | 72.0 | Note ..: not available for a specific reference period | Note ..: not available for a specific reference period | Note ..: not available for a specific reference period | Note ..: not available for a specific reference period |
| 2019 cohort | 72.0 | Note ..: not available for a specific reference period | Note ..: not available for a specific reference period | Note ..: not available for a specific reference period | Note ..: not available for a specific reference period | Note ..: not available for a specific reference period |
| Blended visa office-referred refugees | ||||||
| 2014 cohort | 59.5 | 60.7 | 61.7 | 72.2 | 72.6 | 70.8 |
| 2015 cohort | 45.2 | 49.6 | 52.8 | 60.2 | 57.4 | Note ..: not available for a specific reference period |
| 2016 cohort | 45.6 | 50.5 | 52.7 | 50.3 | Note ..: not available for a specific reference period | Note ..: not available for a specific reference period |
| 2017 cohort | 46.8 | 51.6 | 54.1 | Note ..: not available for a specific reference period | Note ..: not available for a specific reference period | Note ..: not available for a specific reference period |
| 2018 cohort | 40.9 | 49.5 | Note ..: not available for a specific reference period | Note ..: not available for a specific reference period | Note ..: not available for a specific reference period | Note ..: not available for a specific reference period |
| 2019 cohort | 52.3 | Note ..: not available for a specific reference period | Note ..: not available for a specific reference period | Note ..: not available for a specific reference period | Note ..: not available for a specific reference period | Note ..: not available for a specific reference period |
.. not available for a specific reference period
|
||||||
Median employment earnings
Chart 2 outlines the median employment earningsNote over time for GARs, PSRs and BVOR refugees who landed in 2014. PSRs reported the highest employment earnings one year after arrival, at $21,500, which was significantly higher than both BVOR refugees ($13,800) and GARs ($9,500). However, the median employment earnings of PSRs did not grow at the same pace as those of GARs and BVOR refugees; five years after arrival, PSRs reported median employment earnings of $26,100, which was only marginally higher than those of BVOR refugees, at $25,300. The median employment earnings of GARs more than doubled after five years in Canada but remained behind those of PSRs and BVOR refugees, at $20,800. The convergence of employment earnings between the three refugee categories is supported by the existing literature, which suggests that refugee admission category of entry has little effect on earnings after a decade (Picot, Zhang & Hou, 2019).

Data table for Chart 2
| 2014 landing cohort | Years since landing | |||||
|---|---|---|---|---|---|---|
| 1 | 2 | 3 | 4 | 5 | 6 | |
| 2020 constant dollars | ||||||
| Government-assisted refugees | 9,500 | 14,700 | 16,400 | 19,300 | 20,800 | 18,800 |
| Privately sponsored refugees | 21,500 | 22,900 | 23,800 | 25,700 | 26,100 | 24,200 |
| Blended visa office-referred refugees | 13,800 | 20,400 | 22,700 | 23,700 | 25,300 | 25,000 |
| Source: Statistics Canada, Longitudinal Immigration Database. | ||||||
The median employment earnings of BVOR refugees varied considerably across landing cohorts, while the earnings of both GARs and PSRs were mostly consistent (Table 3). BVOR refugees who landed in 2014 reported median entry earnings of $13,800, while BVOR refugees who landed in 2015 reported median entry earnings that were less than half those of the previous year ($6,500). The median entry employment earnings of BVOR refugees who landed in subsequent years were higher than in 2015 but remained lower than the entry earnings of those who landed in 2014.
| Years since landing | ||||||
|---|---|---|---|---|---|---|
| 1 | 2 | 3 | 4 | 5 | 6 | |
| 2020 constant dollars | ||||||
| Government-assisted refugees | ||||||
| 2014 cohort | 9,500 | 14,700 | 16,400 | 19,300 | 20,800 | 18,800 |
| 2015 cohort | 8,800 | 14,200 | 16,400 | 18,600 | 16,800 | Note ..: not available for a specific reference period |
| 2016 cohort | 7,800 | 12,100 | 13,900 | 12,600 | Note ..: not available for a specific reference period | Note ..: not available for a specific reference period |
| 2017 cohort | 11,200 | 15,400 | 14,100 | Note ..: not available for a specific reference period | Note ..: not available for a specific reference period | Note ..: not available for a specific reference period |
| 2018 cohort | 9,900 | 12,800 | Note ..: not available for a specific reference period | Note ..: not available for a specific reference period | Note ..: not available for a specific reference period | Note ..: not available for a specific reference period |
| 2019 cohort | 10,300 | Note ..: not available for a specific reference period | Note ..: not available for a specific reference period | Note ..: not available for a specific reference period | Note ..: not available for a specific reference period | Note ..: not available for a specific reference period |
| Privately sponsored refugees | ||||||
| 2014 cohort | 21,500 | 22,900 | 23,800 | 25,700 | 26,100 | 24,200 |
| 2015 cohort | 18,300 | 21,800 | 24,000 | 25,700 | 21,800 | Note ..: not available for a specific reference period |
| 2016 cohort | 19,800 | 24,000 | 24,800 | 21,500 | Note ..: not available for a specific reference period | Note ..: not available for a specific reference period |
| 2017 cohort | 21,000 | 23,200 | 20,500 | Note ..: not available for a specific reference period | Note ..: not available for a specific reference period | Note ..: not available for a specific reference period |
| 2018 cohort | 20,700 | 19,400 | Note ..: not available for a specific reference period | Note ..: not available for a specific reference period | Note ..: not available for a specific reference period | Note ..: not available for a specific reference period |
| 2019 cohort | 18,700 | Note ..: not available for a specific reference period | Note ..: not available for a specific reference period | Note ..: not available for a specific reference period | Note ..: not available for a specific reference period | Note ..: not available for a specific reference period |
| Blended visa office-referred refugees | ||||||
| 2014 cohort | 13,800 | 20,400 | 22,700 | 23,700 | 25,300 | 25,000 |
| 2015 cohort | 6,500 | 13,400 | 17,000 | 17,600 | 15,700 | Note ..: not available for a specific reference period |
| 2016 cohort | 9,700 | 15,500 | 17,600 | 14,300 | Note ..: not available for a specific reference period | Note ..: not available for a specific reference period |
| 2017 cohort | 10,700 | 15,400 | 13,300 | Note ..: not available for a specific reference period | Note ..: not available for a specific reference period | Note ..: not available for a specific reference period |
| 2018 cohort | 8,500 | 12,600 | Note ..: not available for a specific reference period | Note ..: not available for a specific reference period | Note ..: not available for a specific reference period | Note ..: not available for a specific reference period |
| 2019 cohort | 12,400 | Note ..: not available for a specific reference period | Note ..: not available for a specific reference period | Note ..: not available for a specific reference period | Note ..: not available for a specific reference period | Note ..: not available for a specific reference period |
.. not available for a specific reference period
|
||||||
Social assistance
As shown in Chart 3, GARs reported the highest incidence of social assistance one year after landing, at 93.4%, followed by BVOR refugees, at 72.1%. The high share of GARs and BVOR refugees who reported accessing social assistance in the first year after landing reflects the RAP; both GARs and BVOR refugees receive RAP income support in their first year in Canada, which is declared for tax purposes as social assistance benefits (IRCC, 2019). The share of GARs and BVOR refugees who reported accessing social assistance declined considerably as time in Canada increased. Among GARs who landed in 2014, the incidence of social assistance declined by 46.6 percentage points five years after arrival. Similarly, the share of BVOR refugees who accessed social assistance declined by 42.0 percentage points five years after arrival.

Data table for Chart 3
| 2014 landing cohort | Years since landing | |||||
|---|---|---|---|---|---|---|
| 1 | 2 | 3 | 4 | 5 | 6 | |
| percent | ||||||
| Government-assisted refugees | 93.4 | 68.3 | 61.2 | 54.3 | 46.8 | 42.3 |
| Privately sponsored refugees | 16.3 | 24.7 | 24.6 | 22.1 | 19.6 | 17.4 |
| Blended visa office-referred refugees | 72.1 | 50.9 | 44.3 | 33.9 | 30.1 | 29.2 |
| Source: Statistics Canada, Longitudinal Immigration Database. | ||||||
Comparatively, the share of PSRs who reported social assistance one year after arrival was significantly lower than that of GARS and BVOR refugees, at 16.3%. This is likely because private sponsors are expected to assume all financial costs associated with resettling refugees in the Private Sponsorship of Refugees program, in the first year after arrival. Unlike GARs and BVOR refugees, the share of PSRs who accessed social assistance increased by the second year in Canada; this may reflect a private sponsor’s decision to cease providing financial assistance after the first year of resettlement. While PSRs’ use of social assistance began to decline by the fourth year since landing, the share with social assistance income was still 5.8 percentage points higher than in the first year after landing.
Similar to employment incidence and median employment earnings, the incidence of social assistance among BVOR refugees varied largely across landing cohorts, and the cohort differences tended to persist over time (Table 4). For instance, the share of BVOR refugees who landed in 2015 who reported social assistance income was 14.5 percentage points higher than that of those who had landed in 2014. Subsequent landing cohorts also reported similar fluctuations, with the share of BVOR refugees who reported social assistance ranging from 75.8% to 87.7%. In contrast, among GARs, the share who accessed social assistance one year after landing was fairly consistent. This is perhaps not surprising given that RAP income support provided to GARs did not significantly change over the 2014-to-2019 period. For PSRs, those who landed in 2016 reported notably higher social assistance rates in the first year after arrival than other landing cohorts, but the cohort differences mostly disappeared by the second year. Given that 2016 was marked by the large-scale Syrian refugee resettlement initiative, one explanation for the increase could be that private sponsors were motivated to participate in the Private Sponsorship of Refugees program, but perhaps could not fully commit to the financial undertaking required.
| Years since landing | ||||||
|---|---|---|---|---|---|---|
| 1 | 2 | 3 | 4 | 5 | 6 | |
| percent | ||||||
| Government-assisted refugees | ||||||
| 2014 cohort | 93.4 | 68.3 | 61.2 | 54.3 | 46.8 | 42.3 |
| 2015 cohort | 92.3 | 75.3 | 66.1 | 58.4 | 50.4 | Note ..: not available for a specific reference period |
| 2016 cohort | 96.2 | 83.7 | 76.2 | 69.5 | Note ..: not available for a specific reference period | Note ..: not available for a specific reference period |
| 2017 cohort | 94.4 | 73.5 | 63.1 | Note ..: not available for a specific reference period | Note ..: not available for a specific reference period | Note ..: not available for a specific reference period |
| 2018 cohort | 90.9 | 71.5 | Note ..: not available for a specific reference period | Note ..: not available for a specific reference period | Note ..: not available for a specific reference period | Note ..: not available for a specific reference period |
| 2019 cohort | 92.8 | Note ..: not available for a specific reference period | Note ..: not available for a specific reference period | Note ..: not available for a specific reference period | Note ..: not available for a specific reference period | Note ..: not available for a specific reference period |
| Privately sponsored refugees | ||||||
| 2014 cohort | 16.3 | 24.7 | 24.6 | 22.1 | 19.6 | 17.4 |
| 2015 cohort | 15.0 | 23.6 | 22.7 | 20.7 | 17.4 | Note ..: not available for a specific reference period |
| 2016 cohort | 21.1 | 23.7 | 22.0 | 19.8 | Note ..: not available for a specific reference period | Note ..: not available for a specific reference period |
| 2017 cohort | 17.9 | 21.7 | 19.4 | Note ..: not available for a specific reference period | Note ..: not available for a specific reference period | Note ..: not available for a specific reference period |
| 2018 cohort | 16.6 | 18.6 | Note ..: not available for a specific reference period | Note ..: not available for a specific reference period | Note ..: not available for a specific reference period | Note ..: not available for a specific reference period |
| 2019 cohort | 13.1 | Note ..: not available for a specific reference period | Note ..: not available for a specific reference period | Note ..: not available for a specific reference period | Note ..: not available for a specific reference period | Note ..: not available for a specific reference period |
| Blended visa office-referred refugees | ||||||
| 2014 cohort | 72.1 | 50.9 | 44.3 | 33.9 | 30.1 | 29.2 |
| 2015 cohort | 86.6 | 64.7 | 60.7 | 53.6 | 50.4 | Note ..: not available for a specific reference period |
| 2016 cohort | 77.0 | 62.7 | 58.5 | 53.7 | Note ..: not available for a specific reference period | Note ..: not available for a specific reference period |
| 2017 cohort | 75.8 | 60.4 | 56.4 | Note ..: not available for a specific reference period | Note ..: not available for a specific reference period | Note ..: not available for a specific reference period |
| 2018 cohort | 87.7 | 62.4 | Note ..: not available for a specific reference period | Note ..: not available for a specific reference period | Note ..: not available for a specific reference period | Note ..: not available for a specific reference period |
| 2019 cohort | 78.8 | Note ..: not available for a specific reference period | Note ..: not available for a specific reference period | Note ..: not available for a specific reference period | Note ..: not available for a specific reference period | Note ..: not available for a specific reference period |
.. not available for a specific reference period
|
||||||
Multivariate analysis results
Employment earnings incidence
The multivariate analysis was performed for each landing cohort to investigate the extent to which the observed differences in employment earnings incidence between BVOR refugees, GARs and PSRs are associated with their differences in sex, age, education, official language, source region and CMA of residence (detailed tables are not presented here). The results discussed here focus on the 2015 landing cohort. When the differences in the selected sociodemographic characteristics were taken into consideration, the differences between GARs and BVOR refugees in the incidence of employment earnings increased by an estimated 3 percentage points in each of the five years since landing. This suggests that with similar sociodemographic characteristics, BVOR refugees would have an even larger advantage in the incidence of employment earnings over GARs. Further decomposition analysis shows that a key factor was the difference in source regions. In the 2015 landing cohort, proportionately more BVOR refugees than GARs came from Western Asia, and refugees from Western Asia tended to have a lower employment earnings incidence than refugees from other source regions.
With similar sociodemographic characteristics, the observed difference in the employment earnings incidence between PSRs and BVOR refugees declined by about 7 percentage points (or 27% to 34%). This was mostly because PSRs had a higher educational level, were more likely to speak an official language and had a higher share of males than BVOR refugees.
The analysis also observed that the role of sociodemographic characteristics in accounting for differences in employment earnings incidence varied by arrival year. For instance, in the 2017 landing cohort, the differences in sociodemographic characteristics accounted for little of the differences in the first-year employment earnings incidence between GARs and BVOR refugees and accounted for about 21% to 26% of the differences in the employment earnings incidence between PSRs and BVOR refugees.
Multivariate analysis was also performed to examine differences among arrival cohorts of BVOR refugees. The results showed that the differences in the first-year employment earnings incidence among the 2015-to-2018 landing cohorts were not statistically significant, although the 2014 cohort had a significantly higher employment earnings incidence than those who arrived from 2015 to 2018, and the 2019 cohort had a significantly higher employment earnings incidence than the 2015-to-2018 arrivals. However, the 2014 landing cohort was small, and, because it was the first year of the program, it is pertinent not to draw conclusions from this result. The 2019 landing cohort had a higher employment earnings incidence related to a larger share of refugees from Africa (particularly the Democratic Republic of the Congo and Eritrea) and a much lower share from Western Asia. The former groups tended to have a higher employment earnings incidence than the latter group.
Median employment earnings
As noted in the descriptive analysis section, PSRs reported significantly higher earnings than both GARs and BVOR refugees. The multivariate analysis for the 2015 cohort showed that the observed differences in sociodemographic characteristics accounted for little of the earnings advantage of PSRs over BVOR refugees.
In the first year since landing, BVOR refugees who arrived in 2015 earned significantly less than those who arrived in other years, while the first-year earnings of other arrival cohorts were not significantly different. The selected sociodemographic characteristics accounted for 13% to 32% of the differences in the first-year earnings between the 2015 cohort and other cohorts. The key variable for the differences between the 2015 and 2014 cohorts was source region, where a proportionately larger share of the 2015 cohort came from Western Asia. Source region was also the key factor for the earnings difference between the 2015 and 2019 cohorts, where the majority of the 2019 landing cohort was from Africa. Lastly, the key variable for the differences between the 2015 cohort and the 2016-to-2019 cohorts was the sex composition, where it was observed that there were proportionately more female workers in the 2015 cohort than in the later cohorts.
Social assistance
When considering similar sociodemographic characteristics, the multivariate analysis found that the differences in social assistance use between GARs and BVOR refugees would increase slightly by an estimated 2 percentage points. The key variable affecting the difference in accessing social assistance between GARs and BVOR refugees was source region. In the 2015 cohort, BVOR refugees were more likely to come from Western Asia than GARs, and refugees from Western Asia had a higher incidence of social assistance than refugees from other regions.
With similar sociodemographic characteristics, the difference in social assistance use between PSRs and BVOR refugees would decrease by about 7 percentage points. The main factors affecting the social assistance gap between PSRs and BVOR refugees were CMA of residence, education and official language. BVOR refugees were more likely to live in small CMAs, and small urban and rural areas, where refugees tended to have a higher social assistance rate than their counterparts living in the three largest CMAs (Montréal, Toronto and Vancouver).
One year after arrival, BVOR refugees who landed in 2015 and 2018 had higher rates of social assistance use than those who arrived in other years. The selected sociodemographic characteristics accounted for about half of the differences between the 2015 and 2019 cohorts and between the 2018 and 2019 cohorts. Like in the analysis above, the key factor accounting for these differences was source region.
Discussion and conclusion
This study analyzed the short-term economic outcomes of resettled refugees admitted in the BVOR Program and compared these outcomes with those of refugees resettled through the GAR and PSR streams. Using data from the IMDB, this report examined trends in the incidence of employment earnings, median employment earnings and the incidence of social assistance among resettled refugees who landed from 2014 to 2019. The study also evaluated the extent to which differences in refugees’ sociodemographic characteristics could explain the difference in the labour market outcomes of BVOR refugees, GARs and PSRs, as well as changes in BVOR refugees’ outcomes across landing cohorts.
In terms of labour market performance, the report found that among resettled refugees, PSRs were the most likely to report employment income, as well as to have higher median employment earnings, one year after landing. BVOR refugees reported stronger labour market outcomes than GARs but fell behind PSRs. Nonetheless, the study found that the employment earnings of GARs and BVOR refugees experienced more growth over time than those of PSRs, with BVOR refugees reporting similar employment earnings as PSRs five years after arrival.
The labour market advantage observed among PSRs may be attributable to human capital characteristics, such as the higher educational attainment of PSRs compared with other resettled refugees, as well as their higher rates of official language proficiency at arrival. Furthermore, PSRs may also benefit from support from their sponsorship networks in securing employment shortly after landing in Canada. The role of sponsorship may have also benefited BVOR refugees’ employment outcomes, where it was observed that despite BVOR refugees in later landing cohorts possessing similar human capital characteristics as GARs, BVOR refugees consistently reported a higher incidence of employment earnings one year after arrival.
The analysis on social assistance use found that both GARs and BVOR refugees reported considerably higher rates of social assistance than PSRs, in their first year after arrival. This was likely because GARs and BVOR refugees collected RAP income support in their first year in Canada, while PSRs were expected to receive financial support from their sponsors. The share of GARs and BVOR refugees with social assistance income gradually declined over time. Comparatively, the share of PSRs who accessed social assistance increased between the first and second years after arrival. This may be explained by PSRs seeking government financial assistance after their sponsorship period has ended.
The multivariate analysis found that if selected characteristics were held constant, BVOR refugees would have an even larger advantage in the incidence of employment earnings over GARs. The analysis also found that the observed differences in sociodemographic characteristics accounted for little of the earnings advantage of PSRs over BVOR refugees.
The findings in this report may inform policy discussions in several ways. Firstly, a key finding of this study is that in the short-term, BVOR refugees benefit from the sponsorship model. In particular, the observation that BVOR refugees outperform GARs with a similar sociodemographic background underscores the advantage of sponsorship. As the BVOR Program serves to “blend” the government-funded and private sponsorship models, refugees admitted through this stream have demonstrably improved outcomes. Secondly, the finding that PSRs report stronger outcomes than BVOR refugees with a similar background is also notable. While BVOR refugees are paired with sponsors in Canada at random, sponsors have a more direct role in selecting PSRs than in being paired with BVOR refugees. There may be a difference in the level of commitment (e.g., because of differences in family connections) and needs between refugees who are sponsored through the Private Sponsorship of Refugees program compared with the BVOR stream. Lastly, the findings of this report highlight that despite not being selected on their ability to integrate economically, all three refugee groups had stronger labour market outcomes over time. This finding emphasizes the need to continually support and meet resettlement targets, particularly related to the BVOR Program, where admissions have declined in recent years.
Appendix
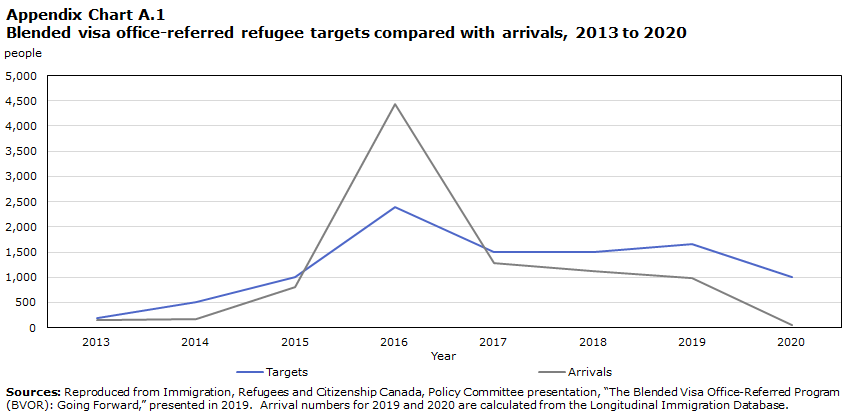
Data table for Chart A.1
| Year | Targets | Arrivals |
|---|---|---|
| people | ||
| 2013 | 200 | 153 |
| 2014 | 500 | 177 |
| 2015 | 1,000 | 810 |
| 2016 | 2,400 | 4,435 |
| 2017 | 1,500 | 1,280 |
| 2018 | 1,500 | 1,115 |
| 2019 | 1,650 | 993 |
| 2020 | 1,000 | 52 |
| Sources: Reproduced from Immigration, Refugees and Citizenship Canada, Policy Committee presentation, “The Blended Visa Office-Referred Program (BVOR): Going Forward,” presented in 2019. Arrival numbers for 2019 and 2020 are calculated from the Longitudinal Immigration Database. | ||
References
Canadian Council for Refugees (2016). Statement on Blended Visa Office Referred Refugees.
Department of Justice (2002). Immigration and Refugee Protection Act. Section 3(2)f. IRPA objectives and application.
Evra, R., & Prokopenko, E. (2018). Longitudinal Immigration Database (IMDB) Technical Report, 2016.
Government of Canada. (2001). Immigration and Refugee Protection Act (S.C. 2001, c. 27).
Hyndman, J., Payne, W., & Jimenez, S. (2017). Private refugee sponsorship in Canada. Forced Migration Review, (54), 56.
IRCC [Immigration, Refugees and Citizenship Canada]. (2016a). Evaluation of the Resettlement Programs (GAR, PSR, BVOR and RAP).
IRCC [Immigration, Refugees and Citizenship Canada]. (2016b). Notice – Supplementary Information 2017 Immigration Levels Plan.
IRCC [Immigration, Refugees and Citizenship Canada]. (2018). IMDB 2014 Immigration Category Profile Series.
IRCC [Immigration, Refugees and Citizenship Canada]. (2019). Syrian Outcomes Report.
IRCC [Immigration, Refugees and Citizenship Canada]. (2020). Departmental Plan 2020-2021.
IRCC [Immigration, Refugees and Citizenship Canada] (2021a). Government-assisted Refugees program.
IRCC [Immigration, Refugees and Citizenship Canada] (2021b). Guide to the Private Sponsorship of Refugees Program.
IRCC [Immigration, Refugees and Citizenship Canada] (2021c). Blended Visa Office-Referred Program: About the program.
IRCC [Immigration, Refugees and Citizenship Canada] (2021d). What are the responsibilities of a sponsoring group?.
Jedwab, J. (2018). GARs vs PSRs: Explaining differences in outcomes for recent refugees to Canada. Canadian Diversity / Diversité canadienne, 15, 38-46.
Kaida, L., Hou, F., & Stick, M. (2020). The long-term economic integration of resettled refugees in Canada: a comparison of Privately Sponsored Refugees and Government-Assisted Refugees. Journal of Ethnic and Migration Studies, 46(9), 1687-1708.
Kaida, L., Stick, M., & Hou, F. (2022). Short-, medium- and long-term employment-related outcomes of resettled refugees. Pp. 216-235. In E. Martani and D. Helly (eds) Asylum and resettlement in Canada: Historical development, successes, challenges and lessons. Genova University Press.
Labman, S., & Pearlman, M. (2018). Blending, bargaining, and burden-sharing: Canada’s resettlement programs. Journal of International Migration and Integration, 19(2), 439–449.
Picot, G., Zhang, Y., & Hou, F. (2019). Labour market outcomes among refugees to Canada. Analytical Studies Branch Research Paper Series, No. 419.
Portes, A., & Rumbaut, R. G. (2001). Legacies: The story of the immigrant second generation. University of California Press.
Vineberg, R. (2018). Canada’s refugee strategy–How it can be improved. Vol. 11:14. University of Calgary: The School of Public Policy Publications.
- Date modified: